Using Data to Understand Our New Transportation Reality - Laura Schewel, StreetLight Ronald T. Milam, Fehr & Peers Eric Womeldorff, Fehr & Peers ...
←
→
Page content transcription
If your browser does not render page correctly, please read the page content below
Using Data to
 Understand Our New
Transportation Reality
                            Presented by

           La ura Schewel, StreetLight
       Rona ld T. Mila m, Fehr & Peers
       Eric Womeldorff, Fehr & Peers

          Urba nism Next – Ma y 2020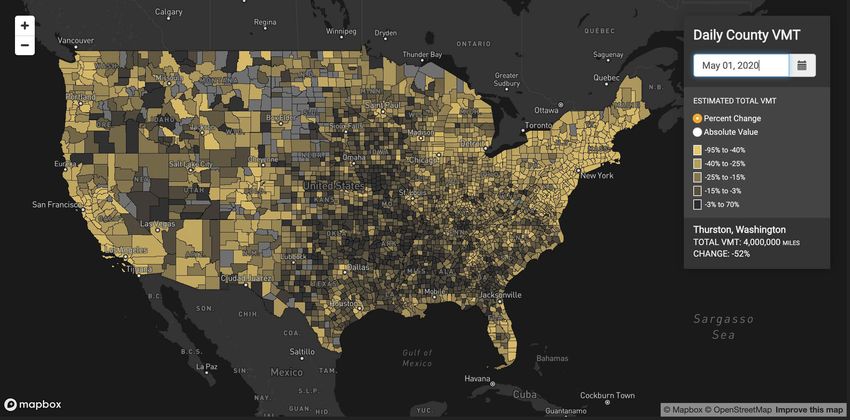
StreetLight InSight® is an interactive transportation data
platform

                                      • It’s not a model, a report or
                                        a static heatmap.
                                      • It's your self-serve desktop
                                        software with on-demand
                                        access to accurate
                                        mobility metrics.

                                          STREETLIGHT PROPRIETARY & CONFIDENTIAL |   2
How we get there:
(Privacy forward) Big Data + Data Science

                                                                    • Every month, we process
                                                                      over 100 billion anonymized
                                                                      location records from smart
                                                                      phones and GPS
                                                                      navigation devices in cars
                                                                      and trucks.

                                                                    • Route Science® transforms
                                                                      them into contextualized,
                                                                      normalized and aggregated
MOBILE DEVICE DATA
from ~28% of U.S. and Canadian adults
                                                      CONTEXT
                                                                      travel patterns.
                                                     Parcel Data
Example, San Bernardino, CA             Digital Road Network Data
Oct 8, 2017 24-hr snapshot                            U.S. Census

                                                                       STREETLIGHT PROPRIETARY & CONFIDENTIAL |   3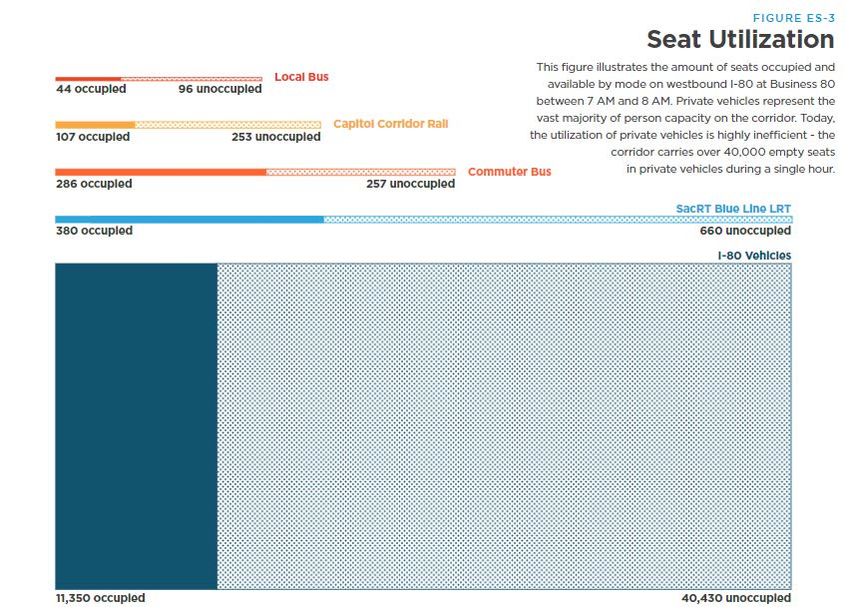
US VMT Dropped Dramatically From March 1 to May 1
                                                                  Change in VMT Relative to Baseline
                                                                            United States
  1.4

  1.2

    1

  0.8

  0.6

  0.4

  0.2

    0
        20     20     20     20     20   20   20   20   20   20   20   20   20   20   20   20     20     20     20     20   20   20   20   20   20   20   20   20   20   20   20
  / 1/20 / 3/20 / 5/20 / 7/20 / 9/20 1/20 3/20 5/20 7/20 9/20 1/20 3/20 5/20 7/20 9/20 1/20 / 2/20 / 4/20 / 6/20 / 8/20 0/20 2/20 4/20 6/20 8/20 0/20 2/20 4/20 6/20 8/20 0/20
 3       3      3      3      3     3/ 1 3/ 1 3/ 1 3/ 1 3/ 1 3/ 2 3/ 2 3/ 2 3/ 2 3/ 2 3/ 3  4      4      4      4     4/ 1 4/ 1 4/ 1 4/ 1 4/ 1 4/ 2 4/ 2 4/ 2 4/ 2 4/ 2 4/ 3

                                                                           So What?
                                                                                                                                 STREETLIGHT PROPRIETARY & CONFIDENTIAL |          4
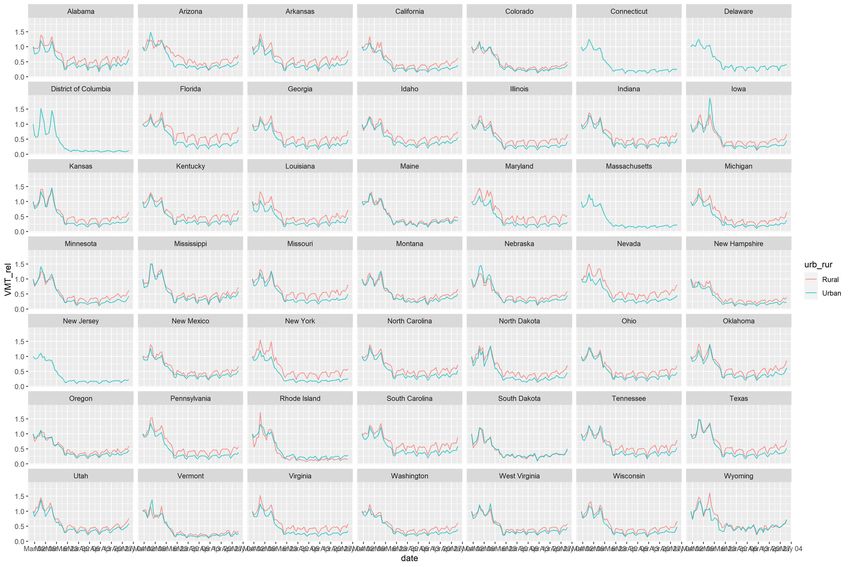
Fall Off Was Not the Same Everywhere

                                       STREETLIGHT PROPRIETARY & CONFIDENTIAL |   5
Fall Off Was Not the Same Everywhere

                                       STREETLIGHT PROPRIETARY & CONFIDENTIAL |   6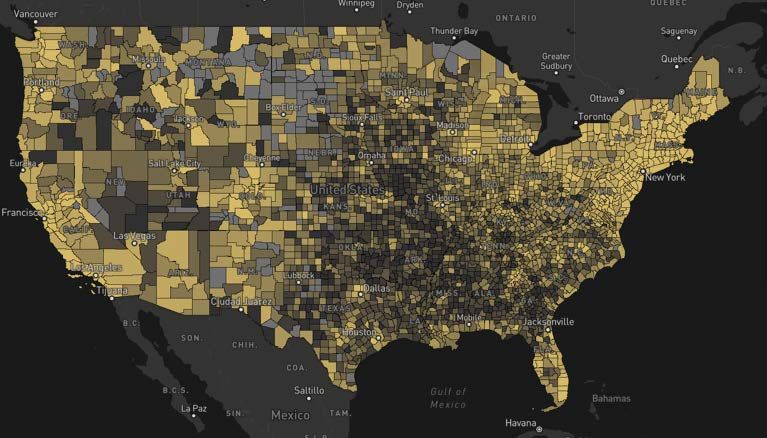
3/
1/
0
1
0.2
0.4
0.6
0.8
1.2
1.4
1.6
20
3/ 20
3/
20
3/ 20
5/
20
3/ 20
7/
20
3/ 20
9/
2
3/ 02
11 0
/2
3/ 02
13 0
/2
3/ 02
15 0
/2
3/ 02
17 0
/2
3/ 02
19 0
/2
3/ 02
21 0
/2
3/ 02
23 0
/2
3/ 02
25 0
/2
3/ 02
27 0
/2
3/ 02
29 0
/2
3/ 02
31 0
/2
Rural
0
4/ 20
2/
20
4/ 20
4/
20
4/ 20
6/
Urb an
20
4/ 20
8/
2
Urban & Rural Counties
4/ 02
10 0
/2
4/ 02
12 0
/2
Change in VMT Relative to Baseline
4/ 02
14 0
/2
4/ 02
16 0
/2
4/ 02
18 0
Rural VMT Fell More than Urban
/2
4/ 02
20 0
/2
4/ 02
22 0
/2
4/ 02
24 0
/2
4/ 02
26 0
/2
4/ 02
28 0
/2
4/ 02
30 0
/2
02
0
•
•
•
•
•
Why?
Culture
Income
Mix of jobs
Lack of delivery options
Urban form / accessibility
STREETLIGHT PROPRIETARY & CONFIDENTIAL |
7
Urban v.
Rural is not
consistent
State by
State

               STREETLIGHT PROPRIETARY & CONFIDENTIAL |   8
Two Examples

               STREETLIGHT PROPRIETARY & CONFIDENTIAL |   9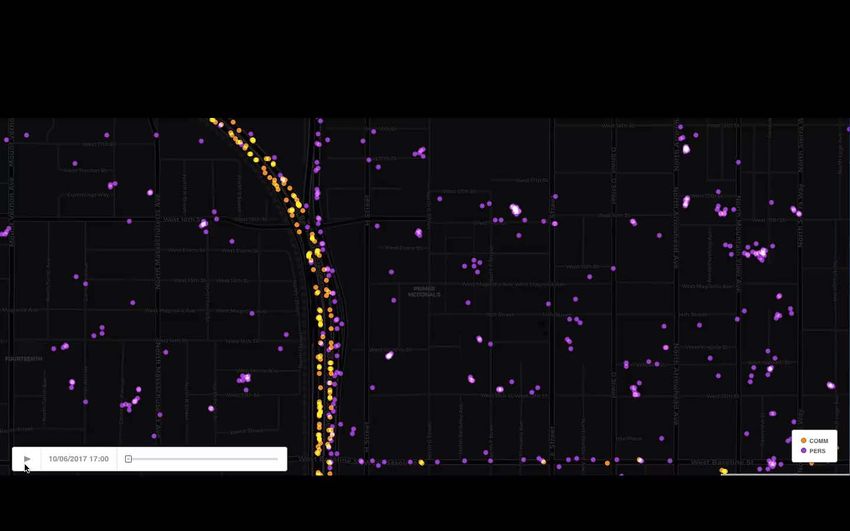
Income Definitely Matters (Especially in Urban Areas)

                                          Urban Counties - Income and VMT Reduction                                                                 Rural Counties - Income and VMT Reduction
                                 2                                                                                                         2

                                1.8                                                                                                       1.8

                                1.6                                                                                                       1.6
                                                                                                                                                                                        y = -0.9935x + 5.3603
Change in VMT March 1 - May 1

                                                                                                                                                                                             R² = 0.1571

                                                                                                            VMT Change March 1 to May 1
                                1.4                               y = -1.1645x + 5.9882                                                   1.4
                                                                       R² = 0.4602
                                1.2                                                                                                       1.2

                                 1                                                                                                         1

                                0.8                                                                                                       0.8

                                0.6                                                                                                       0.6

                                0.4                                                                                                       0.4

                                0.2                                                                                                       0.2

                                 0                                                                                                         0
                                      4    4.2    4.4    4.6       4.8        5           5.2   5.4   5.6                                       4    4.2    4.4    4.6       4.8         5         5.2          5.4   5.6
                                                               Log (Income)                                                                                              Log (Income)

                                                                                                                                                                  STREETLIGHT PROPRIETARY & CONFIDENTIAL |                  10
Population Density Matters (Especially in Urban Areas)
Population Density and VMT - Urban Counties Population Density and VMT - Rural Counties
2 2
1.8 1.8
1.6 1.6
Change in VMT March 1 - May 1
Chang in VMT March 1 - May 1
y = -0.0392x + 0.6349
1.4 1.4 R² = 0.0323
1.2 y = -0.0762x + 0.4218 1.2
R² = 0.3181
1 1
0.8 0.8
0.6 0.6
0.4 0.4
0.2 0.2
0 0
-8 -6 -4 -2 0 2 4 6 -8 -6 -4 -2 0 2 4 6
Log - Population Density Log - Population Density
STREETLIGHT PROPRIETARY & CONFIDENTIAL | 11Job Mix Matters
BEA Compensation of Employees by Industry (SQINC6N) Share of Industry vs. VMT Change
Strong Negative – More of these jobs means Strong Positive – More of these jobs means
MORE VMT fall off LESS VMT fall off
Educational services Transportation and warehousing
Professional, scientific, and technical services Utilities
Finance and insurance Construction
Information Government - State and local
Government - Federal civilian Nondurable goods manufacturing
Arts, entertainment, and recreation Mining, quarrying, and oil and gas extraction
Retail trade
Forestry, fishing, and related activities
Farm compensation
Military
STREETLIGHT PROPRIETARY & CONFIDENTIAL | 12E-Commerce / Delivery Impact Varies
(Collaborative Study with BCG)
STREETLIGHT PROPRIETARY & CONFIDENTIAL | 13How can all this data help us come back better than we
were before?
Where should we What’s the balance
What will of eCommerce and
preserve some of the
revenues be?
“negamiles” of retail spaces? Local, granular data
telework?
for local decisions
What is a city Where should we How do we return to
with less tourism? preserve the “cheap” shared vehicles
infrastructure of road (buses, trains,
closures? scooters, etc.)?
STREETLIGHT PROPRIETARY & CONFIDENTIAL | 14How can all this data help us come back better than we
were before?
Re-
Plan
measure
We need to:
1. Revise our notion of “long
range” planning and
2. Throw out the habit 3-, 5-, 10-
year data collection cycles
Adjust Implement
Measure
STREETLIGHT PROPRIETARY & CONFIDENTIAL | 15Using Data to
Understand Our New
Transportation Reality
Presented by
La ura Schewel, StreetLight
Rona ld T. Mila m, Fehr & Peers
Eric Womeldorff, Fehr & Peers
Urba nism Next – Ma y 2020Population
Projections U.S. POPULATION PROJECTIONS BY
IMMIGRATION SCENARIO (2017-2060)
Population Growth Slowing
Source: US Census BureauPre-COVID-19
Travel Market
Trends
TRENDS IN PERSON
TRIPS BY PURPOSE
(1990 TO 2017)
Daily Trip Rate Estimate
Other
Social Activities
School/Church
Shopping/Errands
To or From Work
Source: Nancy McGuckin and Anthony
Fucci, Summary of Travel Trends Findings
from the 2017 NHTSTravel Demand
Model Limitations
Model View of Activity/Travel Actual View of Activity/Travel
Fitness
Netflix/
Hulu
Food e-Work/
Delivery Educ./Med.
AmazonTravel Pattern
Changes.. INCREASED ONLINE SHOPPING AND
REDUCED IN-STORE SHOPPING
Daily Delivery Intensity
Shopping Location
26% 74%
Delivery Location
39% 61%Pre-COVID-19
Transportation
Problems STATE HIGHWAY CONGESTION
INCREASING IN RECENT YEARS
Vehicle Hours of Delay (in Millions)
150
100
50
Source:https://lao.ca.gov/Publications/Report/3860Problem or
Symptom?
CARS ARE MOVING TOO SLOW AND
TRAVEL TIMES ARE UNRELIABLEWrong CONGESTION OCCURS BECAUSE OF
Problem POOR SEAT UTILIZATION CAUSED BY
MISPRICING TRAVEL
Definitions?
Business 80 – Sacramento, CA
2019 Peak Hour, Peak Direction
Seat UtilizationExpectations
Missed? HOV LANE EXPANSION VS
CARPOOL MODE SHAREA Pandemic Reset…
A Sense of
Urgency…

Source:
https://www.tomto
m.com/en_gb/traffi
c-index/wuhan-
traffic/
New Problems…
What Defines a Transportation
Problem in the New Normal?
How to operate transit to maximize            How much roadway space to allocate
revenue from ridership?                       to active modes?

How to fund transit so that it is free for    How much roadway or parking space to
essential workers?                            allocate to revenue generating uses?

How to manage personal health risk in         How to incorporate personal health risk
transit vehicles?                             in travel forecasting models?

How to manage roadway demand to improve       How to ‘flatten demand curves’ for travel
travel time performance, reduce collisions,   on facilities with limited supply?
& minimize emissions?
Flattening the
Congestion Curve
Typical Speeds     COVID-19 Speeds

                         Desired Speed Range For Co-Benefits
Using Data to
Understand Our New
Transportation Reality
Presented by
La ura Schewel, StreetLight
Rona ld T. Mila m, Fehr & Peers
Eric Womeldorff, Fehr & Peers
Urba nism Next – Ma y 2020Storm Renders Compass Useless
Flattening
the Curve
Through
Space
and Time
Our
Experiences
Can be
Vastly
Different
              Illustrations: GAO, Streetlight Data, NOAA, The New York Times
Distributions
of Responses
Illustration: https://blog.minitab.com/blog/statistics-in-the-field/a-field-guide-to-statistical-distributionsTrends
Like
Waves
Illustration: Wave Wisdom, Boat US
Gathering Accelerating BreakingBreaking Waves
Illustration: boredpanda.com/wave-photography-ray-collins/Breaking Waves
• Labor force participation • Restaurants shift to take-
out/delivery if they can
• GDP/Real income per capita
• Local/state revenues crater
• Reduced household
formation/increases • Low auto operating costs
in intergenerational households (as a function of low oil/gas
prices,
• Telework, like now
rather than available credit)
• Schools out
• Cheap gas
• Online grocery arrivesAccelerating Waves
Illustration: National Weather Service
Illustration: boredpanda.com/wave-photography-ray-collins/Accelerating Waves
• Telework is (probably) in your • The Big (companies) get bigger
future
• Publishing and local news recede
• The restaurant industry
• From (movie) theaters to streaming
shrinks/consolidates
• We’re all Zooming
• Retail moves online and comes to
you • Hybrid retail uses, particularly with
(rather than you going to it) commercial real estate in trouble
• Telehealth expands • Local/state budget cuts
• Gig work increasesGathering Waves
Illustration: boredpanda.com/wave-photography-ray-collins/Gathering Waves
• Shifting home preferences? • Are we ready for remote learning?
Accreditation? MOOC?
• Less time in the office, so less
office? • Increased investment in robotics
and automation
• Commercial real estate in a bind?
• What of business and tourism
• Declustering as strategy?
travel?
• Rural/suburban tech diaspora?
• Reordered manufacturing hubs,
• Are we all still ‘sharing’? supply chainsResponses Require
Fast and Slow
Thinking
The Tortoise and the Hare, Francis Barlow, Royal Academy of Arts LondonFast Responses
• Federal Reserve, • Cities/transportation
Congressional, agencies
State and Local responses
o Changing transit on the
• Private and non-profit fly
sectors
o Street closures
filling gaps, stepping up
o Repurposing curb
• Public acceptance of shelter
in place orders o Repurposing parking
• Tenant protectionsSlow Responses • Rethinking the system to keep the ‘gains’ • Standing public transit back up • Taking steps to reduce inequality • Sustaining ingenuity
Looking Forward
 •#1 We’re not going back
 •#2 This is a warning
 •#3 Don’t get lost in the future
 •#4 The world is what we
  make of it
You can also read