The Impact of a Stealth CME on the Martian Topside Ionosphere
←
→
Page content transcription
If your browser does not render page correctly, please read the page content below
MNRAS 000, 000–000 (2020)                                        Preprint 19 February 2021              Compiled using MNRAS LATEX style file v3.0

                                               The Impact of a Stealth CME on the Martian Topside Ionosphere
                                               Smitha V. Thampi ? , C. Krishnaprasad, Govind G. Nampoothiri, and Tarun K. Pant
                                               Space Physics Laboratory, Vikram Sarabhai Space Centre, Thiruvananthapuram 695022, India

                                               19 February 2021
arXiv:2102.09304v1 [astro-ph.EP] 18 Feb 2021

                                               ABSTRACT

                                                 Solar cycle 24 is one of the weakest solar cycles recorded, but surprisingly the declining phase of it had a slow CME which
                                               evolved without any low coronal signature and is classified as a stealth CME which was responsible for an intense geomagnetic
                                               storm at Earth (Dst = -176 nT). The impact of this space weather event on the terrestrial ionosphere has been reported. However,
                                               the propagation of this CME beyond 1 au and the impact of this CME on other planetary environments have not been studied
                                               so far. In this paper, we analyse the data from Sun-Earth L1 point as well as from the Martian orbit (near 1.5 au) to understand
                                               the characteristics of the stealth CME as observed beyond 1 au. The observations near Earth are using data from the Solar
                                               Dynamics Observatory (SDO) and the Advanced Composition Explorer (ACE) satellite located at L1 point whereas those near
                                               Mars are from the instruments for plasma and magnetic field measurements on board Mars Atmosphere and Volatile EvolutioN
                                               (MAVEN) mission. The observations show that the stealth CME has reached 1.5 au after 7 days of its initial observations at the
                                               Sun and caused depletion in the nightside topside ionosphere of Mars, as observed during the inbound phase measurements of
                                               the Langmuir Probe and Waves (LPW) instrument on board MAVEN. These observations have implications on the ion escape
                                               rates from the Martian upper atmosphere.
                                                  Key words: Sun: coronal mass ejections (CMEs), Sun: helio-               region of stealth CMEs. A recent study on the magnetic field configu-
                                               sphere, planets and satellites: terrestrial planets, planets and satel-     ration in which the stealth CME occur, show distinct episodes of flare
                                               lites: atmospheres, planet–star interactions, Earth                         ribbon formation in the stealth CME source active region (O’Kane
                                                                                                                           et al. 2020). In stealth CMEs, the energy storage and release sequence
                                                                                                                           do happen, but the energy release is weak, which is probably asso-
                                                                                                                           ciated with the magnetic reconnection during the eruption or due to
                                               1 INTRODUCTION                                                              an instability process (O’Kane et al. 2019). The stealth CMEs have
                                                                                                                           no usual solar eruption warning signs in the lower corona, making it
                                               Coronal Mass Ejections (CMEs) are eruptions on the Sun, by which            difficult for space weather predictions and therefore these may lead
                                               solar plasma and magnetic field are expelled into the heliosphere.          to unpredictable geomagnetic activity and ionospheric storms. Ma
                                               CME eruption processes involve an energy storage phase, which               et al. (2010) have done a statistical analysis of the source location of
                                               may be the product of flux emergence or photospheric flows fol-             the CMEs during solar minima and reported that almost one third of
                                               lowed by an energy release phase. There are different physical mech-        the CMEs occurring during the solar minimum period are of stealth
                                               anisms proposed for the eruption of CMEs, which include tether              type. Zhang et al. (2007) have studied the connection between the
                                               cutting or flux cancellation mechanism (Moore et al. 2001; Amari            solar eruptions and intense magnetic storms on Earth (Dst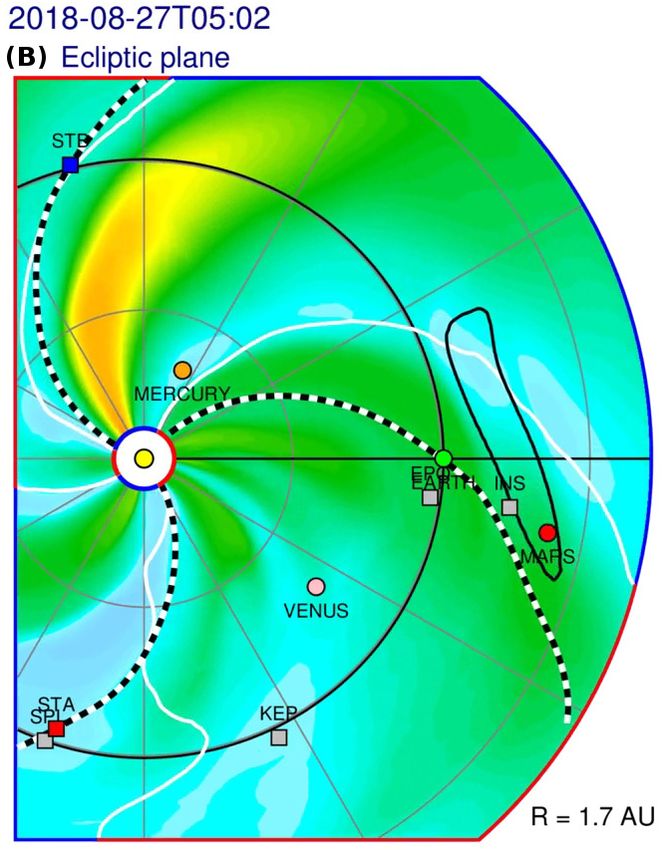
2 Smitha Thampi et al.
events like CMEs (Jakosky et al. 2015; Brain et al. 2016), understand- 3 OBSERVATIONS
ing the statistics of the stealth CMEs and their impacts are important
for quantifying the planetary atmospheric escape processes. 3.1 CME event
The declining phase of the SC–24 had a stealth CME (Mishra Figures 1(a), 1(c), and 1(e) show the images of the solar disk as seen
& Srivastava 2019), which caused an intense geomagnetic storm in the 211 Å images from the AIA on board SDO on 20 August
at Earth (Dst = -176 nT), which is the third most intense storm of 2018. These images show the signatures of a filament structure and
the SC–24 (Abunin et al. 2020; Piersanti et al. 2020). Astafyeva two coronal holes which produces fast solar wind. The quiescent
et al. (2020) mentioned it as a ‘surprise geomagnetic storm’ and filament structure passed over the coronal hole and partially erupted
studied its impact on Earth’s thermosphere and ionosphere using to a Coronal Plasma Channel (CPC). Figure 1(b), 1(d) and 1(f)
both space–based (the Swarm constellation, GUVI/TIMED) and show the region of the coronal plasma channel, at different stages
ground–based (GPS receivers, magnetometers, SuperDARN) instru- of development. Several other instances of the development of this
ments. However, the arrival and impact of this event on other plan- plasma channel leading to the filament eruption are given in Mishra
etary bodies have not been reported yet. In this study, we report the & Srivastava (2019). It is suggested that the spreading coronal plasma
solar wind and magnetic field observations from a vantage point near channel might have interacted with an open field line of the coronal
Mars to understand the arrival of this slow stealth CME and show hole (Mishra & Srivastava 2019), leading to a jet–like eruption. The
the response of Martian topside ionosphere to this event. hot coronal plasma channel is visible in other EUV filters of AIA
as well (Mishra & Srivastava 2019). Following this, a flux rope has
also evolved and erupted above the coronal plasma channel. So,
there are three ejections with very faint evidence in the lower corona,
which merged with each other to form a complex stealth CME, which
traveled through the interplanetary space which was observed in the
STEREO-A HI-2 (Heliospheric Imager-2) field of view on 24 August
2018, 08:09 UTC (Mishra & Srivastava 2019). The lower part of the
CME interacted with the terrestrial magnetosphere on 25 August
2 DATA 2018. The features of the eruptions, their interplanetary propagation
and the arrival at Earth are described in detail by Mishra & Srivastava
The solar observations are taken from Solar Dynamics Observatory (2019); Abunin et al. (2020); Chen et al. (2019); Piersanti et al.
(SDO)/Atmospheric Imaging Assembly (AIA; Lemen et al. (2012)) (2020). The HI images (Figure 11, Mishra & Srivastava (2019))
(https://sdo.gsfc.nasa.gov/) and the Solar and Heliospheric further show that the CME arrived near the Mars on 27 August 2018.
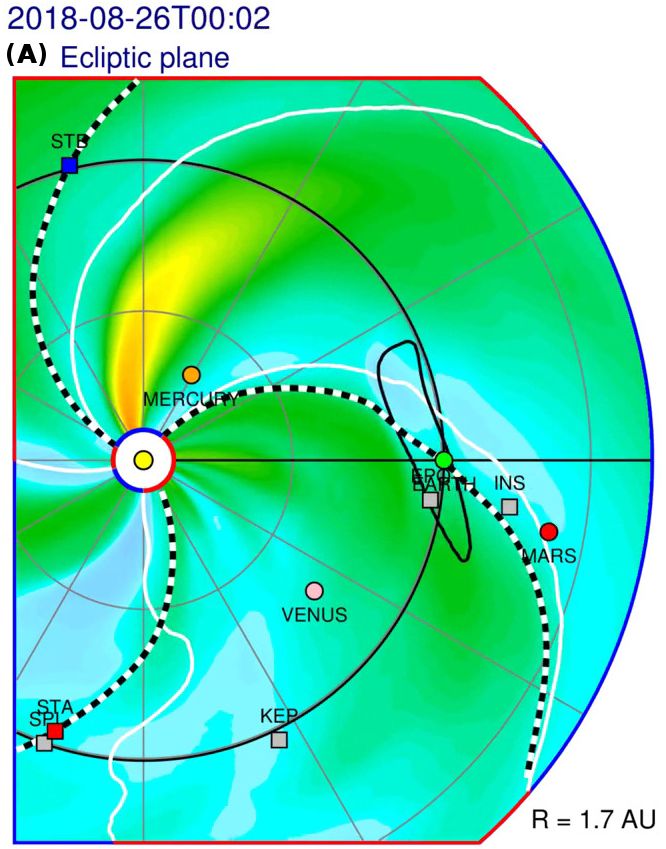
Observatory (SOHO) Large Angle and Spectrometric Coronagraph Figure 2 shows the WSA-ENLIL+Cone simulation snapshots dur-
(LASCO)-C2 (https://cdaw.gsfc.nasa.gov/CME_list/). We ing the passage of the stealth CME at Earth as well as during its arrival
have also used the Wang-Sheeley-Arge (WSA)–ENLIL+Cone model at Mars. The color shows the solar wind radial velocity. During the
(Odstrcil 2003; Mays et al. 2015) from ENLIL Solar Wind Predic- CME arrivals at Earth and Mars, the velocity is low. However, there is
tion (http://helioweather.net/) for understanding the relative a high speed stream possibly originated from the coronal hole. Chen
planetary positions and the global heliospheric context. The Inter- et al. (2019) reported that after the filament eruption, the coronal
planetary Magnetic Field (IMF) and solar wind speed near 1 au, as hole merged with a dimming region on 21 August 2018. This could
well as the Sym-H (representing the ring current) variations at Earth be the source of the fast solar wind stream, which followed the ICME
are obtained from the NASA Space Physics Data Facility (SPDF) and arrived at the planets.
OMNIWeb data center (https://omniweb.gsfc.nasa.gov/). Figure 3 shows the variation of IMF, solar wind velocity, proton
The datasets from the Mars Atmosphere and Volatile Evolu- density as well as dynamic pressure observed near Mars by MAVEN.
tioN (MAVEN) instruments are from the Planetary Data System The total B as well as the components are shown in Figure 3a. For
(https://pds.nasa.gov/). The solar wind speed and IMF values comparison, the Bz values observed at L1 are also shown in the figure.
near Mars are obtained from the Solar Wind Ion Analyzer (SWIA; Along with the other solar wind parameters observed by MAVEN
Halekas et al. (2015)) and Magnetometer (MAG; Connerney et al. shown in Figures 3(b-d), the near Earth values are also shown for
(2015)) instruments aboard MAVEN spacecraft. SWIA is an energy comparison. Apart from this, the Sym-H observed at Earth is also
and angular ion spectrometer that measures the energy and angular shown to depict the occurrence of the intense geomagnetic storm
distributions of solar wind ions of energy between 25 eV and 25 at Earth. It can be seen that, at Earth on 25-26 August the IMF Bz
keV with 48 logarithmically spaced energy steps. MAG is a fluxgate shows the signature of a magnetic cloud arriving at Earth. The IMF
magnetometer that measures the intensity and direction of the IMF. enhancement at Mars starts on 27 August and continues even on 28
The method to determine the upstream solar wind and IMF condi- August. The peak southward component at Earth is ∼16 nT, and the
tions from MAVEN is described by Halekas et al. (2017), and is total B is as high as 19 nT (Mishra & Srivastava 2019). At Mars,
used in several studies (e.g. Lee et al. (2017); Krishnaprasad et al. the peak B field strength is ∼10 nT. When the CME arrived, solar
(2020)). The Langmuir Probe and Waves (LPW; Andersson et al. wind velocity near Earth was ∼350 km s−1 which indicated that
(2015)) instrument on board MAVEN is used for the in situ electron this was a slowly propagating CME. The solar wind velocity near
density and electron temperature measurements [Level 2, version 3, Earth further showed an increase because of the high speed stream,
revision 01 (V03_R01)]. The Neutral Gas and Ion Mass Spectrom- and the peak velocity was observed on 28 August. Near Mars, the
eter (NGIMS; Mahaffy et al. (2014)) observations of MAVEN are solar wind velocity was ∼400 km s−1 , on the arrival of the ICME.
used to understand the variations of O+ 2 and O
+
ion densities in The arrival of the high speed stream followed, with peak velocity
the Martian ionosphere. NGIMS is a quadrupole mass spectrometer observed on 28 August. On both these planets, by the time the stream
which measures the composition of neutrals and thermal ions, in the arrived, the magnetic field enhancements and fluctuations (due to
mass range 2-150 amu with unit mass resolution. The NGIMS Level CME) diminished, indicating that the CME already passed. Both at
2 ion data version 08, revision 01 (V08_R01) are used. 1 au and 1.5 au, the CME structure was therefore bracketed between
MNRAS 000, 000–000 (2020)Stealth CME at Mars 3
the ambient slow wind and the high speed stream, thus enhancing the signal-to-noise ratios at regions where electron densities are below
effectiveness of interaction. Since MAVEN is in an elliptical orbit, densities of ∼200 cm−3 also result in LP temperature measurement
it observes the upstream solar wind conditions only intermittently errors increasing to 100% or more (Fowler et al. 2015), and therefore
(Halekas et al. 2017), making it difficult to infer the exact event we cannot infer these as the accurate profiles of Te during these days.
arrival time at Mars. Despite this, it is evident that the profiles during the ‘event orbits’
show trends which are significantly different (with enhanced values)
compared to ‘quiet orbits’.
3.2 Impact on Martian ionosphere
During August 2018, the inbound legs of the MAVEN spacecraft
were observing the nightside region from the near–dusk region to
near–midnight sector, and the outbound legs were observing the post 4 DISCUSSION
midnight sector. We make use of MAVEN in-situ observations from The CME event observed near the Sun on 20 August 2018 was a CME
the inbound phase to understand the response to the ICME. The data without a preceding shock, and is classified as a stealth CME (Mishra
from the outbound phase are not used because of the low signal & Srivastava 2019). The observations show that while reaching Mars,
levels (characteristic of deep nightside data, due to low plasma con- the maximum IMF was ∼10 nT, which may be considered as an
centrations). Observations during 24-26 August represent the typical intense space weather condition at Mars. The solar wind velocity
quiet time variation, and the observations on 27 and 28 August 2018 observed near Mars was ∼400 km s−1 , and this was a slow CME
represent the ‘event orbits’. inside a compression region between slow and fast solar winds, even
Table-1 shows the details of the MAVEN orbits used in this study, when it reached Mars.
such as variation in altitude, solar zenith angle (SZA), local solar
The slow, stealth CME impacted Martian topside ionosphere, and
time (LST), latitude, and longitude during inbound legs. These ob-
the nightside plasma measurements show that the topside thermal
servations pertain to the northern hemisphere of Mars where the
ionosphere is significantly depleted. The electron temperature mea-
influences of the crustal magnetic field are a minimum (Acuña et al.
surements showed enhancements during this event period. Similar
1999). It has been observed that during nightime, the largest peak ion
observations were reported by Cravens et al. (1982) for the Venu-
densities are found near vertical crustal fields, which form cusps that
sian nightside ionosphere. On days when disappearing ionospheres
allow energetic electron precipitation, whereas smaller peak densi-
were observed by the OETP (Orbiter Electron Temperature Probe)
ties are found near horizontal crustal fields, which hinder energetic
aboard Pioneer Venus mission, the solar wind dynamic pressure were
electron precipitation into the atmosphere (Girazian et al. 2017).
considerably larger than average. It was shown that depleted and vari-
However, these effects are observed over the southern hemisphere,
able plasma densities throughout all or a major part of the nightside
where there are strong crustal fields. The variability of electron den-
Venusian ionosphere occurred during periods of large, coherent and
sity for the present event are mostly free from these effects, since
horizontal magnetic field events and associated with large solar wind
the observations shown here are for the inbound leg, which cover
dynamic pressures. It was suggested that because dayside ionopause
northern hemisphere.
is at low altitudes when the solar wind dynamic pressure is large
Figure 4a shows several LPW orbits during the event, compared to
and the IMF is strong, the nightside ionosphere supplied by the day-
the quiet time orbits. The quiet time orbit data are shown along with
to-night transport of plasma disappears. If the dayside ionosphere is
the mean and standard deviation (error bars). The third, fourth, fifth
severely reduced then it is expected that the supply of ions to the
and sixth orbits on 27 August 2018, and the first orbit on 28 August
nightside will be curtailed, and the large horizontal magnetic field
2018 show significant difference from the quiet time behavior. Above
will inhibit the downward diffusion. As a result of these, the night
200 km, the topside electron densities are completely depleted dur-
side ionosphere will be disappeared. The present observations show
ing these orbits. There are a few data points in the electron density
that the same is true for Martian ionosphere also. It may also be noted
profile around 300-350 km altitude region in the profile correspond-
that since this was a slow CME with bulk solar wind velocity near
ing to orbit 6 on 27 August 2018. However, these are points with
Mars ∼400 km s−1 , the outward flow could be weaker compared
very low density values. It is reported that the signal-to-noise ratios
to the CMEs with larger velocities. Even though the peak dynamic
are reduced below electron densities of ∼200 cm−3 (Fowler et al.
pressure was only ∼5 nPa, which is smaller compared to the strong
2015). Therefore, we do not infer any information from these isolated
CMEs like the March 2015 event (Jakosky et al. 2015; Thampi et al.
structures. At 150-200 km, we only show that the topside electron
2018), the slow velocities might have allowed more interaction time,
densities are completely depleted, compared to ‘quiet orbits’ during
and therefore the effectiveness might have increased. This is also due
the space weather event. These gradients are similar to the ionopause-
to the fact that the CME was actually within the compression region
like density gradient reported earlier (Vogt et al. 2015). Figure 4b
between the fast and slow solar wind.
shows the NGIMS observations of O+ 2 and O
+
ion concentrations
for the same period. It must be noted that NGIMS alternates between
ion and neutral modes, whereas LPW measures the electron density
in all orbits, and hence the signature is seen only in fewer orbits in
5 SUMMARY
NGIMS data. Similarly, the number of ‘quiet’ time profiles are also
fewer for the NGIMS observations, and hence the mean and the stan- The declining phase of solar cycle 24 had a slow stealth CME which
dard deviations are not given. However, the feature that the topside was responsible for an intense geomagnetic storm at Earth with
ion densities are highly depleted during the ICME period is unmis- Dstmin of -176 nT. The propagation of this CME beyond 1 au and
takably seen in the NGIMS observations as well. Figure 4c shows the the impact of this CME on Martian plasma environments are studied.
electron temperature observations from the LPW measurement dur- The observations show that the stealth CME has reached 1.5 au after
ing the event period, along with the quiet time profiles. The topside 7 days of its initial observations at the Sun, with a peak magnetic
electron temperatures are enhanced during all the orbits where elec- field of ∼10 nT . This CME caused depletion in the nightside topside
tron density showed depletion. However, it may be noted that reduced ionosphere of Mars. The topside ionosphere also had higher electron
MNRAS 000, 000–000 (2020)4 Smitha Thampi et al.
temperatures compared to the ‘quiet’ values. Even with a peak dy- Halekas J. S., et al., 2015, Space Science Reviews, 195, 125
namic pressure as low as 5 nPa, the CME had efficiently impacted the Halekas J. S., et al., 2017, Journal of Geophysical Research: Space Physics,
Martian ionosphere, because the CME was slow, and was bracketed 122, 547
between the fast and slow solar winds. This is an unique example to Jakosky B. M., et al., 2015, Science, 350
show how slow CMEs can affect the Martian ionosphere. As almost Kliem B., Török T., 2006, Phys. Rev. Lett., 96, 255002
Krishnaprasad C., Thampi S. V., Bhardwaj A., Lee C. O., Kumar K. K., Pant
one third of the CMEs occurring during the solar minimum period
T. K., 2020, The Astrophysical Journal, 902, 13
are of slow, stealth type (Ma et al. 2010), characterizing their impact Lee C. O., et al., 2017, Journal of Geophysical Research: Space Physics, 122,
on Martian ionosphere is important for constraining the ion escape 2768
rates. Lemen J. R., et al., 2012, Solar Physics, 275, 17
Liu Y. D., Hu H., Wang C., Luhmann J. G., Richardson J. D., Yang Z., Wang
R., 2016, The Astrophysical Journal Supplement Series, 222, 23
Lynch B. J., Masson S., Li Y., DeVore C. R., Luhmann J. G., Antiochos S. K.,
ACKNOWLEDGEMENTS
Fisher G. H., 2016, Journal of Geophysical Research: Space Physics, 121,
The work is supported by the Indian Space Research Organisation 10,677
(ISRO). We thank the staff of the ACE Science Center for pro- Ma S., Attrill G. D. R., Golub L., Lin J., 2010, The Astrophysical Journal,
viding the ACE data and OMNIWeb team for providing the IMF 722, 289
Mahaffy P. R., Benna M., et al 2014, Space Sci. Rev, 185
and solar wind data. We gratefully acknowledge the MAVEN team
Mays M. L., et al., 2015, Solar Physics, 290, 1775
for the data. We also acknowledge using solar observations from
Mishra S. K., Srivastava A. K., 2019, Solar Physics, 294
SDO/AIA. The WSA-ENLIL+Cone model simulations are used from Mishra S. K., Singh T., Kayshap P., Srivastava A. K., 2018, The Astrophysical
ENLIL Solar Wind Prediction. C. Krishnaprasad acknowledges the Journal, 856, 86
financial assistance provided by ISRO through a research fellow- Moore R. L., Sterling A. C., Hudson H. S., Lemen J. R., 2001, The Astro-
ship. This research has made use of SunPy v2.0, an open-source physical Journal, 552, 833
and free community-developed solar data analysis Python package Nitta N. V., Mulligan T., 2017, Solar Physics, 292
(https://sunpy.org/). O’Kane J., Green L., Long D. M., Reid H., 2019, The Astrophysical Journal,
882, 85
O’Kane J., Cormack C. M., Mandrini C. H., Démoulin P., Green L. M., Long
D. M., Valori G., 2020, The Magnetic Environment of a Stealth Coronal
DATA AVAILABILITY Mass Ejection (arXiv:2012.03757)
Odstrcil D., 2003, Advances in Space Research, 32, 497
The solar wind velocity and IMF at L1 point are obtained from
Pevtsov A. A., Panasenco O., Martin S. F., 2012, Solar Physics, 277, 185
the SPDF OMNIWeb data center (https://omniweb.gsfc.nasa. Piersanti M., et al., 2020, Annales Geophysicae, 38, 703
gov/).The MAVEN data used in this work are taken from the NASA Robbrecht E., Patsourakos S., Vourlidas A., 2009, The Astrophysical Journal,
Planetary Data System (https://pds.nasa.gov/). The solar ob- 701, 283
servations are available at SDO/AIA (https://sdo.gsfc.nasa. Srivastava A. K., et al., 2019, The Astrophysical Journal, 887, 137
gov/). The WSA-ENLIL+Cone model simulations are used from Thampi S. V., Krishnaprasad C., Bhardwaj A., Lee Y., Choudhary R. K., Pant
ENLIL Solar Wind Prediction (https://helioweather.net/). T. K., 2018, Journal of Geophysical Research: Space Physics, 123, 6917
Török T., Kliem B., 2004, in Walsh R. W., Ireland J., Danesy D., Fleck B.,
eds, ESA Special Publication Vol. 575, SOHO 15 Coronal Heating. p. 56
Tsurutani B., Gonzalez W., Zhou X.-Y., Lepping R., Bothmer V., 2004, Journal
REFERENCES of Atmospheric and Solar-Terrestrial Physics, 66, 147
Abunin A. A., Abunina M. A., Belov A. V., Chertok I. M., 2020, Solar Vogt M. F., et al., 2015, Geophysical Research Letters, 42, 8885
Physics, 295 Wyper P. F., Antiochos S. K., DeVore C. R., 2017, Nature, 544, 452
Acuña M. H., et al., 1999, Science, 284, 790 Zhang J., et al., 2007, Journal of Geophysical Research: Space Physics, 112
Adams M., Sterling A. C., Moore R. L., Gary G. A., 2014, The Astrophysical
Journal, 783, 11
Aly J., 1990, Computer Physics Communications, 59, 13
Amari T., Luciani J. F., Aly J. J., Mikic Z., Linker J., 2003, The Astrophysical
Journal, 585, 1073
Andersson L., et al., 2015, Space Science Reviews, 195, 173
Antiochos S. K., DeVore C. R., Klimchuk J. A., 1999, The Astrophysical
Journal, 510, 485
Astafyeva E., Bagiya M. S., Förster M., Nishitani N., 2020, Journal of Geo-
physical Research: Space Physics, 125, e2019JA027261
Brain D. A., Bagenal F., Ma Y.-J., Nilsson H., Stenberg Wieser G., 2016,
Journal of Geophysical Research: Planets, 121, 2364
Chen C., Liu Y. D., Wang R., Zhao X., Hu H., Zhu B., 2019, The Astrophysical
Journal, 884, 90
Connerney J. E. P., Espley J., Lawton P., Murphy S., Odom J., Oliversen R.,
Sheppard D., 2015, Space Science Reviews, 195, 257
Cravens T., et al., 1982, Icarus, 51, 271
Feynman J., Martin S. F., 1995, Journal of Geophysical Research: Space
Physics, 100, 3355
Forbes T. G., Isenberg P. A., 1991, ApJ, 373, 294
Fowler C. M., et al., 2015, Geophysical Research Letters, 42, 8854
Girazian Z., Mahaffy P. R., Lillis R. J., Benna M., Elrod M., Jakosky B. M.,
2017, Journal of Geophysical Research: Space Physics, 122, 4712
MNRAS 000, 000–000 (2020)Solar Longitude
AIA 211 A 2018-08-20 08:09:57 0° 15° 30°
Helioprojective Latitude (Solar-Y) [arcsec]
Helioprojective Latitude (Solar-Y) [arcsec]
1000"
(a) 400" (b) 30°
500"
Solar Latitude
300"
0"
-500" 200"
15°
-1000"
-1000" -500" 0" 500" 1000" -100" 0" 100" 200" 300" 400"
Helioprojective Longitude (Solar-X) [arcsec] Helioprojective Longitude (Solar-X) [arcsec]
Solar Longitude
AIA 211 A 2018-08-20 13:59:57 0° 15° 30°
Helioprojective Latitude (Solar-Y) [arcsec]
Helioprojective Latitude (Solar-Y) [arcsec]
1000"
(c) 400" (d) 30°
500"
Solar Latitude
300"
0"
-500" 200"
15°
-1000"
-1000" -500" 0" 500" 1000" -100" 0" 100" 200" 300" 400"
Helioprojective Longitude (Solar-X) [arcsec] Helioprojective Longitude (Solar-X) [arcsec]
Solar Longitude
AIA 211 A 2018-08-20 23:53:57 0° 15° 30°
Helioprojective Latitude (Solar-Y) [arcsec]
Helioprojective Latitude (Solar-Y) [arcsec]
1000"
Stealth CME at Mars
(e) 400" (f) 30°
500"
MNRAS 000, 000–000 (2020)
Solar Latitude
300"
0"
-500" 200"
15°
-1000"
5
-1000" -500" 0" 500" 1000" -100" 0" 100" 200" 300" 400"
Helioprojective Longitude (Solar-X) [arcsec] Helioprojective Longitude (Solar-X) [arcsec]
Figure 1. The SDO/AIA 211 Å full disc images (a, c, d) and the zoomed view (b, c, d) during different stages of the filament eruption that occurred on 20 August 2018.6 Smitha Thampi et al.
Figure 2. The WSA-ENLIL+Cone model inner heliospheric simulation snapshots showing the solar wind radial velocity (color contour) and IMF during stealth
CME event of August 2018. The relative positions of Earth and Mars are also shown.
Day/ UTC UTC Alt Alt Lon Lon Lat Lat SZA SZA LST LST
Orbit (hr) (hr) (km) (km) (deg) (deg) (deg) (deg) (deg) (deg) (hr) (hr)
INBOUND From To From To From To From To From To From To
27/Orbit 1 0.25 0.45 499.10 149.45 19.68 316.06 74.85 41.15 116.61 160.37 19.58 0.02
27/Orbit 2 4.67 4.87 496.45 150.69 84.17 20.91 74.82 41.31 116.66 160.24 19.59 23.99
27/Orbit 3 9.10 9.29 497.58 150.37 149.94 85.68 74.87 41.31 116.36 160.26 19.50 23.98
27/Orbit 4 13.52 13.71 498.14 150.14 215.40 150.50 74.92 41.51 116.13 160.09 19.44 23.96
27/Orbit 5 17.94 18.13 497.02 150.64 280.43 215.33 74.89 41.55 116.04 160.07 19.41 23.94
27/Orbit 6 22.36 22.55 497.73 149.97 346.11 280.18 74.95 41.79 115.75 159.85 19.33 23.91
28/Orbit 1 2.78 2.97 496.78 150.48 51.06 344.97 74.94 41.83 115.67 159.82 19.30 23.90
28/Orbit 2 7.20 7.39 499.24 151.24 116.86 49.87 74.97 42.12 115.36 159.53 19.22 23.87
28/Orbit 3 11.62 11.82 498.03 150.43 182.27 114.69 75.00 42.26 115.15 159.40 19.16 23.85
24/Orbit 1 1.51 1.71 498.63 148.72 54.51 358.80 74.24 38.79 119.58 161.72 20.44 0.35
24/Orbit 3 10.35 10.55 499.85 148.37 185.58 128.40 74.39 38.97 119.07 161.71 20.31 0.31
24/Orbit 4 14.78 14.97 499.64 149.36 250.48 193.31 74.37 39.25 119.02 161.53 20.28 0.28
24/Orbit 5 19.20 19.39 496.73 148.92 315.40 258.08 74.40 39.26 118.94 161.60 20.26 0.27
25/Orbit 1 4.04 4.24 497.45 149.76 85.92 27.73 74.47 39.54 118.61 161.47 20.16 0.23
25/Orbit 2 8.46 8.66 498.66 149.28 151.70 92.61 74.54 39.82 118.30 161.27 20.07 0.20
25/Orbit 3 12.88 13.08 496.55 149.33 216.44 157.34 74.56 39.80 118.26 161.34 20.06 0.19
25/Orbit 4 17.30 17.50 498.70 149.54 282.32 222.28 74.60 40.10 117.94 161.11 19.97 0.16
25/Orbit 5 21.73 21.92 498.35 148.81 347.69 287.08 74.67 40.26 117.73 161.01 19.91 0.14
26/Orbit 2 6.57 6.76 496.86 150.10 117.76 56.79 74.68 40.64 117.53 160.73 19.84 0.10
26/Orbit 4 15.41 15.60 496.48 150.32 248.17 186.42 74.73 40.87 117.22 160.59 19.75 0.06
26/Orbit 5 19.83 20.03 497.04 149.98 313.89 251.19 74.79 40.86 116.93 160.63 19.67 0.04
Table 1. Periapsis pass time in UTC (with day of August 2018 and orbit of the day), altitudes, longitudes, latitudes, SZA, and LST for disturbed orbits (27/28
August) and representative quiet orbits (24, 25, and 26 August) during the inbound legs of MAVEN [measurement below 500 km altitude].
MNRAS 000, 000–000 (2020)Stealth CME at Mars 7
10 (a)
B (nT)
0
10
B Bx By Bz Bz (Earth)
23 24 25 26 27 28 29 30
near Mars near Earth
600 (b)
SW speed (km/s)
500
400
23 24 25 26 27 28 29 30
30 near Mars near Earth
(c)
SW Density (cm 3)
20
10
0
23 24 25 26 27 28 29 30
SW Dyn. Pressure (nPa)
10.0 near Mars near Earth Sym-H (Earth) 0
7.5
(d)
Sym H (nT)
5.0 100
2.5
0.0 200
23 24 25 26 27 28 29 30
Day of August 2018
Figure 3. IMF (a), solar wind speed (b), solar wind density (c) and dynamic pressure (d) observations during 23-31 August 2018, near Earth and Mars. The
Sym-H variation, indicating the occurrence of an intense geomagnetic storm at Earth is also shown in (d).
MNRAS 000, 000–000 (2020)8 Smitha Thampi et al.
MAVEN-LPW
500
(a) 08/27 orb.3
450 08/27 orb.4
08/27 orb.5
400 08/27 orb.6
08/28 orb.1
Quiet
Altitude (km)
350
300
250
200
150
101 102 103 104 105
Electron Density (cm )
3
MAVEN-NGIMS
500
(b) Quiet (O+2)
450 Quiet (O+)
27/ orb. 2 (O+2)
400 27/ orb. 2 (O+)
27/ orb. 4 (O+2)
Altitude (km)
350 27/ orb. 4 (O+)
28/ orb. 1 (O+2)
300 28/ orb. 1 (O+)
250
200
150
10 1 100 101 102 103 104 105
Ion Density (cm )
3
MAVEN-LPW
500
08/27 orb.3 (c)
450 08/27 orb.4
08/27 orb.5
400 08/27 orb.6
08/28 orb.1
Quiet
Altitude (km)
350
300
250
200
150
102 103 104 105
Electron Temperature (K)
Figure 4. (a) The LPW observations during 27-28 August 2018, along with the typical quiet time variation. The 7 quiet orbits on 24, 25 and 26 August 2018,
are shown as blue dots. The mean of the quiet time profiles is shown (black line) along with standard deviation. (b) The NGIMS O+ (amu 16), and O+ 2 (amu
32) observations during 27-28 August 2018, along with the typical quiet time variation. The quiet time variations are from observations on 26 August 2018. (c)
The LPW Electron temperature estimates during 27-28 August 2018, along with the quiet time variation. Both LPW and NGIMS observations are during the
the inbound phase of the MAVEN spacecraft.
MNRAS 000, 000–000 (2020)You can also read


