THE IMPACT OF COVID-19 ON FREIGHT & LOGISTICS - A PRESENTATION TO: SOUTH AFRICAN TRANSPORT CONFERENCE WEBINAR PORTIA DERBY - GROUP CHIEF EXECUTIVE ...

Page created by Evelyn Mccormick
 
CONTINUE READING
THE IMPACT OF COVID-19 ON FREIGHT & LOGISTICS - A PRESENTATION TO: SOUTH AFRICAN TRANSPORT CONFERENCE WEBINAR PORTIA DERBY - GROUP CHIEF EXECUTIVE ...
THE IMPACT OF COVID-19 ON FREIGHT &
LOGISTICS
A PRESENTATION TO:

SOUTH AFRICAN TRANSPORT CONFERENCE WEBINAR
PORTIA DERBY – GROUP CHIEF EXECUTIVE
12 AUGUST 2020
THE IMPACT OF COVID-19 ON FREIGHT & LOGISTICS - A PRESENTATION TO: SOUTH AFRICAN TRANSPORT CONFERENCE WEBINAR PORTIA DERBY - GROUP CHIEF EXECUTIVE ...
CONTENTS
1.TRANSNET SOC LTD OVERVIEW
• WHO ARE WE
• OPERATIONAL FOCUS AREAS
• FINANCIAL STATISTICS
2. ECONOMIC OVERVIEW
• SHIFT IN GLOBAL TRADE PATTERNS
• COMMODITY PRICES
• MUTED DOMESTIC GROWTH
3. TRANSNET COVID19 JOURNEY
• INITATIVES
• CASE STUDIES: TPT
4. CONCLUSION
THE IMPACT OF COVID-19 ON FREIGHT & LOGISTICS - A PRESENTATION TO: SOUTH AFRICAN TRANSPORT CONFERENCE WEBINAR PORTIA DERBY - GROUP CHIEF EXECUTIVE ...
TRANSNET SOC LTD OVERVIEW
THE IMPACT OF COVID-19 ON FREIGHT & LOGISTICS - A PRESENTATION TO: SOUTH AFRICAN TRANSPORT CONFERENCE WEBINAR PORTIA DERBY - GROUP CHIEF EXECUTIVE ...
WHO ARE WE
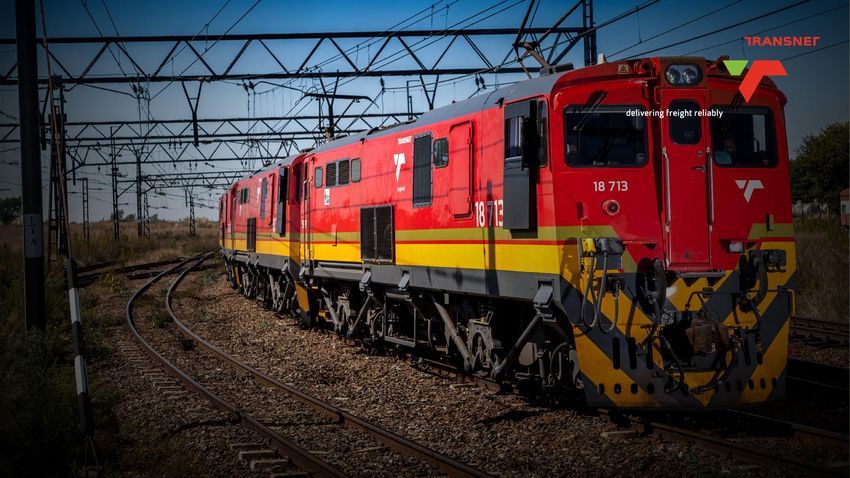
       Transnet SOC Ltd is a custodian of rail, ports and pipelines

Transnet Freight                  Transnet              Transnet National      Transnet Port           Transnet Pipelines       Transnet Property
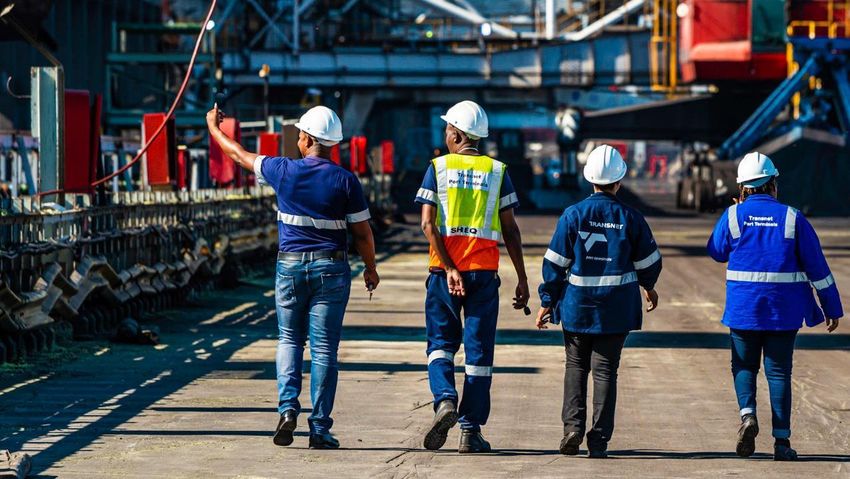
Rail                              Engineering           Ports Authority        Terminals               • Transports 100%        • Manages 13% of
• 30 400 km of                    • Support TFR for     • 8 Commercial         • 16 Cargo Terminals      of South Africa’s        Transnet’s total
  railway track (80%                rolling stock and     ports along 2 798      (68 berths)             bulk pertroleum          property portfolio of
  of Africa’s total                 TPT for lifting       km of coastline        operating across 7      products                 commercial and
  rail)                             equipment           • Plan, provide,         ports                 • 18 billion litres of     residential properties
• 1,500km dedicated                 maintenance           maintain and         • Containers, mineral     petroleum products     • One of South Africa’s
  heavy haul                      • Eight product-        improve port           bulk and                and gas through 3        most significant
• Operates 1200                     focused business,     infrastructure         agricultural bulk       800 km of                property owners.
  trains per day                    143 depots, six     • Providing marine-      and Ro-Ro (roll         pipelines.             • Provides specialised
                                    factories.            related services,      on/roll off)                                     property services
                                                          including                                                               including valuations,
                                                          dredging, aids to                                                       municipal valuation
                                                          navigation, ship                                                        roll analysis, land
                                                          repairs and marine                                                      surveys, drawing of
                                                          operations                                                              plans and deeds
             4                                                                                                                    management.
Source: Transnet Internal, 2020
TRANSNET KEY PILLARS
OPERATIONAL FOCUS AREAS

                                   02         03          04          05

                                  People     Asset       Safety   Cost Control
                                           Utilisation

                1                  2          3           4           5

   5

Source: Transnet Internal, 2020
TRANSNET SOC LTD FINANCIAL STATISTICS
2019 REPORTING PERIOD
Revenue R75bn                                     Operating cost R40bn        EBITDA R35bn                                Employees 55,000

                       Transnet revenue contribution by Operating            Net operating expenses contribution by cost
                                      Division (%)                                          element (%)

                                             6%
                                                                                        16%
                               16%

                                                                                8%

                                                              51%                                                57%
                                                                               8%
                           15%

                                                                                   11%
                                      12%

                             TFR        TE    TNPA      TPT   TPL                Personnel costs     Material and maintenance
                                                                                 Electricity costs   Other operating expenses
                                                                                 Fuel costs

 6                         Annual Financial Statements for year ended March 2020 due for release in August 2020
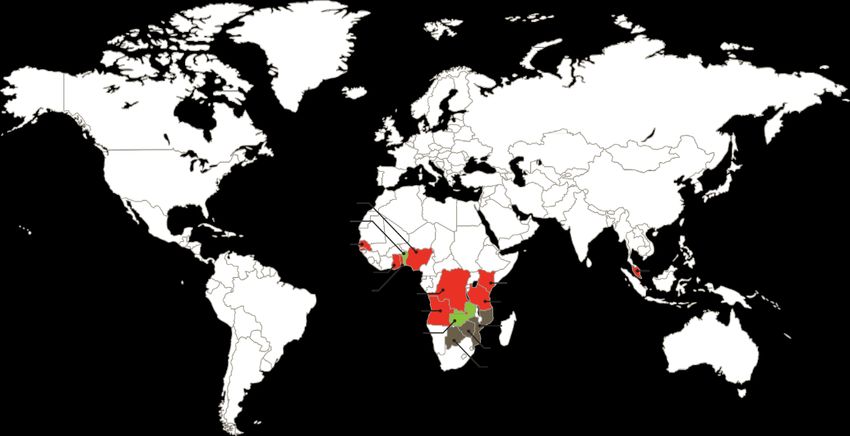
 Source: Transnet Integrated Report, 2019
TRANSNET INVESTMENTS ON THE CONTINENT MUST BE
ALIGNED WITH TARGETS TO INCREASE INTER-REGIONAL TRADE

                                       Nigeria
                                       Benin

                                      Senegal

                                           Ghana
                                                             Kenya
                                           Togo
                                                    DRC
                                                             Tanzania
GEOGRAPHICAL LOCATION                              Angola
                                                             Mozambique
                                                   Zambia

            Where we operate                                Zimbabwe
                                                            Botswana
            Potential projects

            Joint Operations Center
        7

Source: Transnet Internal, 2020
ECONOMIC OVERVIEW
THE GREAT LOCKDOWN: AN ECONOMIC ANOMALY
  Figure 1: Real GDP, annual percent change, 2020 -2021                                                       Figure 2: Low global growth as a result of COVID-19 pandemic,2020
          Real annual % change                       2019
                                                     Actual
                                                                       2020
                                                                      Forecast
                                                                                         2021
                                                                                        Forecast             US: Nearly 30 million                        ASIA: Reduced working hours will
                                                                                                                                                          negatively impact the economy. Economic
 World output                                          2.9              -4.9               5.4                jobs are expected to be                     output relies on the demand of raw
                                                                                                             lost. Economists estimate                    material and intermediate goods. This
 Advanced economies                                    1.7              -8.0               4.8              that 30% of the population                    growth is expected to remain significantly
                                                                                                             will be unemployed in the                    muted in the long-term.
 United States                                         2.3               -8.0              4.5
                                                                                                                     long-term.
 Euro Area                                             1.2              -10.2              6.0
 Japan                                                 0.7               -5.8              2.4
 United Kingdom                                        1.4              -10.2              6.3
 Emerging and developing economies                     3.7              -3.0               5.9
 China                                                 6.1               1.0               8.2
 India                                                 4.2               -4.5              6.0
 Russia                                                1.3               -6.6              4.1
 Brazil                                                1.1               -9.1              3.6
 South Africa                                          0.2               -8.0              3.5

                                                                                                               TRADE
 World trade volumes                                   0.9             -11.9               8.0
 - Advanced economies                                  1.5              -13.4              7.2
                                                                                                              VOLUMES:
                                                                                                            expected to decline by -
 - Emerging and developing economies                   0.1               -9.4              9.4                  11.9% in 2020

   9 Sources: International Monetary Fund: World Economic Outlook, 2020; US Bureau of Labour Statistics, 2020; International Labour Organisation, 2020.
COMMODITY PRICES HAVE BEEN NEGATIVELY AFFECTED

Figure 3: Commodity prices have been negatively affected, 2020

           200

           150

           100

            50

              0

                  1/19   2/19         3/19   4/19      5/19    6/19    7/19    8/19   9/19   10/19 11/19 12/19 1/20         2/20   3/20    4/20   5/20   6/20

                                                    Crude oil, Brent ($/bbl)    Coal, South African ($/mt)   Maize ($/mt)

 10 Source: Transnet internal, 2020
                                                    Coal, Australian ($/mt)     Natural gas index            Iron ore, CFR spot ($/dmtu)
PRE-COVID19 SA’S ECONOMY WAS DECLINING. THIS WILL BE
FURTHER EXACERBATED BY THE CURRENT ECONOMIC SLOWDOWN
The country was expected to grow by 0,9% for 2020. Due to the impact of COVID-19 virus this figure has
been revised and is expected to contract by 9,5% in 2020.
                                                                                                                        Real GDP
  Figure 4: SA GDP growth, 2020

              2,5                                                                              3,1
                             1,8
                                            1,2                    1,4                                1,4                -2,0%
                                                                          0,8
                                                           0,4                   0,2

                                                                                                                     In Q1: 2020
                                                                                                                 (quarter-on-quarter)
                                                                                                             Seasonally adjusted and annualised

                                                                                                                        Real GDP

                                                                                                                         -0,1%

                                                                                        -9,5
                                                                                                                       In Q1: 2020
                                                                                                                      (year-on-year)
            2013            2014           2015           2016     2017   2018   2019   2020   2021   2022               Unadjusted

  11 Sources: Bureau for Economic Research; 2020, StatsSA; 2020.
TRANSNET COVID19 JOURNEY
THE TRANSNET COVID-19 JOURNEY
                                                                                                                                              Creating the “New Normal”
EXTERNAL RISK TRIGGERS

                                                                                                                                              • Lessons have been learned                    Transnet insights
                                                  15 Mar 2020
                                                  RSA declares State                                                                          • Strengths & weakness are visible
                                                                                                                                              • Latent vulnerabilities are exposed
                                                  of Disaster
                                                                                                                                              • New ways of working have evolved
                                                                    23 Mar 2020                                          30 April 2020        • How do we re-imagine our new world
                                                                    RSA National Lockdown                             National Lockdown
                                                                    effective 26 March 2020                                                Level 3               Level 2         Level 1        Creating a
                                                                                                Introduced an extreme       Level 4
                                                                                                                                                                                              future resilient
                                                                                               change from business as                                                                           Transnet
                                       11 Mar 2020                                                      usual!
                                       WHO declares
                                       Global Pandemic                                Immediate Impact Horizon                                  Tactical Horizon                      Strategic Horizon
                                                                                              Brace Period                                Embedding the “New Normal”                       Optimisation &
                          C19
                                                                                                                                                                                             Durability

                         BCM Risk                                   24 Mar 2020
                         assessment                                 Transnet COVID-19 response escalated.
TRANSNET RISK REPONSE

                                                                    COVID-19 COMMAND CENTRE (CCC) established to:

                         Jan 2020                      • Create a structure to centralise and
                         COVID Task Team                 coordinate Transnet’s response
                         established & war room set up • Direct and integrate initiatives, budgets
                                                                      and supplement execution capacity
                         Initial focus on                           • Enable rapid decision-making within
                         communication, education,                    governance frameworks
                         risk assessments and                       • Create delivery accountability for all
                         readiness plans                              aspects related to Employee and
                                                                      Operational Health
                             13
                                                                    • Create an integrated reporting framework

                                  Source: Transnet internal, 2020
COVID-19 RISK MITIGATION AND READINESS:
CASE STUDY – IMPACT DELAYS IN CAPE TOWN
Transnet Port Terminals operates a complimentary port system as a value proposition for shipping lines, planning the visits of multi-port
calls as part of an integrated berthing window system as per the CTOC agreements. A typical liner service is used as an example below
to illustrate multi-port calls.

                                                                                                                                     Additional
                                                                                                                                     Transships

     6

                                                                                  Reefers
                                                                                  left behind

                                        1       2   3

                                    5
                                            4

          1   Vessel arrives from Europe and discharges   Delayed at CTCT but continues to NCT & DCT         Delayed again at CTCT on return leg
          2   Vessel sails to NCT and discharges          Vessel bypasses NCT & CTCT on return leg leaving   Vessel forced to speed on return journey to catch
                                                                                                             up delays @ fuel cost of $750/ton x 150 ton/day
          3   Vessel sails to DCT: discharges and loads   Export boxes to make slot @ European Terminals
                                                                                                             Vessel could still miss slots @ European ports
          4   Vessel returns to NCT to loads                                                                 thereby resulting in boxes having to be
                                                                                                             transshipped with feeder vessels @ cost of $40k
         5    Vessel returns to CTCT to load
                                                                                                             per day plus fuel
14
          6   Vessel departs for Europe
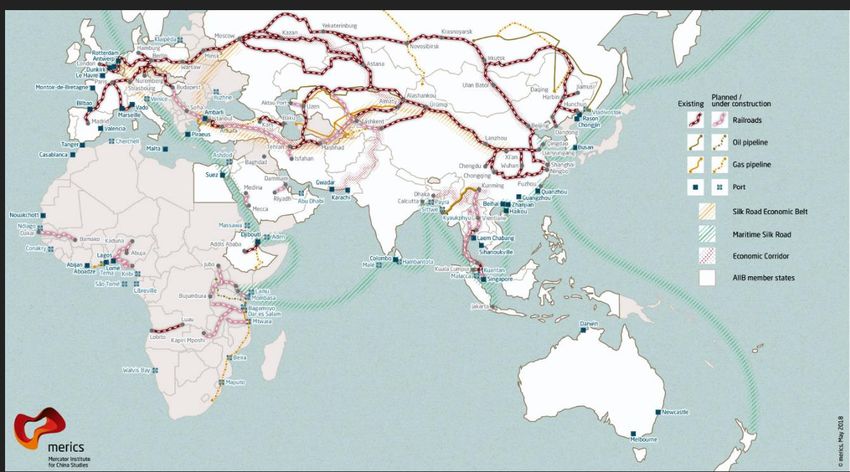
  Source: Transnet internal, 2020
THE RACE FOR NEW ROUTES FOR ECONOMIC ZONES, HUBS AND
“SINGLE STOPS” IS ON AND THE SOUTH NEEDS TO RESPOND.

   15

Source: Transnet internal, 2020
LOOKING AHEAD
Economy
   The African continent looks set to suffer its largest ever recession in 2020 but like much of the world.
   The rebound will be modest across the world, and most countries will emerge from the crisis with heavy baggage in the form of large
    budget deficits, weak currencies and worryingly large stocks of debt.
   The recovery across Africa in 2021 will be tempered by the lingering effects of the still-subdued commodity prices and volatility in
    financial markets.
   UNCTAD expects the pandemic to reduce global Foreign Direct Investment (FDI) flows by about 40% in 2020-21, a slightly deeper
    contraction than the 35% recorded during the global financial crisis in 2008-09.
   South Africa will be burdened by tight credit markets, low levels of private investment, high unemployment and growing levels of
    poverty - if we do nothing.
   The challenge for SA – how to change the risk/reward perception
Supply Chains
 As focus is shifted from short-term damage control to longer-term
   resilience, supply chains are likely to move in new and more
   geographically dispersed directions.
 The following trends are anticipated in response to the pandemic:
    o Homeward bound               – Some reshoring and stockpiling.
    o Regionalisation – Offering nearshoring opportunities.
    o Globalisation – A mixed approach by diversifying supply chains away
      from a single country to a region.
    16   Source: The Economist Intelligence Unit, 2020
THANK YOU,
 NGIYABONGA
Transnet SOC Ltd
9 Country Estate Drive
Waterfall Business Estate
Midrand, 1662
+ 27 (11) 308 2313
Portia.Derby@Transnet.net
17
You can also read