The Influence of Climate and Public Health Interventions on Aedes Vectors and Dengue in Sri Lanka - Chaminda Prasad Gigummaduwa Liyanage
←
→
Page content transcription
If your browser does not render page correctly, please read the page content below

The Influence of Climate and
Public Health Interventions on
 Aedes Vectors and Dengue in
 Sri Lanka

 Chaminda Prasad Gigummaduwa Liyanage

 Department of Epidemiology and Global Health
 Umeå 2022
This work is protected by the Swedish Copyright Legislation (Act 1960:729)
Dissertation for PhD
ISBN: 978-91-7855-734-9 (print)
ISBN: 978-91-7855-735-6 (pdf)
ISSN: 0346-6612
New Series Number 2170
Information about cover design / cover photo / composition
Electronic version available at: http://umu.diva-portal.org/
Printed by:CityPrint i Norr AB
Umeå, Sweden 2022
I dedicate this work to the public health staff of Sri Lanka
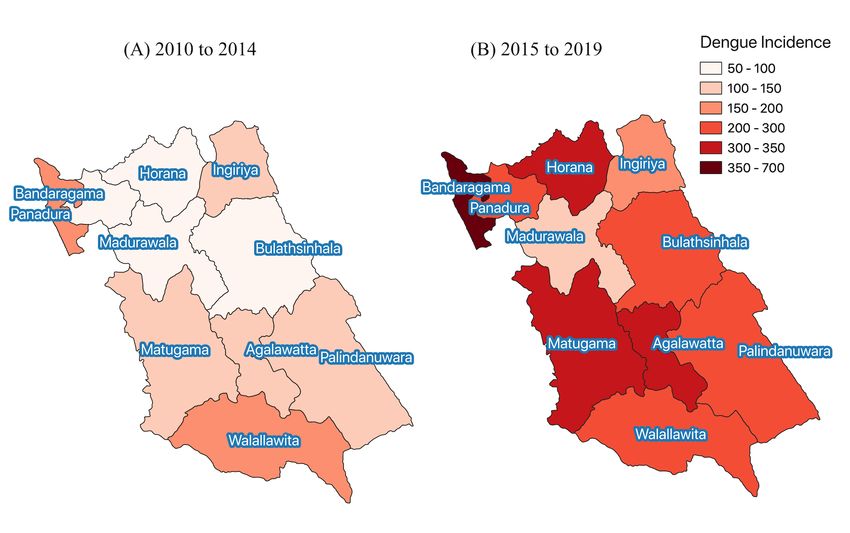
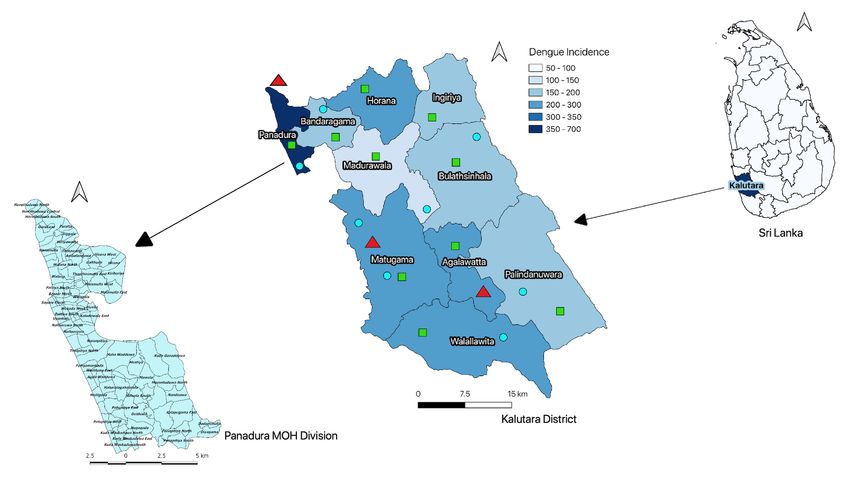
Table of Contents

Abstract ............................................................................................................................................................... 3
Abbreviations....................................................................................................................................................... 4
Contributing Papers............................................................................................................................................. 6

Introduction ........................................................................................................................................................ 7
 The disease ...................................................................................................................................................... 7

 Global and regional burden of dengue ............................................................................................................. 8
 Dengue in Sri Lanka ....................................................................................................................................... 8
 Health system in Sri Lanka .............................................................................................................................. 9
 Public health policies for control and prevention of dengue in Sri Lanka ........................................................ 9

 Economic burden of dengue and dengue control interventions in Sri Lanka .................................................. 10
 Aedes vector indices ....................................................................................................................................... 10

 Influence of climate variability and weather on Aedes vectors and dengue transmission ................................ 11
 Influence of human mobility on dengue ........................................................................................................ 12
Aims and Objectives ........................................................................................................................................... 14
Materials and methods ....................................................................................................................................... 15

 Overview........................................................................................................................................................ 15
 Study setting .................................................................................................................................................. 15

 Data collection............................................................................................................................................... 17
 Dengue surveillance data .................................................................................................................................. 17
 Climate data ...................................................................................................................................................... 17
 Vector surveillance data .................................................................................................................................... 17
 Cost data ............................................................................................................................................................ 18
 MOH division-specific characteristics............................................................................................................... 18

 Statistical Methods ........................................................................................................................................ 18
 Estimation of exposure-lag-response associations ............................................................................................ 19
 First stage division specific analysis ................................................................................................................. 19
 The second stage multivariate meta-analysis .................................................................................................... 22
 Generalized additive models .............................................................................................................................. 23
 Evaluating the utility of vector indices to predict dengue incidence.................................................................. 23
 Interrupted time series analysis ......................................................................................................................... 24
 Evaluation of the impact of mobility restriction on dengue ............................................................................... 25
 Evaluation of the impact of CIMIC intervention on BI and dengue incidence .................................................. 26
 Decision analytical modeling framework for economic evaluation of public health interventions ................... 27
 Health economic evaluation of CIMIC intervention, Panadura MOH division................................................. 28
 Ethical considerations ................................................................................................................................... 29

 1

Results ............................................................................................................................................................... 30
 Seasonality and trends of exposure and response variables from 2009 to 2020 in Kalutara district................. 30

 Distribution of vector breeding sites ............................................................................................................... 34
 Exposure-lag-response association ................................................................................................................ 35

 Influence of El Niño events ........................................................................................................................... 37
 Influence of rainfall and temperature on Aedes vector indices ....................................................................... 38

 Influence of rainfall and temperature on dengue incidence ........................................................................... 39
 Influence of Aedes larval indices on dengue .................................................................................................. 40

 Heterogeneity of exposure-lag-response associations ..................................................................................... 41
 Effect of the division-specific variables on the vector-dengue relationship ..................................................... 43

 Evaluation of the capacity to predict dengue outbreaks using vector indices .................................................. 44
 Influence of human mobility on dengue transmission .................................................................................... 45

 Effectiveness and cost-effectiveness of CIMIC vector control interventions at MOH division Panadura ........ 50
 Impact on the Breteau Index .............................................................................................................................. 50
 Impact on dengue incidence .............................................................................................................................. 51
 The costs and cost-effectiveness of the CIMIC program in the Panadura MOH division ................................ 51
Discussion ......................................................................................................................................................... 54
 Association between meteorological variables and dengue ............................................................................. 55
 Aedes vector surveillance information and relationship between weather and larval indices .......................... 56
 Aedes vector indices and the risk of dengue transmission............................................................................... 57

 Influence of the human mobility on dengue transmission .............................................................................. 58
 Impact of vector control intervention on dengue transmission ....................................................................... 59
 Unprecedented dengue epidemic in 2017 ....................................................................................................... 60
 Limitations of the study ................................................................................................................................. 61

 Implications of our findings on local and global Aedes vector control policies ............................................... 61
Conclusion ........................................................................................................................................................ 65
Acknowledgments .............................................................................................................................................. 66
References ......................................................................................................................................................... 68

 2

Abstract

Introduction: Dengue, a viral infection transmitted by Aedes mosquitos, flourishes in urban
tropical environments by a complex process. Interactions among susceptible humans, dengue
viruses, and Aedes mosquitoes determine dengue transmission patterns, and these interactions are
modified by driving factors related to weather, the environment, and human behaviour, including
mobility. Understanding the drivers of dengue and evaluating the effectiveness and cost-
effectiveness of existing vector control policies are vital to developing evidence-based and timely
interventions.
Methods: The exposure-lag-response associations between weather variables, Aedes vector
indices and dengue at each sub-district Medical Officer of Health (MOH) divisions in Kalutara
district, Sri Lanka, were estimated using distributed lag non-linear models. These estimates were
meta-analyzed to obtain the average estimates for the district, while exploring the heterogeneities
among MOH divisions. Non-linear extension to the interrupted time series analysis was used to
evaluate the impact of nationwide mobility restrictions implemented during COVID-19 pandemic
on dengue risk at each district, at different age groups in the western province and at the climate
zones in Sir Lanka. The effects of the vector control interventions implemented through the civil-
military cooporation (CIMIC) on dengue were estimated at Panadura MOH division of Kalutara
district using interrupted time series analysis while adjusting for potential confounders. The cost-
effectiveness of the CIMIC intervention was evaluated using a decision analytical modelling
framework.
Results: We found that El Niño, rainfall, temperature and Aedes larval indices were associated
with each other, and dengue, at lag intervals expanding from one to six months. The nationwide
mobility restriction was associated with a statistically significant reduction in dengue risk in all
climate zones in Sri Lanka. The highest impact was observed among the children age less than 19
years. We found that the CIMIC intervention reduced dengue risk by 50% and was cost-effective
in a defined area.
Conclusion: The manifestation of dengue is preceded by the biologically plausible latencies of
increasing Aedes larvae and the onset of weather events in Kalutara district. When augmented with
location-specific information of vector activities, one to six months lead time from the onset of
weather events enables public health authorities to set up short, intermediate, and long-term goals
for vector control interventions. The observed significant reduction in dengue risk following the
national lockdown in Sri Lanka further highlighted the importance of vector control at public
places and schools. The findings of these studies suggest that communities affected by dengue can
benefit from investments in vector control if interventions are implemented rigorously and
coordinated well across sectors. The methodological framework we developed in this doctoral
thesis will contribute to the understanding of the local determinants of dengue and the development
of early warning systems blend ed with effective and cost-effective vector control interventions in
Sri Lanka and beyond.

 3

Keywords: Dengue, weather, climate, El Niño, Aedes vector indices, human mobility, vector
control, cost-effectiveness analysis, Sri Lanka, Kalutara.

 Abbreviations

AIC Akaike Information Criteria
AUC Area under the curve

BI Breteau Index
CET Cost-effectiveness threshold
CI Container Index
CIMIC Civil-Military Cooperation
DALYs Disability-adjusted life-years
DenSys Dengue Sentinel Surveillance System

DENV Dengue Virus
DF Dengue Fever
DHF dengue haemorrhagic fever
DLNM Distributed lag non-linear models
DSS Dengue shock syndrome
ENSO El Niño Southern Oscillation

FIM First inter-monsoon
GAM Generalized additive models
HEO Health Entomology Officers
ICER Incremental cost effectiveness ratio
ITS Interrupted Time Series
LKR Sri Lankan Rupees

MOH Medical Officer of Health
NDCU National Dengue Control Unit

 4
NEM Northeast monsoon
ONI Oceanic Niño Index
PI Premise Index
PSA Probabilistic sensitivity analysis

PTFD The Presidential Task Force on Dengue
q-AIC quasi-Akaike Information Criteria
QALYs Quality-adjusted life years
ROC Receiver operating characteristic curves
SARS-COV-2 Severe Acute Respiratory Syndrome Corona Virus 2
SIM Second inter-monsoon

SWM Southwest monsoon
US$ United States Dollars
WHO World Health Organization

 5
Contributing Papers
 1. A Spatial Hierarchical Analysis of the Temporal Influences of the El Niño-Southern
 Oscillation and Weather on Dengue in Kalutara District, Sri Lanka. Authors:Prasad
 Liyanage, Hasitha Tissera, Maquins Sewe, Mikkel Quam,Ananda Amarasinghe, Paba
 Palihawadana,Annelies Wilder-Smith,Valérie R. Louis,Yesim Tozan and Joacim Rocklöv.
 Journal: International Journal of Environmental Research and Public Health.2016, 13(11),
 1087; https://doi.org/10.3390/ijerph13111087
 2. Hierarchical analysis of El–Niño Southern Oscillation and local weather on Aedes vector
 activity from 2010 to 2018 in Kalutara district, Sri Lanka. Authors: Prasad Liyanage,
 Joacim Rocklöv, Yesim Tozan, Hasitha Tissera, Paba Palihawadana, Hans J. Overgaard.
 Lancet Planetary Health (under review).
 3. Associations between Aedes larval indices and dengue incidence: a hierarchical time series
 analysis from 2010 to 2019 in Kalutara district, Sri Lanka. Prasad Liyanage, Yesim Tozan,
 Hasitha Tissera, Joacim Rocklöv. Journal of Parasites and Vectors (submitted).
 4. The impact of COVID–19 lockdown on dengue transmission in Sri Lanka; a natural
 experiment for understanding the influence of human mobility. Authors: Prasad Liyanage,
 Joacim Rocklöv, Hasitha Tissera. Journal: PLOS Neglected Tropicla Disease. 2021;15:
 e0009420. doi:10.1371/journal.pntd.0009420
 5. Evaluation of intensified dengue control measures with interrupted time series analysis in
 the Panadura Medical Officer of Health division in Sri Lanka: a case study and cost-
 effectiveness analysis. Authors: Prasad Liyanage, Joacim Rocklöv, Hasitha Tissera, Paba
 Palihawadana, Annelies Wilder-Smith, Yesim Tozan. Journal: The Lancet Planetary
 Health. 2019 May, Volume 3, Issue 5, pages 211-218; https://doi.org/ 10.1016/S2542-
 5196(19)30057-9

 6
Introduction

Dengue is an important, rapidly spreading, mosquito-borne viral infection endemic in more than
120 tropical and subtropical countries in Asia, Africa, America, and Oceania [1]. Nearly 40% of
the world population are currently at risk of dengue [2]. The global health burden due to dengue
was estimated to be 58·4 million symptomatic cases, resulting in an estimated global cost of $8·9
billion (95% uncertainty interval 3·7–19·7) [3]. Dengue is also spreading to previously uninfected
areas, as exemplified by the recent outbreak in Madeira, Europe [4]. Dengue is caused by four
serotypes of dengue viruses (DENV 1-4) of the genus Flaviviridae [5,6]. The dengue virus is
transmitted by two subgenera of Stegomya mosquitoes, namely, Aedes aegypti (Linnaeus) and
Aedes albopictus (Skuse) [2]. Susceptible humans, dengue virus and Aedes mosquitos make up the
cornerstones of the transmission cycle of dengue. The transmission dynamics are further
influenced by the environment, human behaviour, and globalisation [7]. Weather factors, mainly
rainfall and temperature, are associated with vector ecology by influencing aquatic breeding sites,
longevity, feeding habits, and opportunities [8,9]. Population size and distribution, community
infrastructure and human mobility, determine the nature of human vector contact [10,11].
Epidemics or endemicity setpoints and the disease severity are governed by individual virologic
and immunological factors interacting with circulating viral serotypes and their previous exposures
[12]. These interactions are further modified by the existing vector control policies, public
awareness, and the community response to public health vector control intervention. Heterogeneity
in the distribution of all those factors and their complex interactions in time and space determines
the area-specific dengue endemicity and epidemics.

The disease
Clinical signs and symptoms of dengue illness varies greatly from person to person [2,5]. The
illness can be asymptomatic or may lead to undifferentiated fever known as dengue fever (DF) or
dengue haemorrhagic fever (DHF) with plasma leakage that may eventually lead to hypovolemic
shock known as dengue shock syndrome (DSS) [13,14]. A wide variation of mortality is observed
globally, varying from 1 to 26% with this spectrum of clinical picture [2]. Usually, DF is a self-
limiting disease without sequelae. Dengue haemorrhagic fever is a more severe form having three
phases. A febrile phase, critical phase, and recovery phase. The hallmark of the critical phase is
plasma leakage. Subsequently, the condition can be worsened by massive internal haemorrhages.
If this critical phase is not adequately managed with meticulous fluid therapy, the patient can enter
hypovolemic shock (DSS) and succumb to death [15,16]. The recovery phase has swift progress
back to normal health, except fatigue which might rarely continue for days to weeks. It was found
that, upon recovery, the patients can develop long-term immunity to the serotype that is already
infected and recurrent infections with heterotrophic DENV may result in more severe disease [15].
At present, there is no effective anti-viral therapy or population wide applicable vaccines available

 7
for treating and preventing dengue [17].

Global and regional burden of dengue
In the 18th and 19th centuries, Dengue outbreaks were observed mainly in non-endogenous settlers
or visitors in Africa, the Indian subcontinent and Southeast Asia [18,19]. With the commencement
of international travel and trade, it has spread to the American tropics. The disease pattern
associated with dengue-like illness was experienced from 1780 to 1940 relatively infrequent as
large epidemics in these tropical and sub-tropical countries [2]. The first recognised dengue
epidemic occurred almost simultaneously in Asia, Africa, and North America in the 1780s, shortly
after identifying and naming the disease in 1779 [5]. However, dengue viruses likely became
endemic in many tropical urban areas with time due to the increasing population migration [20].
During World War II, the dengue virus was observed to be common among Pacific combatants,
spreading to Japan, Hawaii and Polynesia [19]. A pandemic began in Southeast Asia in the 1950s,
and by 1975 DHF had become a leading cause of death among children in the region [6]. Epidemic
dengue has become more common since the 1980s. By the late 1990s, dengue was the most
important mosquito-borne disease affecting humans after malaria, with around 40 million cases of
dengue fever and several hundred thousand cases of dengue haemorrhagic fever each year [21].
The most recent estimates of the Global Burden of Disease study 2017 showed that the Southeast
Asian region is still highly affected having the highest age standardized incidence rate for dengue
compared to other regions in the world [1]. Significant outbreaks of dengue fever tend to occur
every five or six years. The cyclical rise and fall in numbers of dengue cases are thought to be the
result of heard immunity, El Niño Oscillations, climate change, viral evolution and introduction of
new serotypes [1,20,22].

Dengue in Sri Lanka
Sri Lanka is an island situated in the centre of the Indian Ocean within the tropical zone between
5°55′ and 9°51′ North latitude and between 79°42′ and 81°53′ East longitude. It comprises a 65,610
square km land area populated with 21 million people, and has an average population density of
320 per square km. The country is divided into nine administrative provinces and 25 districts.
Colombo (the capital), Kalutara and Gampaha districts are in the Western Province where nearly
25% of the total population is inhabited with a population density of 1580 per Sq. km [23]. While
morbidity and mortality from communicable disease including malaria and filariasis are eliminated
from Sri Lanka in 2015 and 2016 respectively, dengue is increasingly becoming an important
public health problem [24,25]. Clinical dengue like illness reported has been reported in the
country since the beginning of 20th century, and it was serologically confirmed only in 1962 [26].
From 1969 to 1988, multiple dengue serotypes circulated in urban areas with DF and it has been
shown that the emergence of more severe DHF outbreaks were not experienced until 1989 [26,27].
The incidence of dengue increased 20-fold form the year 2000 to 2012 and a further 3-fold from
2012 to 2019. From 2009 to 2020, increasing number of dengue cases were detected form all the
administrative districts. However, the epidemic disproportionately affected the three districts
(Colombo, Gampaha and Kalutara) belonging to the most populous western province of the

 8
country [25]. All four serotypes of DENV have been co-circulating in Sir Lanka for the last three
decades, with different serotypes being primarily responsible for outbreaks in different periods
[26,28]. The serotype 1 of the DENV was responsible for the epidemic reported in 2009, setting
a higher endemicity level [29]. From 2009 the number of dengue cases increased steadily following
an inter-annual cyclical pattern. In 2017, Sri Lanka experienced an unprecedented dengue
epidemic with the highest number of cases reported in history driving the endemicity to an even
higher setpoint [28,30]. This trend continued through 2019 until early 2020, after which there was
a reduction of dengue cases concomitant to the island wide mobility restriction imposed as a
COVID-19 prevention policy. The case fatality rate at the initial phases of the evolution of dengue
epidemics in Sri Lanka was as high as 9.9 in the year 1989 and it gradually declined towards 1%
in 2009 and further reduced to levels less than 0.3% from 2015 onwards.

Health system in Sri Lanka
In Sri Lanka, health care is provided by both the government and private sectors. The government
sector provides approximately 95% of inpatient and 50% of outpatient care. The private sector
provides the remaining 50% of outpatient care. It was estimated that the general practitioners in
Sri Lanka would handle at least 25% of primary care consultations per year [31]. Private sector
contribution to the provision of inpatient care is limited and is largely concentrated in urban and
suburban areas. The community health services are provided by the government sector focused on
preventing illness and health promotion at the population level [32]. The Director General of
Health Services heads the Department of Health and is supported by the Deputy Director Generals,
each in charge of a particular programme area. They have, under their jurisdiction, several directors
responsible for different programmes and organizations. The Central Epidemiological Unit and
the National Dengue Control Unit (NDCU) are two such organizations handling disease
surveillance, epidemiological investigation, and research and training in epidemiology and
providing Aedes vector control services. Sri Lanka is administratively divided into nine provinces.
With the devolution of powers in 1989, the provincial health services were made responsible for
managing and implementing health services in the respective provinces. Provinces are further
divided into districts. Each district’s community health services are operated by the Regional
Directorate of Health Services under the provincial health authority. The district is administratively
further divided into Divisional Secretariat areas. Each Divisional Secretariat area has preventive
health units known as “Medical Officer of Health (MOH)”, which administratively comes under
the Regional Directorate of Health Services. Each MOH is responsible for all the preventive and
promotional health care in a defined area under them and has trained staff to carry out activities at
the field level. The staff of the MOH, led by the qualified medical officer, provide the whole range
of maternal and child health services, control and prevention of communicable diseases,
environmental health, and occupational health.

Public health policies for control and prevention of dengue in Sri Lanka
In 1996 dengue was highlighted as a nationally notifiable disease and was included in the
integrated surveillance system of Sri Lanka. The decision was taken in response to the increasing

 9
case fatality rate observed since 1993. The National Dengue Control Unit, which is the focal point
for the National Dengue Control Programme in the Ministry of Health was established in 2005
following a major dengue outbreak in 2004. It is responsible for coordinating dengue control or
preventive activities with different stakeholders. The NDCU provides technical guidance on
implementing the routine and outbreak response activities, including source reduction through a
door-to-door inspection, biological and chemical larval, and adult vector control in all provinces
of the country. The Presidential Task Force on Dengue (PTFD) was established in May 2010 to
strengthen intersectoral collaboration and to coordinate dengue control activities at national,
provincial, and district levels [33]. In 2012, a web-based interface (DenSys) was introduced with
the intention of notifying suspected dengue patients online to the relevant MOH area of residence
as soon as the patient attended the hospital [34]. This system was developed under the patronage
of the “Dengue Tools”, a consortium funded by the European Union [35]. In response to the
increasing severity of dengue epidemics, the PTFD introduced a new public health policy in June
2014 to intensify source reduction through a large–scale, door–to–door premises inspection
program in the highly–affected Western province. Coordinated by public health authorities, the
program was implemented in partnership with the military, police, communities, and other
stakeholders and is known as the Civil-Military Cooperation (CIMIC) program [36].

Economic burden of dengue and dengue control interventions in Sri Lanka
Sir Lanka provides free health care for all citizens. On average US$4.6 million was allocated for
dengue outbreak control activities each year. Dengue costing studies conducted for the district of
Colombo in year 2012 revealed that the cost of dengue control and hospitalisations together was
US$3.45 million (US$1.50 per capita), of which US$971,360 (US$0.42 per capita) was for dengue
control activities (calculated for the average exchange rate for the year 2012). Personnel (salaries
and allowances) costs accounted for the highest proportion of the costs of dengue control activities
(79%) and of hospitalisations (46%), indicating the human resource-intensive nature of public
health interventions. The average cost of hospitalisation for adult patients ranged between
US$216-609 and for paediatric patients between US$ 196-866 [37]. Household and hospitalisation
cost of paediatric dengue illness in the city of Colombo found that household out of pocket
spending, on average, was US$59 (US$ 52 for DF and US$ 78 for DHF) per episode (calculated
for the average exchange rate at the year 2013). The direct medical cost of hospitalization was
US$68.0 (SD 31.4) for DF episode and US$122.7 (SD 65.2) for DHF/DSS episode [38]. The 2017
epidemic imposed tremendous pressure on the health care expenditure where the direct
government expenditure on dengue control activities was US $ 12.7 million of which US$ 4.4 was
spent for outbreak control activities [28,30].

Aedes vector indices
As recommended by the WHO, Aedes vector surveillance is an essential tool to identify the spatial
and temporal distribution of Aedes vectors for designing specific vector control interventions and
dengue outbreak management [39]. Vector indices are quantifiable proxy measures of adult vector
densities. Also known as Stegomyia indices, the Aedes vector indices were first developed for

 10
vector surveillance in 1923 to eradicate yellow fever in coastal cities of northern Brazil.
Accordingly, the first vector indices described included the Premise (or House) Index (PI), defined
as the percentage of houses infested with larvae or pupae, and the Container Index (CI), defined
as the percentage of water-holding containers infested with active immatures [40]. About 30 years
later, the Breteau Index (BI), the number of positive containers per 100 houses, was developed
[41–44]. Pupal and adult vector densities are considered superior to larval indices but are more
time consuming and require extensive human resources to process [44–47]. There is a wide
diversity in vector surveillance programmes and sampling protocols worldwide [48]. At present,
there are many doubts on the correlation between Aedes larval indices and dengue incidence, and
the scientific evidence on a quantifiable relationship between these two are lacking [47].

Influence of climate variability and weather on Aedes vectors and dengue transmission
Weather consists of the short term (minutes to months) changes in the atmosphere. These changes
can be interpreted in terms of temperature, rainfall, humidity, atmospheric pressure, etc. Climate
is the description of weather patterns in a particular area, usually averaged for 30 years [49].
Climate change is defined as the changes in these average statistical properties with time [50]. In
addition to this long-term climate change, shorter-term climate variations can also be observed and
known as climate variability. This climate variability can be represented by periodic or intermittent
changes (or anomalies) in weather due to El Niño and La Niña conditions or any other changes in
the earth’s climate system [49]. Weather, climate variabilities and climate change are recognised
contributors to changing Aedes vector’s life cycle and the vector’s ability to spread the disease
among humans on local and global scales [51–54].

Rainfall affects vector abundance by converting the natural and artificial sources to breeding
habitats and stimulating egg hatching [55,56]. Even though heavy rainfalls may transiently reduce
the risk of transmission by flushing larvae and pupae away from breeding sites or killing them,
residual water collections increase the future risk for more extended periods [52,57,58]. In dry
seasons the water collecting containers have been found to be productive breeding sites. The Aedes
eggs can withstand dry conditions, remaining dormant for several months until they receive an
appropriate amount of rainfall to hatch [59]. Temperature exerts a considerable impact on
mosquito population dynamics and vector-virus interactions [20]. The influence of the temperature
spans across egg to immature mosquito development, ovarian development, and the survival of all
stages of the life cycle of Aedes mosquitoes. At higher temperatures, Aedes mosquitoes emerge
from eggs to adults in a shorter period [60,61]. The risk of dengue transmission can increase with
elevated temperatures by increasing the reproductive rate and biting rate of vectors and the
probability of human to vector transmission per bite and reducing the extrinsic incubation period
of the virus [62,63].

El Niño Southern Oscillation (ENSO) is the strongest climatic cycle on earth, fluctuating on
decadal and sub decadal time scales [64]. It occurs as a result of the changes in the coupled
atmosphere-ocean system in the equatorial Pacific Ocean. The climate research community has

 11
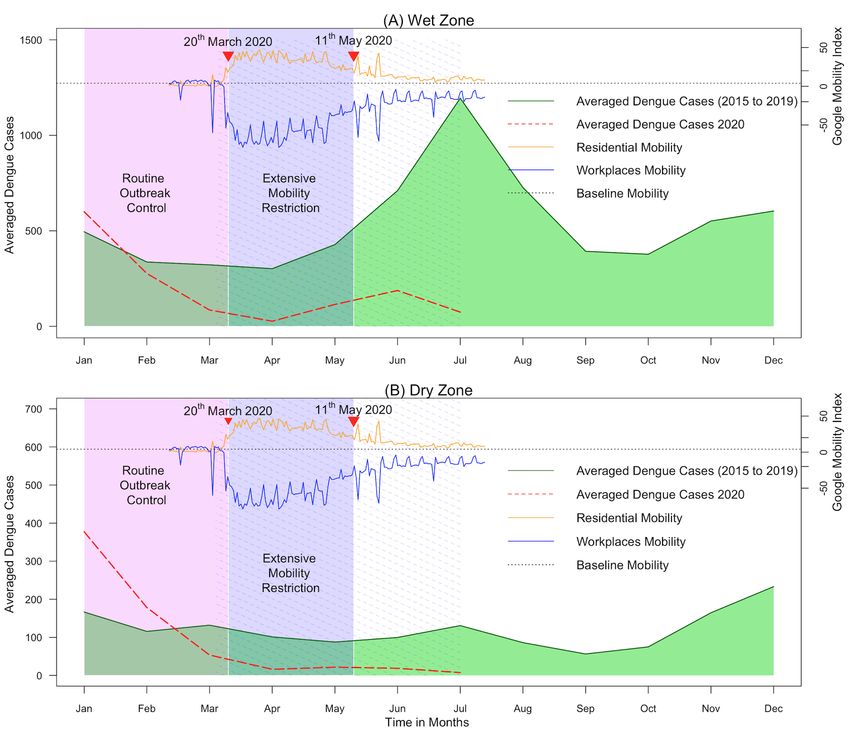
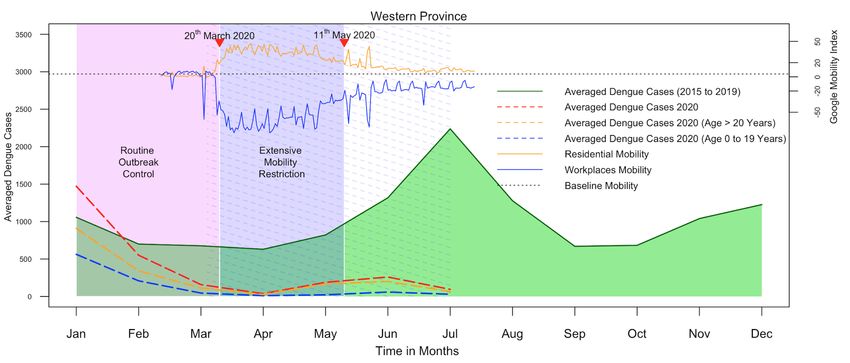
defined the Oceanic Niño Index (ONI), which is the standard measure to identify El Niño (warm)
and La Niña (cold) episodes of the ENSO cycles. The ONI is calculated based on sea surface
temperature anomalies [65] in the Niño 3.4 region (5oN-5oS, 120o-170oW) exceeding 30 years
average [66]. El Niño event is defined when ONI is 0.5 or higher and the La Niña when ONI is -
0.5 or less [67].From the region of origin, the effects of ENSO radiate out towards mid and high
latitude areas through atmospheric teleconnections affecting the weather patterns in several
countries of the Asia, Americas and Africa [64,68,69]. It has been linked to shifting monsoonal
rainfall patents and extreme weather events such as droughts and floods in those countries [70].

Rainfall in Sri Lanka has multiple origins. The two monsoons and convectional activity during the
intervening periods are the dominant weather systems responsible for rainfall in the country
[71,72]. These four seasons are described as first inter-monsoon (FIM) from March to April,
Southwest monsoon (SWM) from May to September, second inter-monsoon (SIM) from October
to November and Northeast monsoon (NEM) from December to February. SWM and SIM (to a
lesser extent) are the two most important seasons in terms of the temporal distribution of rainfall
in western parts of the country [72,73]. Depending on the amount of rainfall received, the island
is divided in to three climatic zones. Wet zone which covers the south-western region including
the central hill country receives a relatively high mean annual rainfall over 2,500 mm particularly
from the SWM. The dry zone covering the northern and eastern parts of the country receives an
annual mean rainfall less than 1750 mm with a distinct dry season from May to September. The
intermediate zone which line in between, receives rainfall between 1750 and 2500 mm with a short
and less prominent dry season [72]. Extreme phases of the ENSO with ONI of more than 0.5 have
been identified as a contributory factor on the seasonal rainfall anomalies of Sri Lanka [70,74–76].
Regional differences observed in air temperature over Sri Lanka are mainly due to altitude rather
than latitude [72,73]. Annually, two dengue epidemics are reported in Sri Lanka the geographical
distribution of which follows the temporal and spatial pattern of SWM and NEM. The major
epidemic is seen in the wet zone following SWM.
Influence of human mobility on dengue
The link between human mobility and the risk of transmission of infectious disease was described
by epidemiologists more than 30 years ago [77,78]. Introduction and spread of dengue in Americas
as a result of the increasing mobility and connectedness of human populations through rapid
international air travel is one such example [79]. Given the limited flying distance of Aedes
mosquitoes, humans’ temporal and spatial scale of movement plays a pivotal role in spreading the
dengue virus from epicenters to other locations within the transmissible period [80]. However, due
to the complex nature of human movements, modelling human movements in terms of predicting
disease risk is challenging. Different attempts have been made to capture human movements using
mobile phone data, Global Positioning Systems, Twitter massages with promising results [78,81]
More recently, Google has developed the COVID-19 community mobility report as a proxy
measure to identify movements by region across different categories of places [82]. However,
these proxies have limitations in access and coverage hindering the process of developing a

 12
universally applicable transmission model. The recent mobility restrictions imposed with the
intention of preventing the spread of SARS-COV-2 infection created an opportunity to understand
the counterfactual effect of human mobility on dengue transmission in different settings.
Sri Lanka had adopted different dengue control strategies at different times in the evolution of
dengue. However, the epidemics continue to rise in magnitude, and the cost of dengue control
activities and patient management remains substantial. The current method of outbreak prediction
in the country mainly consists of pattern recognition and forecasting by disease surveillance system
based on a syndromic definition. However, dengue outbreak detection through disease surveillance
is inadequate in prevention and control since it does not permit enough lead time to launch effective
control strategies [83]. Since Aedes vector surveillance is yet an essential element of
epidemiological risk assessment, it is important to generate quantifiable evidence correlating
vector indices and dengue in varying climate and environmental conditions. Timely and effective
community-level dengue control interventions are needed to address the dengue burden in the
country and to achieve the present targets set by the WHO towards ending neglected tropical
diseases and attaining sustainable development goals [84]. With this context it is important to
understand the heterogeneous nature of the dengue transmission and its contributory factors at the
level of MOH divisions in a district where the control interventions are taking place. This
information is vital for the district, provincial and national health authorities to identify priorities
to set pragmatic vector control targets to bring down the burden of dengue and prevent the
emergence of other Aedes borne diseases such as Chikungunya and Zika. Evaluating the
effectiveness and cost-effectiveness of vector control interventions is an essential element of the
pathway of achieving vector control targets and for public health decision-making on future
interventions such as the introduction of Wolbachia infected mosquitoes and vaccines [85].

 13
Aims and Objectives
This study aimed to understand the influence of climate variability, weather, and public health
interventions, including vector control and mobility restrictions on dengue disease transmission.
We selected Kalutara, one of the highly dengue burdened district in the western province of the
country for the analysis. The methodological framework developed in this study quantifies the
associations and identifies the lead time following exposure to weather variables and subsequent
increase in vector indices and dengue incidence in different MOH divisions in a district. Moreover,
the study describes how to evaluate the impact and economic value of public health response
within a context of constantly changing dengue epidemiology. Health authorities in Sri Lanka and
around the globe can use this information to design targeted source reduction interventions,
implement them with an adequate lead time and evaluate the effectiveness and cost-effectiveness
of those interventions in a changing environment. We hope the study will empower policymakers
to deploy the most efficient and cost-effective interventions in resource-limited settings.
The objectives of the study are listed below.

 1. To estimate the risk of dengue as a function of rainfall, temperature, and Oceanic Niño
 Index in relation to their lag times and describe the heterogeneity of the associations
 among sub-divisions of Kalutara district, Sri Lanka (Paper 1).
 2. To estimate the risk of Aedes larval indices as a function of rainfall, temperature, and
 Oceanic Niño Index in relation to lag times and describe the heterogeneity of the
 associations among sub-divisions of Kalutara district, Sri Lanka (Paper 2).
 3. To quantify the exposure-lag-response association between Aedes larval indices and
 dengue incidence from 2010 to 2019 in all sub-divisions of Kalutara district and evaluate
 the utility of Aedes larval indices to predict dengue outbreaks (Paper 3).
 4. To evaluate the impact of mobility restrictions implemented during the SARS-COV-2
 epidemic on dengue risk in all districts, climate, zones and age groups in Sri Lanka
 (Paper 4).
 5. To evaluate the effectiveness and cost-effectiveness of community vector control
 interventions conducted through civil-military corporation (CIMIC intervention) from
 2014 to 2016 in Panadura MOH division in Kalutara district, Sri Lanka (Paper 5).

 14
Materials and methods

Overview
The studies included in this doctoral thesis involved several materials and methods from different
quantitative analytical disciplines, all fitting to ecological study design. The first three studies
looked at the population level exposure-lag-response associations between weather variables,
Aedes larval indices, and dengue incidence at a highly dengue burdened setting (Kalutara district)
in Sri Lanka. The remaining two studies were quasi-experiment research designs dedicated to trend
analysis before and after the onset of particular public health interventions. Here the focus was to
estimate the counterfactual scenario quantifying the averted number of dengue cases and assessing
the relative changes of the risk of dengue associated with the interventions. In the first three studies,
we extensively used a two-stage hierarchical approach to evaluate the lagged association between
weather variables, vector indices, and dengue. The associations were flexibly estimated at each
sub-district location were meta-analyzed at the district level to obtain robust estimates to the
district addressing as many as possible biases due to area-specific confounders. A similar
hierarchical approach was used to evaluate the impact of mobility restriction on dengue at each
district, climate zone, and national level (fourth study). In our fifth study, more focused attention
was given to one sub-district location (Panadura MOH division) to evaluate the cost-effectiveness
of CIMIC intervention. An in-depth understanding of implementation aspects of the intervention
and financial documentation in the study setting enabled precise parameter estimates leading to
robust evaluation of the cost-effectiveness.

Study setting
Kalutara district is situated in Western Province and represents one of the most dengue prevalent
districts in Sri Lanka for DF and DHF considering past epidemiological data [25]. It has a
population of around 1 million, distributed in a land area of 1501 square km. The population
density is 684 per sq. km. It is divided into 10 MOH divisions (Figure 1). The district's health care
is delivered under the authority of the Ministry of Health Sri Lanka through the Regional Director
of Health Services Kalutara. The annual average rainfall to Kalutara is 3260mm, with the bulk of
the rain falling during Southwest and Northeast monsoons. The lowest annual rainfall, 1600mm is
reported in the coastal regions of the district and the highest, 4280mm is reported towards the inner
border, indicating heterogeneity among divisions. The average temperature ranged between 240C
and 340C. Climatic factors, population factors, geographical factors and entomological factors in
the district probably favouring the increased magnitude of the epidemics from 2009 to 2020 [25].
Annual seasonal variation in the number of cases with rainfall, urban to rural variation of
population, geographical variation from coastal belt to mountain ranges towards the inner part of
the district also represents the characteristics of many other dengue endemic areas in Sri Lanka.
The ethnic composition also represents the Island profile, being Sinhalese 74%, Tamils 18%,

 15
Muslims 7%, and the remaining 1% being Burgers, Malays and other minor ethnic groups [86].
The people live in urban, semi-urban and rural areas with a varying regional annual incidence of
dengue over the past few years.

Different geographical scales within and beyond the district were selected for different analytical
components in the study. All ten MOH divisions were selected to evaluate the exposure-lag-
response association for weather to vector indices, dengue incidence and vector to dengue. The
cost effectiveness analysis of the CIMIC vector control interventions was conducted in one MOH
division (Panadura) within the district. Panadura MOH is one of the 50 most highly affected MOH
area in Sri Lanka. It has a population of 241,344 people distributed over a land area of about 72
km2 and is an urban area. The impact of mobility restriction was further expanded to involve all
twenty-five districts in the country.

Figure 1. Maps showing Sri Lanka, Kalutara District and Panadura MOH division. The map of
Sri Lanka shows the geographical boundaries of the districts. The map of Kalutara district shows
the MOH divisions, cumulative dengue incidence from 2009 to 2020 in each MOH division and
the geographical locations of meteorological monitoring stations in Kalutara district. The solid line
shows the boundaries of the MOH divisions in the district. The blue dots in the map represent the
rainfall monitoring stations, the red triangles represent the temperature monitoring stations, and
the green boxes represents the longitudinal Aedes vector surveillance sites. The map of Panadura
MOH division shows the geographical boundaries of “Grama Niladhari” divisions. Source of the
base file: https://data.humdata.org/dataset/sri-lanka-administrative-levels-0-4-boundaries

 16
Data collection
Dengue surveillance data
In Sri Lanka, an integrated surveillance system of communicable diseases includes dengue and has
island-wide coverage through trained and dedicated clinical and public health staff. National
surveillance data are based on timely, high-yield reports that capture symptomatic dengue patients
classified according to a standard surveillance case definition based on 1997/2011 WHO
classification [16,87]. The curative institutions notify the dengue cases to their respective MOH
division of residence. We extracted weekly notified dengue cases from this National
Communicable Disease Surveillance System for the study period from 2009 to 2020.

Climate data
We used the ground level weather data (rainfall and temperature) measured daily at the monitoring
stations situated in different locations in the Kalutara district. These stations are maintained by the
Department of Meteorology, Sri Lanka. At the initial stages of the study only eight rainfall and
two temperature monitoring stations were available. Weekly cumulative rainfall and weekly mean
temperatures were calculated using daily observations. MOH divisions were assigned the
temperature recordings of the monitoring stations based on proximity. Figure 1 shows the location
of the rainfall and temperature monitoring stations and the MOH divisions in the district. In
addition, remote sensing and gridded temperature data for all the MOH divisions were downloaded
from FetchClimate [88] and Moderate Resolution Imaging Spectroradiometer (MODIS) [89] to
validate the adequacy of coverage of the temperature data for the study setting. ONI data was
obtained from National Oceanic and Atmospheric Administration (NOAA) Centre for Weather
and Climate Prediction. The ONI tracks the 3-month running average of sea surface temperatures
in the east-central tropical Pacific between 120° and 170° W (Niño 3.4 region) [90]. After 2016,
the access granted by the department of meteorology to a total of 18 rainfall monitoring stations
in Kalutara district and one additional temperature monitoring station just outside the district
further extending the ground coverage of climate data.

Vector surveillance data
Dengue vector surveillance is carried out by a team of Health Entomology Officers (HEOs)
appointed to each district. Each team is led by a trained district entomologist. Entomological
surveys are routinely conducted following Sri Lanka’s national guidelines on Aedes vector
surveillance and control under the technical supervision of the National Dengue Control Unit [91].
Both outdoor, indoor, ground level and above-ground areas are examined thoroughly to identify
vector breeding sites. The team uses standard dipping, siphoning, and pipetting methods for larval
collections. At the end of each survey, the mosquito species are identified, and the larval density
indices and the distribution and types of breeding sites for Ae. albopictus and Ae. aegypti are
reported.

Dengue vector surveillance in Kalutara district has three components: long-term sentinel site
surveillance, routine site surveillance, and sporadic vector surveillance. In sentinel and routine

 17
site surveillance, entomological surveys are systematically conducted in pre-determined areas in
the district. The sporadic surveillance targets the areas with dengue outbreaks. In MOH divisions,
smaller administrative units (Grama Niladhari division) where the largest seasonal dengue
outbreaks occurred in the history, were selected as sentinel sites. In Kalutara district, there is one
sentinel site in an urban MOH division, and one in a rural division, as well as one routine site in
each of the 8 remaining divisions. Altogether, ten longitudinal surveillance sites, one per each
MOH division were available (Figure 1). All sentinel and routine sites are surveyed at least once
a month to observe trends in vector density.

Cost data
Panadura MOH division was selected as the study site because it had the highest dengue burden
in Kalutara district. Nationally, Panadura was considered as one of the priority areas for CIMIC
source reduction interventions conducted in the Western province. The cost-effectiveness analysis
of the CIMIC program was conducted from the health provider perspective. The cost data were
extracted from the financial records available at Panadura MOH office. All costs were obtained in
local currency, Sri Lankan Rupees (LKR), and adjusted to 2016 LKR using the consumer price
index for Sri Lanka [92] , and then converted to United States Dollars (US$), using the official
average exchange rate for 2016, 1 US$= 145.5 LKR [93].

MOH division-specific characteristics
MOH division-specific characteristics, which could affect vector density and dengue transmission,
were selected and obtained from the District Statistics Book published by the Department of
Census and Statistics [94]. In addition to the rainfall and temperature, the selected variables were
land area, population density, per-capita land use, household land use, number and type of houses
(luxury houses, slums or huts), land area of rubber cultivation, number of manufacturing industries,
number of schools and school going population in each MOH division.

Statistical Methods
Figure 2 summarizes the statistical methods used in each step of the study. The lagged effect of
exposure variables was quantified based on the degree of exposure, first at the level of each MOH
division and then pooled at the district level to obtain more robust joint estimates for the district.
Using this two-staged hierarchical procedure, we were able to quantify the divisional
heterogeneities. We used distributed lag non-linear models (DLNM) and multivariate meta-
analysis in the R statistical environment for the analysis (steps 1 and 2 of the Figure 2). Generalized
additive models (GAM) were used to evaluate the capacity to predict dengue incidence using the
Aedes vector indices. A non-linear extension to the Interrupted Time Series (ITS) analysis in
combination of GAM were used to evaluate the counterfactual scenario of public health vector
control interventions on the vector indices and dengue incidence while estimating the averted
number of cases (steps 3 and 4 of the Figure 2). Finally, we used the decision analytical model to
evaluate the cost effectiveness of public health vector control intervention when considering
averted disease burden (step 5 of the Figure 2).

 18
Figure 2: Schematic diagram of stepwise analysis and statistical methods used in each analytical
step.

Estimation of exposure-lag-response associations
When assessing the impact of environmental factors on health outcome, the effect of a specific
exposure event is not limited to the time of exposure is observed, but it delayed for some time.
This time between exposure and the subsequent manifestation of health outcome is called lag time.
It is the time taken for ecological and biological processers to happen in different systems until the
appearance of the health outcome. Once this lag component is directly included in the regression
models, instability of the estimates could happen due to high temporal correlation, a phenomenon
known as collinearity. To overcome the effect of collinearity and, to capture the non-linear and
delayed effects of exposure on the outcome, a family of distributed lag models (DLNM) have been
developed [95]. The main feature of this methodology is to specify two independent functions to
model the relationship along the dimensions of predictor (exposure) and lags, respectively. These
two functions are then combined to form cross-basis variables to be included in the regression
model. The parameter estimates of this model describe the bi-dimensional exposure-response
effect [96]. The DLNM models have been shown to provide robust estimates on exposure-response
associations simultaneously along the space of the predictor and its lag dimension[97]. The DLNM
models have been implemented in the R environment and its application is described by Gasparini
et al. (2011) [98].

First stage division specific analysis
The MOH division specific models were developed using DLNM nested within a generalized
linear model architecture with a quasi-Poisson log link function allowing over-dispersion of
dengue count data [99]. Model used to evaluate the association between weather variables and

 19
dengue in Paper 1 is given below

 Y(ti) ~ quasi-Poisson (µ(ti))
 ( !" ) = " + " ( !" , = 3, = 3) + " ( !" , = 1, = 2)
 + " ( !" , = 5) + log ( #" )

where g is a log link function of the expectation µti ≡ E(Yti), with Yti as the series of 260 weekly
aggregates of dengue cases reported from 2009 to 2013 for each i MOH division. t represents the
time in weeks from the first week of 2009 to the last week of 2013. A location specific constant is
estimated by . The exposure variables rainti and tempti correspond to the flexible cross-basis
functions of rainfall and temperature at week t over a lag dimension of 0–12 weeks estimated by
degree of freedom of lag (lag df) and degree of freedom of variable (var df). Time trend (trendti)
with a natural cubic spline function (NSi ) with 1 degree of freedom per year was used to capture
the influence of unmeasured time varying confounders. We also accounted for the changes in the
size of the population by offsetting the mid-year population in each i MOH division (popyi).
Association between ONI-rainfall, ONI-temperature and ONI-dengue was estimated following a
similar approach using monthly mean rainfall, monthly mean temperature, and monthly
cumulative dengue cases respectively. A detailed description is available in the published paper
1[99].

We developed three models one per each vector index (PI, BI and CI) to estimate the lagged
relationship of rainfall, temperature, and ONI on each index separately (Paper 2).

 VIi ~ quasiPoisson(µt)

 E(VI(ti)) = βi + f(Rainfallti, vardf, lagdf) + s(Tti, timedf)

 E(VI(ti)) = βi + f(Temperatureti, vardf, lagdf) + s(Tti, timedf)

 E(VI(ti)) = βi + f(ONIti, vardf, lagdf) + s(Tti, timedf)

where E(VI(ti)) is the expected values for each vector index in month t from first month of 2010 to
the last month of 2018 in each MOH division i, β is the intercept, f(Rainti, vardf, lagdf),
f(Temperatureti vardf, lagdf) and f(ONIti, vardf, lagdf) are the cross–basis functions for each
climate variable in each division i with corresponding degrees of freedom for the climate variables
and their lag values. s(Tti,timedf) is the smooth function of time with degree of freedom timedf. We
modelled lags 0 to 3 months for rainfall and temperature, and 0 to 6 months for ONI. This
assumption was made considering the length of the aquatic phase of the Aedes mosquitoes and
evidence on influence of rainfall and temperature on the generation time to capture any possible
association[20]. Cross–basis function for rainfall was defined by placing the boundary knots at
rainfall values of 0 and 957·3 and placing two central knots at 200 and 400mm with a degree of
freedom of 1. The cross–basis function for temperature was defined by placing two boundary knots

 20
You can also read