THE LARGEST CANADIAN-OWNED POLLING, MARKET RESEARCH AND ANALYTICS FIRM - Leger

Page created by Tracy Williamson
 
CONTINUE READING
THE LARGEST CANADIAN-OWNED POLLING, MARKET RESEARCH AND ANALYTICS FIRM - Leger
THE LARGEST CANADIAN-OWNED
                          POLLING, MARKET RESEARCH
                             AND ANALYTICS FIRM

MONTREAL   •   QUEBEC     TORONTO   •   WINNIPEG   •   EDMONTON   •   CALGARY   VANCOUVER • PHILADELPHIA
THE LARGEST CANADIAN-OWNED POLLING, MARKET RESEARCH AND ANALYTICS FIRM - Leger
COVID-19 TRACKING: INSTANTS, POWERBALL &
MEGA MILLIONS
Intent to buy (among those who say they plan on buying lottery)
        March                                            August                Oct 10/11
60%

                                                                    Mega Millions is down
50%                                                                 approximately 7%,
                                                                    Powerball is down 5%
                                                                    and Instants are down
40%                                                                 3% in terms of intent to
                                                                    play during COVID-19.

30%
      W10
      W11
      W12
      W13
      W14
      W15
      W16
      W17
      W18
      W19
      W20
      W21
      W22
      W23
      W24
      W25
      W26
      W27
      W28
      W29
       W4
       W1
       W2
       W3

       W5
       W6
       W7
       W8
       W9

                         Instants     Powerball     Mega Millions
THE LARGEST CANADIAN-OWNED POLLING, MARKET RESEARCH AND ANALYTICS FIRM - Leger
MEGA MILLIONS AND POWERBALL SALES ARE DOWN
DURING COVID-19

Leger’s research has examined 4 alternatives in 2020

           1    Global-Powerball

           2    Player driven notions

           3    Increasing the number of draws per week (Mega and PB)

           4    A $5 Powerball game version
                                                       BUT…
                                                       Believe it’s less fun
THE LARGEST CANADIAN-OWNED POLLING, MARKET RESEARCH AND ANALYTICS FIRM - Leger
PLAYER NOTIONS (OPEN ENDS) FOR CHANGES TO
MEGA MILLIONS
(March 2020)
Higher payouts when numbers only partly match/when only Mega Ball
                                                                              12%
matches
Change the prize structure so that there are more smaller winners /
                                                                              10%
more prizes / more winners
Better odds / better chances of winning                                       7%

Change the numbers to be played / decrease the range of numbers                 4%
Drop the price to 1$ / 1$ to play                                               4%
Higher payouts / larger prizes                                                  4%
Freebies/second chances for lower tier prizes (ex. just Powerball, just 2
                                                                                2%
numbers, etc.)
Cheaper tickets / less expensive tickets                                        2%
                                                             BUT…
Less complicated / easier to play                                               1%
                                                             Believe it’s less fun
More draws per week                                                             1%
THE LARGEST CANADIAN-OWNED POLLING, MARKET RESEARCH AND ANALYTICS FIRM - Leger
POWERBALL MODIFICATIONS – 4 CHOICES MODEL
                                                                       Past Year,
                                                  Played Past Month Not Past
                                                Lottery Ever Powerball  Month
                                                                       Powerball
Win $1,000 for matching 4 numbers, or 3
numbers + the Powerball                            23%         33%         17%
(Currently this is a $100 win)
Win $4 for matching any number                     22%         19%         29%
(Currently this is a non-winning ticket)

Win $10 for matching 2 numbers                     20%         20%         17%
(Currently this is a non-winning ticket)
Win $100 for matching 3 numbers, or 2 numbers
and the Powerball                                  19%         15%         24%
(Currently this is a $7 win)
                                                       BUT…
                                                       Believe it’s less fun
None of these changes would improve the game       16%        14%            13%
THE LARGEST CANADIAN-OWNED POLLING, MARKET RESEARCH AND ANALYTICS FIRM - Leger
IS MOVING TO MORE DRAWS PER WEEK FOR POWERBALL
AND/OR MEGA MILLIONS A FEASIBLE ALTERNATIVE TO HELP
DECLINING SALES?

      1   Past year players are split on appeal.

      2   50% - Once or twice a week.

      3   More than 20% of players would stop playing either game.

      4   9% of Powerball/7% of Mega Millions players said they would play every day.

                                                     BUT…
      5   Heavier spending players > casual and lowerBelieve it’s players
                                                      spending    less fun
THE LARGEST CANADIAN-OWNED POLLING, MARKET RESEARCH AND ANALYTICS FIRM - Leger
INTEREST IN A $5 ‘NATIONAL’ GAME?
Base: Ever Played Lottery (n=623)

                                                          Lottery
                                               Lottery
                                                         Past Year,
                                       Total    Past                  LAPSED
                                                         Not Past
                                               Month
                                                          Month
                                       623      401         128         94
NET YES: DEFINITELY/PROBABLY PLAY      45%      59%        24%         14%

Definitely play                        26%      36%         9%          4%

Probably play                          19%      23%         16%         9%

Might or might not play                33%      30%         45%        34%
                                                  BUT…
                                                  Believe it’s31%
                                                               less fun 53%
NET NO: Definitely/Probably Not Play   21%      11%
MORE THAN 20M NEW PLAYERS HAVE TRIED INSTANT
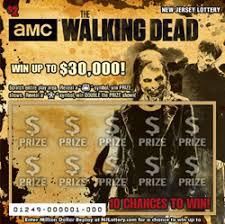
SCRATCH GAMES DURING COVID-19*

                   90% of these have played some form of Lottery before, but it’s still a
                   significant number of U.S. adults (around 2m) who have entered the
                   Lottery sector, looking for something ‘new’ in Scratch.

                                                              BUT…
                                                              Believe it’s less fun

*Humans are notoriously forgetful
AVERAGE WEEKLY SCRATCH SPEND
‘PRE-COVID-19’ VS ‘PAST 3 MONTHS’
JAN-MARCH 2020

                                                                                                        $58
                                                                              $51
                                                $46

                                               Mar-20                     July 24-26                 Aug 28-30

                                                                                        BUT…
                                                                                        Believe it’s less fun
    = Significantly higher at 90% confidence

How much did you spend on Scratch Tickets in an average week, before COVID-19?
How much are you spending on Scratch Tickets in an average week in the past 3 months?
HOW MUCH DO YOU AGREE WITH THE FOLLOWING STATEMENT
“I am spending more on lottery than gambling during COVID-19.”
(5-point scale from ‘Agree completely’ to ‘Disagree completely’)

                                                                                                                % Agree – Over-Index
   o     11% of the U.S. population agree that they are
         spending more on Lottery than Gambling                                                                 Age 18-29                        17%
         during the current pandemic.                                                                           Age 30-39                        18%

   o     However, the growth appears to be coming
         from two specific areas, Casino Players and                                                         Casino Players                      30%
         Sports Bettors.
                                                                                                             Sports Bettors                      41%
   o     It also skews younger and non-white.
                                                                                                               Non-White                         18%
                                                                                           BUT…
                                                                                           Believe it’s less fun
On a scale from 1 to 5, where 1 is Disagree completely and 5 Agree completely, please tell us how much you agree with the following statement.
I am spending more on lottery tickets/games than gambling at casinos or betting on sports during the COVID-19
Base: US Adults
FAVORITE SCRATCH TICKET PRICE POINT
               Favorite Price Point                           Favorite Price Point
                  (May 22-24)                                     (Aug 28-30)

               $1                   18%                       $1           19%
               $2                      23%                    $2            23%
               $3               11%                           $3      8%
               $5                     21%                     $5            21%
                                                       34%                           34%
             $10                 13%                         $10          13%
             $20               10%                           $20      7%
             $30         0%                                  $30     4%
                                        5% (Net)                                  10% (Net)
             $50           4%                                $50     6%

    = Significantly higher at 90% confidence
And which price of Instant tickets is your favorite?
Base: Past week Instant players, n=143, n=152
CHANGE IN LOTTERY PURCHASE: DEBIT/CARD VS CASH
               Change in Lottery Purchase                                         Change in Lottery Purchase
                     (May 22-24)                                                         (Aug 28-30)

    Yes, I am using                                                    Yes, I am using
   debit/credit more                                 37%              debit/credit more                        52%
    now than cash                                                      now than cash

 Yes, I am using cash                                               Yes, I am using cash
      more than                                18%                       more than             11%
     debit/credit                                                       debit/credit

                          No                          45%                            No                  37%
                                                                                 BUT…
                                                                                 Believe it’s less fun
    = Significantly higher at 90% confidence
Has the way you have purchase Lottery changed during the COVID-19 outbreak?
Base: Played any lottery game last week, n=262, n=282
GREATER USE OF LOTTERY VENDING MACHINES DURING
COVID-19
                                                  Use Vending Machines More
                   (May 22-24)                                                                         (Aug 28-30)

                                                     42%                                                             49%
                                                                                       Yes
                                                                                      Yes

                                                                                        BUT…
                                                                                        Believe it’s less fun
Are you using vending machines more to purchase Lottery tickets during the COVID-19 pandemic?
Base: Played any lottery game last week, n=262, n=279, n=282
PLANNING TO BUY LOTTERY THIS WEEK BY WINNING/NOT
    WINNING
•   More than nine in ten Scratch players (92%) who won on Scratch games last week plan to play lottery this week
    (significantly higher than the portion seen in May).
•   This portion is also significantly higher compared to those who did not win (67%) on Scratch last week.

                 Plan on Buying Lottery                               Plan on Buying Lottery                         Plan on Buying Lottery
                    Tickets this Week                                    Tickets this Week                              Tickets this Week
                       (May 22-24)                                          (July 24-26)                                   (Aug 28-30)
                                                                                                                        92%
                      80%                                                 84%
                                                                                            69%                                    67%
                                       49%

                   Won last        Did not win                         Won last        Did not win
                                                                                            BUT…                   Won last     Did not win
                    week                                                week                  Believe it’s less fun week
    Do you plan on buying lottery tickets this week?
    Base: Those who won and those who did not win last week May (n=72, 69); July (n=72, n=77); August (n=65, n=87)
    Box indicates significantly higher at 90% between groups.
    Arrow indicates a significant difference between June and August at 90%
WILL NEW PLAYERS CONTINUE TO PLAY SCRATCH GAMES
AFTER THE PANDEMIC PASSES?

           Continue to Play                                                                              % Yes
             (Aug 28-30)                                                                          Groups who over-index

                                        No / DK
                                          1%                                      Male    South     West      18-29
HOW CAN CASINOS ATTRACT BACK THE CASUAL
PLAYER DURING AND AFTER COVID-19?
                                                Return to the casino
45%                                     51%                     36%                       2X
                                                                                     … as many casual players
don’t even know if the casino
                                          are not                are unsure          spending less than more
is open at the moment                   planning to

         Casual players are acting carefully when it comes                         No bars/
                        to safety measures                                         restaurants?
                                Want easy access          Want appropriate                of casual players
       Choose slots
       carefully
                                to wipes and hand
                                sanitizer
                                                          screening when
                                                          entering                13%     are positively
                                                                                          impacted
        Attend when
        there are less
        people
                                  Wear a mask             BUT…
                                                          Believe it’s less fun   59%    of core players are
                                                                                         fine without them
HOW CAN CASINOS ATTRACT BACK THE CORE
PLAYER DURING AND AFTER COVID-19?

           Core players are returning to casinos and doing so at a
                                                                                           3X
                                                                                        … more core players
           rate that closely mirrors their pre-COVID-19 visitation.
                                                                                        are spending more

                                                                                   10%
                                                                                 gambled online
                                                                                                         14%
                                                                                                      gambled online
   Core and casual players don’t differentiate when it comes                      pre-COVID-19            now
                      to safety measures
                                                                                              89%
                            Want easy access              Want appropriate        will continue to gamble online once
     Choose slots           to wipes and hand             screening when                  casinos fully reopen
     carefully              sanitizer                     entering
     Attend when
                                                                                   87%                   65%
     there are less            Wear a mask               BUT…                    of pre-COVID-19     of post-COVID-19
     people                                              Believe it’s less fun   online gamblers      online gamblers
                                                                                    are likely to       are likely to
                                                                                     continue             continue
WHAT DOES THE SPORTS BETTING MARKET LOOK LIKE
 RIGHT NOW?
                                                  Demographic Differences
                                                                                        Which sports?
               10%                              16%
                                                Male
                                                                           4%
                                                                          Female                61%
   of Americans have bet on sports
         in the past month
                                                19% 17%                    6%
                                                18-29        29-39         40-64                68%*
                           Bets
                          Placed
                                     Favorite
                                       Bet                                                      29%
Straight (point spread)    59%        49%
Money Line
Total Line
                           50%
                           35%
                                      16%
                                      14%
                                                  Yes, the youngest age group (18-29)
                                                  plays the most…
                                                                                                29%
                                                  BUT… those aged 30-39 and 40-49
Parlay
Head to Head
                           28%
                           23%
                                       6%
                                       8%         have the highest % of heavy players           16%
Teaser                     18%         0%         at 14% ($200+ p/w)
SIMON JAWORSKI           JASON ALLSOPP
President, US Office     Vice-President, Vancouver Office
sjaworski@leger360.com   jallsopp@leger360.com
We know Canadians
You can also read