EARNINGS CALL PRESENTATION - Q1 2018 - APRIL 26, 2018 - BORGWARNER
←
→
Page content transcription
If your browser does not render page correctly, please read the page content below

Earnings Call Presentation
     Q1 2018

April 26, 2018
Safe Harbor Statement
Statements contained in, or incorporated by reference into this presentation, future filings by us with the Securities and Exchange Commission
(“SEC”), and oral statements made by, or with the approval of, our authorized personnel, that relate to our future performance or future events
are forward-looking statements under the Private Securities Litigation Reform Act of 1995. Such statements can be identified by use of forward-
looking words or phrases such as “intend,” “anticipate,” “plan,” “estimate,” “target,” “aim,” “forecast,” “project,” “expect,” “believe,” “we are
optimistic that we can,” “current visibility indicates that we forecast,” “contemplation” or “currently envisions” and similar phrases. Although we
believe that the expectations reflected in these forward-looking statements are reasonable, our expectations may not prove to be correct.
Forward-looking statements are necessarily estimates reflecting the best judgment of our senior management and involve a number of risks and
uncertainties, some of which may be beyond our control, which could cause actual results to differ materially from those suggested by the
forward-looking statements. These risks and uncertainties, among others, include: our dependence on automotive and truck production, both of
which are highly cyclical; our reliance on major OEM customers; commodities availability and pricing; supply disruptions; fluctuations in interest
rates and foreign currency exchange rates; availability of credit; our dependence on key management; our dependence on information systems;
the uncertainty of the global economic environment; the outcome of existing or any future legal proceedings, including litigation with respect to
various claims; and future changes in laws and regulations in the countries in which we operate. All forward-looking statements should be
evaluated with the understanding of their inherent uncertainty. All subsequent written and oral forward-looking statements concerning the matters
addressed in this presentation and attributable to us or any person acting on our behalf are qualified by these cautionary statements. Forward-
looking statements are based on current expectations only and are not guarantees of future performance, and are subject to certain risks,
uncertainties and assumptions. We may change our intentions, beliefs or expectations at any time and without notice, based upon any change in
our assumptions or otherwise. Should one or more of these risks or uncertainties materialize, or should underlying assumptions prove incorrect,
actual results may vary materially from those anticipated, estimated or projected. In addition, some factors are beyond our control. We undertake
no obligation to publicly update or revise any forward-looking statements, whether as a result of new information, future events or otherwise,
except as required by law.

© BorgWarner Inc.                                                   2
Reconciliation to US GAAP
  Q1 2017 to Q1 2018
                                                      Asset                                                                  Non-US GAAP
  $ in millions, except per share data                Impairment &                                                           (Excluding non-
                                         US GAAP      Loss on        Restructuring   M&A                       Other Tax     comparable Items,
                                         (Reported)   Divestiture    Expense         Expense   Sale of Asset   Adjustments   including M&A)

  2018 Q1

  Sales                                  $2,784.3                                                                            $2,784.3

  Gross Profit                           591.8                                                                               591.8

  GP % of sales                          21.3%                                                                               21.3%

  Operating income                       333.5                       (6.0)           (2.2)     2.5                           339.2

  OI % of sales                          12.0%                                                                               12.2%

  Diluted EPS                            $1.07                       $0.03           $0.01     ($0.01)                       $1.10

  2017 Q1

  Sales                                  $2,407.0                                                                            $2,407.0

  Gross Profit                           516.3                                                                               516.3

  GP % of sales                          21.4%                                                                               21.4%

  Operating income                       291.5                                                                               291.5

  OI % of sales                          12.1%                                                                               12.1%

  Diluted EPS                            $0.89                                                                 $0.02         $0.91

© BorgWarner Inc.                                                            3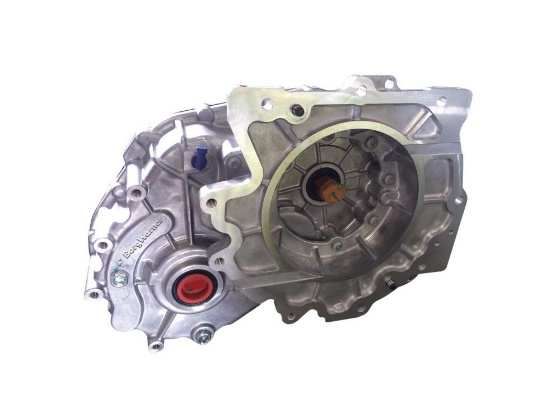
Agenda
   James Verrier – President and Chief Executive Officer
       Macro Outlook and Industry Perspective
       Q1’18 Recap / 2018 Outlook
       Recent Product Announcements

   Ron Hundzinski – Chief Financial Officer
       Q1 2018 Results
       2018 Full Year Guidance / Q2 2018 Guidance

   Q&A

© BorgWarner Inc.                 4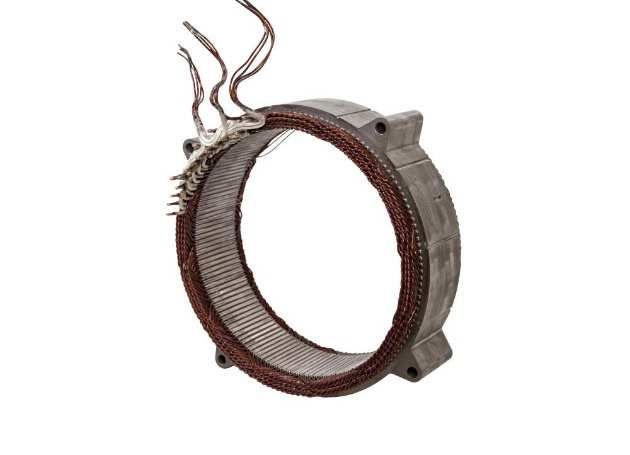
Industry Perspective &
     Company Update

James Verrier, President & Chief Executive Officer

April 26, 2018
Macro Outlook & Industry Perspective

    Q1 Light Vehicle Industry Volumes Modestly
    Weaker, Offset By Commercial Vehicle Growth

    Overall Full-Year Market Outlook Stable

    Hybrid and Electric Program Awards Have
    Continued

© BorgWarner Inc.        6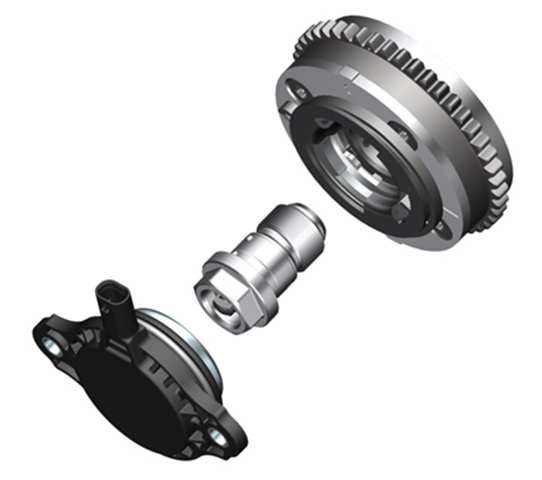
Q1’18 Recap and 2018 Outlook

    Strong Q1 2018 Results
        Organic Growth of 6.6%
        Adjusted EPS of $1.10 vs. $0.99 - $1.03 Guidance

    Full-year 2018 Outlook
        2018 Organic Growth Guidance Maintained
        EPS Range Increased To $4.30 - $4.40

© BorgWarner Inc.             7
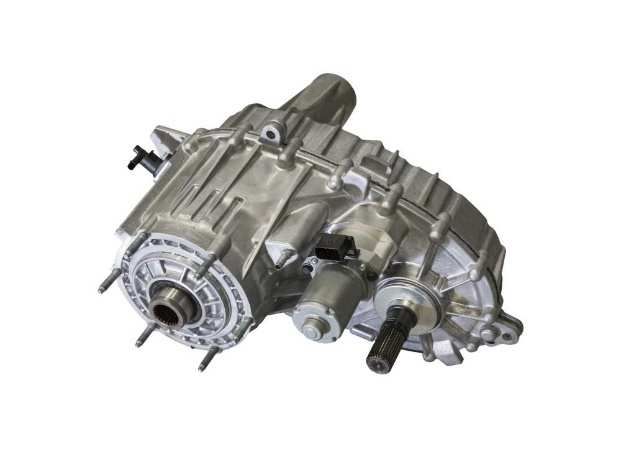
Recent Product Announcements

  eGearDrive®                Electro-Mechanical         Variable Cam          2018 Automotive
  Transmission               On-Demand                  Timing (VCT)          News PACE
  for the First Automotive   Transfer Case              Technology            Award
  Works (FAW) Group’s        for the Ram 1500 4x4       for the new Hyundai   for its S-wind wire forming
  Besturn B30EV and Junpai   pickup truck.              Gamma II engine.      process for electric
  A70E.                                                                       motors and alternators.

© BorgWarner Inc.                                   8

Earnings Review &
     Financial Outlook

Ron Hundzinski, Executive Vice President & Chief Financial Officer

April 26, 2018
BorgWarner Net Sales
 Q1 2017 to Q1 2018, $ in millions

                                     Organic Sales Growth of 6.6%

© BorgWarner Inc.                              10
BorgWarner Operating Income*
Q1 2017 to Q1 2018, $ in millions
17% incremental
margin
12.1% 12.2%
Margin Margin
* Operating income as shown on this slide is non-US GAAP. See reconciliation to US GAAP
© BorgWarner Inc. 11Engine Segment Net Sales & Adjusted EBIT
Q1 2017 to Q1 2018, $ in millions
$140 $0 $7
$74
$1,709 $1,716
$1,569
$1,495 4.9%*
Q1 2017 net sales Market growth, price and FX Q1 2018 sales pre-Sevcon Sevcon Q1 2018 net sales
net new business
$18
$280 $280
$16 $0
$262
$246 22% incremental
margin
16.5% 16.3%
Margin Margin
Q1 2017 adjusted EBIT Market growth, price, net FX Q1 2018 EBIT pre-Sevcon Sevcon Q1 2018 adjusted EBIT
new business and
performance
* % change to net sales
© BorgWarner Inc. 12Drivetrain Segment Net Sales & Adjusted EBIT
Q1 2017 to Q1 2018, $ in millions
$60 $0 $13
$85
$1,070 $1,083
$1,010
$925 9.2%*
Q1 2017 net sales Market growth, price and FX Q1 2018 sales pre-Sevcon Sevcon Q1 2018 net sales
net new business
$7
$13 $124
$3 $121
$117
$104 15% incremental
margin
11.3% 11.2%
Margin Margin
Q1 2017 adjusted EBIT Market growth, price, net FX Q1 2018 EBIT pre-Sevcon Sevcon Q1 2018 adjusted EBIT
new business and
performance
* % change to net sales
© BorgWarner Inc. 132018 Full Year Guidance © BorgWarner Inc. 14
Organic Sales Growth of 5.0% - 7.0%
 $ in millions

© BorgWarner Inc.   15
Operating Margins Improve YOY
 $ in millions

                                                                                                                           12.5% - 12.6%
             12.4% Margin
                                                                                                                              Margin
     Other Postretirement Income reclass reduced 2017 and 2018 Operating Income $5M and $10M respectively with no EPS impact.

© BorgWarner Inc.                                                 16
2018 Guidance – Other Items
EPS Guidance $4.30 - $4.40
Free Cash Flow $525 - $575 million
CapEx $575 - $625 million
Share Repurchases ~$100 million
R&D Spending ~4% of sales
Tax Rate ~28%
$ / Euro Exchange Rate ~$1.22 / $405M
© BorgWarner Inc. 172018 Second Quarter
Guidance
© BorgWarner Inc. 18Q2 2018 Guidance
Sales Guidance Range $2.70B - $2.75B
Organic Growth 7.0% - 9.0%
EPS Range $1.09 - $1.11
Sevcon Impact ($0.02)
Tax Rate ~28%
$ / Euro FX Rate & Impact $1.23 / $125M
© BorgWarner Inc. 19Thank you! © BorgWarner Inc. 20
You can also read