HUMBLE / WESTFIELD HOUSTON MULTIFAMILY - Submarket metrics and benchmarks: rent, inventory, new supply and sales - River Oaks Equity Partners
←
→
Page content transcription
If your browser does not render page correctly, please read the page content below

DECEMBER 2018

HUMBLE / WESTFIELD
HOUSTON MULTIFAMILY

Submarket metrics and benchmarks: rent, inventory, new
supply and sales.

HUMBLE / WESTFIELD
HOUSTON MULTIFAMILY
DECEMBER 2018

Humble / Westfield submarket metrics
and benchmarks: rent, inventory, new
supply and sales.

TABLE OF CONTENTS
Overview                              1
Submarket Fundamentals                2
Rental Activity by Unit Type          3
Development Activity                  4
Transaction Activity                  5

                                            71 Properties                 B Average Location Rating
                                            16,761 Units                  B Average Improvements Rating
                                           PROPERTY AGE BY UNITS         IMPROVEMENTS RATING BY UNITS

CONTACT US                                 EFFECTIVE BEDROOMS BY UNITS   BUILDING STORIES BY PROPERTIES
Get in touch with our team for inquiries
and feedback

Ron Brock
Industry Principal, Matrix
(480) 663 1149 ext. 2404

Candice Spencer
Customer Service/Retention Manager
(480) 663 1149 ext. 2417

                                                                                                          1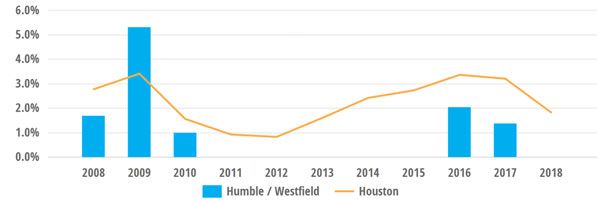
DECEMBER 2018
SUBMARKET FUNDAMENTALS

RENTAL RATES YEAR-OVER-YEAR ROLLING CHANGE VS MARKET

                                                                              36 th
                                                                              Rank out of
                                                                              64 Submarkets

                                                                              1.0%
                                                                              Y-o-Y Change

                                                                              $805
                                                                              Average Rental Rate
                                                                              December 2018

OCCUPANCY RATE VS MARKET

                                                                              30 th
                                                                              Rank out of
                                                                              66 Submarkets

                                                                              93.7%
                                                                              Occupancy Rate
                                                                              December 2018

INVENTORY GROWTH COMPLETIONS AS % PRIOR INVENTORY

                                                                              N/A
                                                                              Rank out of
                                                                              66 Submarkets

                                                                              0.0%
                                                                              Growth in 2018 -
                                                                              Projected Year End

                                                                              N/A
                                                                              Units built in 2018 -
                                                                              Projected Year End

                                                       Humble / Westfield | Houston Multifamily | 2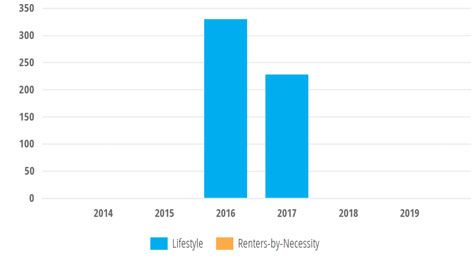
DECEMBER 2018
RENTAL ACTIVITY BY UNIT TYPE

QUARTERLY YEAR-OVER-YEAR ROLLING CHANGE BY UNIT TYPE

                                                                      2017                                      2018
Unit Type              # Units        SqFt/Unit          Q1         Q2         Q3     Q4           Q1          Q2          Q3               Q4

One Bedroom              9,717              676       3.2%        0.1%       0.1%   1.8%         1.9%       5.4%         5.5%             1.8%
Two Bedrooms             6,982              937       2.9%        3.0%       3.2%   3.1%         4.5%       4.3%         3.3%             1.1%
Three Bedrooms             879            1,009       -2.8%       -0.6%      0.6%   1.9%         5.5%       4.6%         2.8%             1.4%
Other                      259              392       0.4%        -0.1%      1.5%   1.6%         5.5%       3.9%         1.2%             0.6%
         Overall       17,837              754       3.1%         1.5%       1.6%   2.4%        3.2%        4.8%        4.4%           1.5%

ONE BEDROOM

                 Rental Rate Change                                                   Average Rental Rate
                    Year-over-Year

                                                  29 th                                                                         60 th
                                                  Rank out of                                                                   Rank out of
                                                  66 Submarkets                                                                 66 Submarkets

                                                  1.8%                                                                          $724
                                                  Y-o-Y Change                                                                  Average Rental Rate
                                                  Q4 2018                                                                       Q4 2018

TWO BEDROOM

                 Rental Rate Change                                                   Average Rental Rate
                    Year-over-Year

                                                  33 rd                                                                         59 th
                                                  Rank out of                                                                   Rank out of
                                                  66 Submarkets                                                                 66 Submarkets

                                                  1.1%                                                                          $920
                                                  Y-o-Y Change                                                                  Average Rental Rate
                                                  Q4 2018                                                                       Q4 2018

THREE BEDROOM

                 Rental Rate Change                                                   Average Rental Rate
                    Year-over-Year

                                                  37 th                                                                         59 th
                                                  Rank out of                                                                   Rank out of
                                                  65 Submarkets                                                                 65 Submarkets

                                                  1.4%                                                                          $1,087
                                                  Y-o-Y Change                                                                  Average Rental Rate
                                                  Q4 2018                                                                       Q4 2018

                                                                                                    Humble / Westfield | Houston Multifamily | 3
DECEMBER 2018
DEVELOPMENT ACTIVITY
Overall Inventory Growth Unit Completions
Ranked * Growth # Units Lifestyle vs Renters-by-Neccessity
Last 5 Years 44th/51 3.44% 558
2018 N/A N/A N/A
2019 N/A N/A N/A
Lifestyle Inventory Growth
Ranked * Growth # Units
Last 5 Years 23rd/45 46.00% 558
2018 N/A N/A N/A
2019 N/A N/A N/A
* among submarkets with completions in this period
UNDER CONSTRUCTION PROPERTIES
Yardi® Matrix has no recorded under construction properties in this Submarket
PLANNED PROPERTIES
Submitted
Property Address # Units Developer
Date 1
Property
Lake Houston Parkway Carolyn Court & South Houston Avenue, 300 Darrow Multi Family Professionals 05/2017
Humble, TX 77044
300
Units
PROSPECTIVE PROPERTIES 2 Properties 292 Units
Humble / Westfield | Houston Multifamily | 4DECEMBER 2018
TRANSACTION ACTIVITY
SALE PRICE (AVERAGE PER UNIT) - LAST 5 YEARS SALES VOLUME - LAST 5 YEARS
th Rank out of th Rank out of
59 63 Submarkets $51K Sale Price
per Unit 14 63 Submarkets 8.4 AvgSoldProperties
per Year
MOST RECENT SALES
Rating Sale Price Loan
Property # Units Built Impr. Loc. Buyer Seller Sale Date Total (MM) Per SqFt Per Unit Maturity Amount (MM)
Maison De Ville 120 1979 C+ B- Lu Yang, Alex Bates, Jr., David H. 11/2018 $4.59 $49.75 $38K $3.44
707 Greens Road
Houston, TX 77060
Alara, The 155 1982 B+ B- Simpson Ashcroft Capital 10/2018 $10.67 $72.99 $69K $8.00
17601 Wayforest Drive Multifamily
Houston, TX 77060
La Esencia 296 1983 B- B AMG Realty Group Monument Real 05/2017 $13.33 $60.34 $45K 2024 $10.00
300 North Vista Estate Services
Houston, TX 77073
Highland Cross 236 1980 B B- PPA Group CFH Investment 04/2017 $12.93 $62.90 $55K $9.70
411 Highland Cross Drive Partners
Houston, TX 77073
La Monterra I 336 1980 B- B- Stone Legacy Group Westdale Asset 02/2017 $19.20 $83.21 $57K 2021 $23.12
310 Parramatta Lane Management
Houston, TX 77073
Sedona Pointe 352 1979 B- B- Nitya Capital Graoch Associates 12/2016 $20.64 $85.78 $59K 2025 $18.00
311 Highland Cross
Houston, TX 77073
Palm Beach Estates 881 1999 B- B- Excel Property Austin Management 05/2016 $24.27 $36.23 $28K $18.20
16818 City View Place Management Group
Houston, TX 77060
Bender Hollow 102 1982 B- B Rockstar Capital HM Equity 05/2016 $7.59 $97.25 $74K 2026 $5.70
424 South Bender Avenue Management Management
Humble, TX 77338
CityView West 286 1979 B- B- Madera Companies Austin Management 04/2016 $14.97 $60.82 $52K 2025 $13.00
400 Greens Road Group
Houston, TX 77060
Humble / Westfield | Houston Multifamily | 5DECEMBER 2018
METHODOLOGIES
COVERAGE
Yardi® Matrix reports on multifamily properties of 50+ units in size.
Rental rate coverage is for Market Rate properties only. Fully Affordable properties are not included in our rental surveys and are not reported in rental rate
averages.
GENERAL DEFINITIONS DEVELOPMENT ACTIVITY
Improvements Rating – a standardized rating of property New construction is tracked by Yardi ® Matrix researchers. Construction
improvements, based on functional and structural characteristics. More projects are discovered through various publications and local government
information available at: https://www.yardimatrix.com/About-Us/Our- sources. Projects are tracked on a monthly basis. Completition dates and
Methods. lease-up information are confirmed by phone calls to properties under
construction.
Location Rating – a standardized rating of location desirability, based on
area amenities, income and other factors. More information available at: Prospective Properties – announced construction projects, with no
https://www.yardimatrix.com/About-Us/Our-Methods. specific documents or government fillings.
Asset Class – refers to a generalized category of properties grouped by Planned Properties – are in the planning stages of construction, with
their Yardi® Matrix Improvements rating. documents having been filled with the county or city.
Lifestyle Asset Class – a grouping of all of the highest rated market rate
properties A+, A, A- and B+. Under Construction Properties – have received permits for
construction and broken ground.
Renters-by-Necessity (RBN) Asset Class – a grouping of all of the lowest
rated properties B, B-, C+, C, C- and D.
Projected Completions – projected completions are included in
reported calendar year totals, denoted by a lighter colored series (graphs) or
Fully Affordable – properties where all units offer subsidized rent as part
a notation. Projected totals are based on properties currently under
of a government program, such as Section 42(LIHTC).
construction and their expected completion date.
RENT Rankings – are based on inventory growth (Overall vs Lifestyle); historical
and projected for the next year.
Rental rates are collected by Yardi ® Matrix phone surveyors three times
annually for 95%+ of property and unit configurations. Additionally, a Completions as a % of Prior Inventory – submarkets with less than
representative sample of the market (between 10% and 20%) are surveyed 500 units (Overall, RBN) or less than 300 units (Lifestyle) before growth are
monthly. assigned an N/A value for this metric, to avoid over-stating their significance
in rankings.
Rent Growth Rankings – are based on rent growth over the past year,
current month (Pg2) or current quarter (Pg3). Submarkets with less than 3 Construction and Completion Counts – are reported based on
surveyed properties or less than 100 surveyed units are not included in property status as of the start of the month.
rankings.
TRANSACTION ACTIVITY
OCCUPANCY
Sale and loan information is tracked by Yardi ® Matrix researchers. Sales
Occupancy rates are derived from U.S. Postal Service data and Yardi®
are discovered through various publications and local government sources,
Matrix phone surveys.
and updates are made continously. Loan information is collected from local
government sources, GSEs and publicly available SEC data.
Unpublished and Portofolio sales are not included in sale aggregate totals.
Humble / Westfield | Houston Multifamily | 6You can also read