Long Term Plan 2021 2031 - Financial Strategy - Tatau tatau - we together - Rotorua Lakes Council
←
→
Page content transcription
If your browser does not render page correctly, please read the page content below
Long Term Plan 2021
      – 2031
  Financial Strategy
       (25th March 2021)

                      Tatau tatau - we together
                                                  1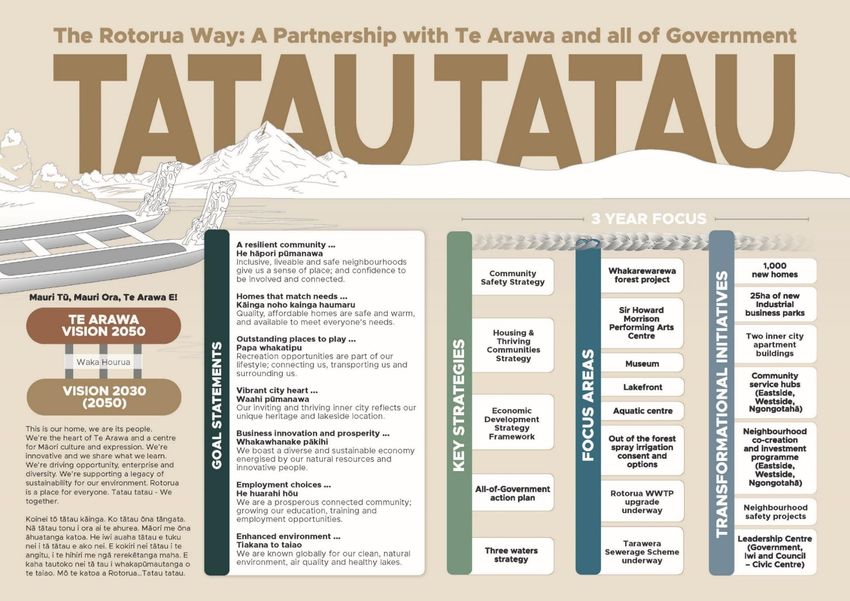
Availability of sources, uses and management of funds to
       align with community goals and objectives

   How will we fund what we say we will do, when, and what are the implications

                                                                                  2
Financial Strategy Overview
Invest in our district to promote housing
Supporting a safer CBD and inner city environment
Drive the digital transformation of council platforms and systems promoting efficiencies and streamlining
of services for the community and staff
Investment to provide safe, stable and reliable essential services
Finish the place making projects we started in 2018 that will provide competitive advantage in the post
COVID-19 world by enhancing the reputation and attraction of our district
Balancing Rates and User charges
Prudent use of debt to facilitate growth
3Vision to Action
Enabling work: Finishing: Transformation:
• Economic development strategy • Whakarewarewa forest • 1,000’s new homes
• Potential Property development partnering project • 25ha of new Industrial business
• Inner city action plan • Sir Howard Morrison parks
• City activation team established Performing Arts Centre • Two transformational inner city
• NPS – UD requirements / monitoring • Museum buildings
• Wood policy review • Lakefront • Community service hubs (Eastside,
• Brand, investment information • Aquatic centre Westside, Ngongotaha)
• Public Safety Strategy • Out of the forest spray • Neighbourhood co-creation and
• Locality planning – Eastside, Westside, Ngongtohaha irrigation consent and options investment programme - Eastside,
• District Plan - new residential (Pukenhangi, Eastside) • Commencement of the Westside, Ngongtohaha
• OneCouncil online services Rotorua WWTP upgrade • Neighbourhood safety network
• Data Strategy, ICT Roadmap & Digital workforce strategy • Commence Tarawera • Leadership Centre (Govt., Iwi &
Sewerage scheme Council – Civic Centre)
5Financial Strategy Summary
Rates - increase in year 1 of 9.2% covering locality and district planning to drive housing, digital transformation, compliance
requirements, go live of new assets, depreciation and financing. Average rates increase of 3.8% across years 2-10
External funding – over $180m in subsidies (2021-2031) with $60m from NZTA to support roading investments, $20m for
CIP projects (Stormwater & Roading) and $9m supporting Three Waters reform with the remainder covering completion of
the Museum, SHMPAC, Lakefront, Rotoiti/Rotoma. In some cases we have proposed we still need to seek funding e.g.
Aquatic Centre option 3
Capital investment – $732m across the 10 years covering items such as Museum, Lakefront, SHMPAC, Whakarewarewa
Forest, Rotoiti/Rotoma Treatment plant, Tarawera Sewerage scheme, Aquatic Centre, Stormwater and Roading to allow
housing development + economic recovery developments
Debt – $180m increase to support our growing community, remains below 250% limit.
Measured increase with debt/income ratio to increase from 2021 estimate of 174% to 224% in 2031
and peaking at 238% in years 2027-2028
6Total Capital Work ($m)
$732m invested over 10 years supporting economic recovery, enabling thriving communities
and ensuring solid renewal investment
158
Finish What we Started
116
LOS
Renewal
83 Growth
71 67
50 50 53 50
33
2021/22 2022/23 2023/24 2024/25 2025/26 2026/27 2027/28 2028/29 2029/30 2030/31
* $732m is in todays $, no inflation included
7Total Capital Work ($m)
Growth, $60m
Finish What we
1. Stormwater $25m
2. Wharenui $15m 8% Started, $227m
3. Roading $7m 1. WWTP $60m
4. Water Supply $7m 2. Museum $55m
5. Sewage $6m 3. Tarawera $22.5m
4. Aquatic centre $28m*
31% 5. Lakefront $17m
6. SHMPAC $11m
7. Rotoiti/Rotoma $20m
8. Whakarewarewa $3m
36%
Renewal, $266m 9. Skate park $2m
1. Roading $75m
2. Sewage $55m
3. Sport & Rec $47m
4. Water Supplies $31m 24%
5. Stormwater $30m
6. Arts & Culture $11m LOS, $178m
7. Pensioner Housing $6m
8. Remainder spread across 1. Westbrook $60m
renewing IT, vehicles and 2. Roading $41m
other smaller programmes of 3. Economic Recovery $20m
work 4. Water Supply $11m
5. Rotoehu Scheme $6m
6. Stormwater $5m
* $732m is in todays $, no inflation included
8Development Contributions
Current debt profile includes ~$30m of development contributions starting in year 2 with an
estimated DC per HUE of ~$7,500 (30m / 4000 properties = $7,500*)
Growth capex to DC Recon
Capex for Growth:
60.0 10.5 $21.6m – Pukehangi Development
12.0
$15m - Wharenui Estate (CIP Funded, $3m in year 1)
6.8 30.7 $16.1m - Eastside
$7.3m – Generalised Growth Funding
$60m
Capex Year 1 CIP Funding Generalised Proposed
for Growth (From Year 2) Growth Development
funding Contribution
Amount
9Borrowings
We do not borrow to fund operational requirements
Debt to increase ~180m over 10 years but remain below our 250% limit
Low cost environment makes debt a prudent approach and is required to deliver growth
Forecast Debt Position (Inflated $m)
600
500
400
$ VALUE
300
200
100
0
2021 2022 2023 2024 2025 2026 2027 2028 2029 2030 2031
Forecasted Debt Debt Cap of 250%
10Debt ($m)
Overall debt for the 10 year period is expected to increase by $181m but front loaded at the
beginning as we complete our key 2030 visionary projects
• Museum 18m
• SHMPAC 7m
• Recovery projects 19m
• Aquatic Centre 17m
• Lakefront 20m
79.0 • WWTP Upgrade 37m
• Storm Water 10m
• WWTP Upgrade
18m Westbrook 19m
47.2
20.7
13.6 10.0 11.0
8.5
1.7
2022 2023 2024 2025 2026 2027 2028 2029 2030 2031
11Sources of Funding
Year 1 Years 1-10
Fees and charges to adhere to funding policy requiring revenue
uplift across a number of activities e.g. planning (consents).
Fees & Charges……………. $18m, 9% $229m, 12% Museum and SHMPAC online
Rates revenues to not exceed 85% of revenue in annual period.
Higher rates reliance vs fees is a proven strategy during COVID.
Rates…………………………... $112m, 55% $1,361m, 73% Annual compound growth in rates of ~3.3%. On average, 60% of
rates is general vs 40% for targeted rates
Subsidies…………………….. $72m, 35% $244m, 13%
Subsidies for Capital works is approx. 78% with the balance
operational, largely NZTA. Of the approx. $180m of capital
subsidies approx. $60m, 32% relates to NZTA with the
Other……………………….….. $1m, 0% $4m, 0% balance supporting key place making projects
e.g. Museum & SHMPAC
12Rates
10.00
9.00
8.00
7.00
RATES INCREASE (%)
6.00
5.00
4.00
Avg CGPI 3.3%
3.00
2.00
1.00
-
2022 2023 2024 2025 2026 2027 2028 2029 2030 2031
YEAR
QUANTIFIED LIMIT ON RATES INCREASES PROPOSED RATES INCREASES (AT OR WITHIN LIMIT)
13Summary
Rates increase balanced with User charges
Considered and Prudent use of Debt
Significant investment into housing and development infrastructure
Increased investment into community safety
Comprehensive renewal and maintenance programme
Finish what we Started
Digital Transformation of how we interact and do business
14Questions
15You can also read


