INVESTMENT STRATEGY GROUP - December 15, 2020 GREGORY M. DRAHUSCHAK | Equity Market Strategist - Janney Montgomery Scott
←
→
Page content transcription
If your browser does not render page correctly, please read the page content below
I N V E S T ME N T S T R A T E G Y G R O U P
December 15, 2020
GREGORY M. DRAHUSCHAK | Equity Market Strategist
THE SANTA CAUSE AND BEYOND
Nearing the end of the year, investors look forward to what is called the “Santa Claus rally,” when the equity market
often rallies through the last five trading days of the year and the first two trading days after New Year’s Day. Why this
happens as often as it does is subject to explanations like increased holiday shopping, optimism fueled by the holiday
spirit, the traditional end to most institutional tax selling by the middle of the month or institutional investors settling their
books before going on a year-end break. Whichever is the cause, it probably is wise not to look a gift “reindeer” in the
mouth if the market does well late in the year.
Chart 1: S&P 500 Performance from December 2018 through 2019 In more than two-thirds of the Decembers
in the past 72 years, the average
cumulative return during the Santa Claus
rally period was 1.3%, and returns on
average were positive in each of the
seven days of the rally.
Anyone that believes in the Santa rally
had their conviction tested severely in
2018 when the S&P 500 fell from 2800.18
on December 3, 2018, to as low as
2346.58 (-16.2%) the day after Christmas.
On cue, however, the S&P 500 rallied off
the intraday low to end the session up
4.96%, on its way to recapturing the
December 3, 2018 high by mid-March and
(Source: StockCharts.com)
more than 3,000 by July 12, 2019.
Chart 2: Avg. Monthly Percentage Results for S&P 500, 1950-2019 WHAT HAPPENS IN DECEMBER
Stretching the Santa myth to include the
stock market makes for an interesting
story, but seasonal patterns probably have
the most influence on what happens late in
December.
As Chart 2 shows, December on average
is one of the best months of the year.
Santa notwithstanding, however, on
average the market hits its December low
around mid-month and then rallies into the
(Source: Janney Investment Strategy Group) New Year.
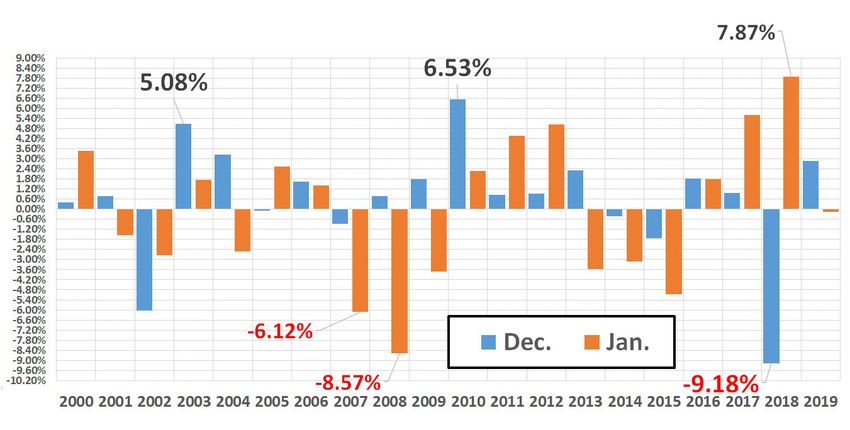
Once a new year dawns, attention turns to how the market does in the first five days of the year and the entire month
of January, as history suggests that both periods foretell what the equity market will do for the entire year. In the past
20 years, however, the S&P 500 posted a gain in only 10 years for an average 0.05% loss, but the S&P 500 was up for
the entire year in 70% of all years 2000 through 2020 inclusive.
WWW.JANNEY.COM • © JANNEY MONTGOMERY SCOTT LLC • MEMBER: NYSE, FINRA, SIPC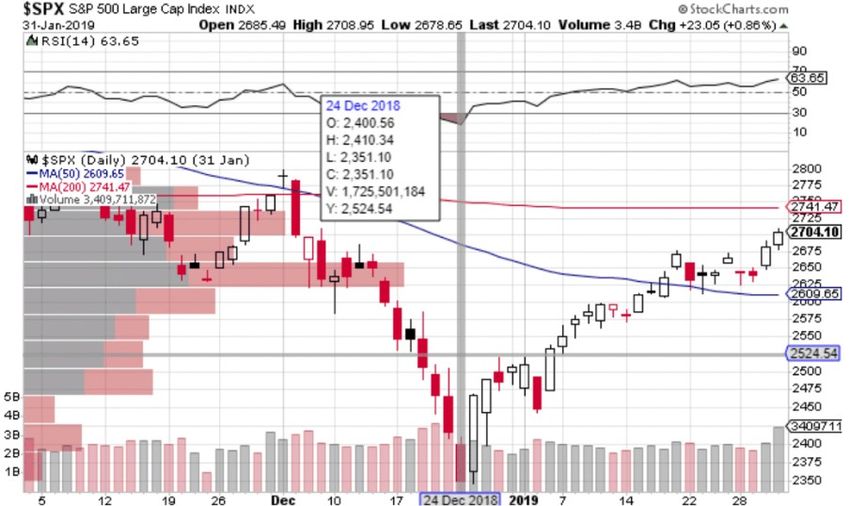
Chart 3: S&P 500 % Results for Decembers and Following Januarys, 2000-2019

(Source: Janney Investment Strategy Group)

Charts 4 and 5: Performance by Sector                                            Months ago, the stock market began considering
                                                                                 which sectors and industries would recover most
                                                                                 once the economy returns to some semblance of
                                                                                 normalcy. Earnings expectations for 2021 and
                                                                                 sector performance since the March 23 low
                                                                                 obviously show what areas of the economy the
                                                                                 market suspects will fare best.

                                                                                 The sharp increases in cyclical sectors like
                                                                                 Materials and Industrials might suggest that the
                                                                                 vast majority of their potential gains have been
                                                                                 realized already. We do not think so. On a year-
                                                                                 over-year basis 2020 to 2021, we suspect these
(Source: Janney Investment Strategy Group)
                                                                                 two sectors, along with the Discretionary sector,
                                                                                 might vie for the best sector returns in 2021.
Chart 6: Year-to-Date Sector Performance

                                                                                    On a year-to-date basis, the Technology sector
                                                                                    has led the sector returns throughout 2020.

(Source: Janney Investment Strategy Group)

                                WWW.JANNEY.COM • © JANNEY MONTGOMERY SCOTT LLC • MEMBER: NYSE, FINRA, SIPC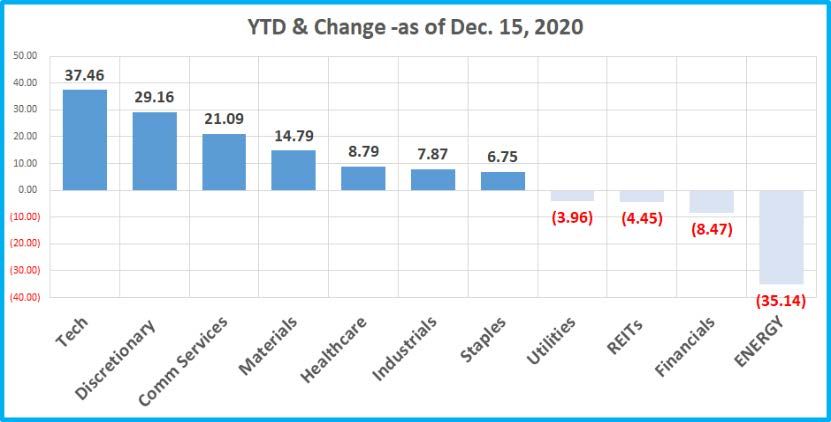
A forward-looking assessment of the stock market cannot ignore that the                                              Chart 7: Sector % of S&P 500
Technology sector is 27.5% of the entire index (see Chart 7), which
emphasizes that any portfolio seeking to match the S&P 500 must have a                                                                            Percent of
large representation in the sector.                                                                                                                S&P 500
                                                                                                                     Technology                      27.5
We, however, would suggest that in 2021, portfolios should lower the tech                                            Health Care                     13.8
portion and use the freed assets to be deployed in the more economically                                             Comm Services                   11.1
sensitive sectors like Materials, Industrials, Discretionary, and Financials.                                        Discretionary                   11.1
                                                                                                                     Financials                      10.6
                                                                                                                     Industrials                      8.7
LOOKING INTO 2021
                                                                                                                     Staples                          6.7
Optimism often pervades the stock market when Santa’s arrival is not far off.                                        Utilities                        2.8
                                                                                                                     Materials                        2.7
This year is no exception. The average 2021 targets for the S&P 500 from 11
                                                                                                                     Energy                           2.6
major Wall Street firms is 4073. As indicated in the Investment Strategy                                             Real Estate                      2.5
Group’s 2021 Outlook report (also available from your Janney Financial
                                                                                                                     (Source: Janney ISG)
Advisor), our view is that the S&P 500 optimistically could see 4500 with
4250 as a reasonably attainable objective.

This report is provided for informational and educational purposes only and shall in no event be construed as an offer to sell or a solicitation of an offer to buy any
securities or a recommendation for any strategy or to buy, sell, or hold any product. Opinions expressed are subject to change without notice and do not take into
account the particular investment objectives, financial situation, or needs of individual investors. Employees of Janney Montgomery Scott LLC or its affiliates may, at times,
release written or oral commentary, technical analysis, or trading strategies that differ from the opinions expressed here. The information described herein is taken from
sources which we believe to be reliable, but the accuracy and completeness of such information is not guaranteed by us. The opinions expressed herein may be given
only such weight as opinions warrant. This Firm, its officers, directors, employees, or members of their families may have positions in the securities mentioned and may
make purchases or sales of such securities from time to time in the open market or otherwise and may sell to or buy from customers such securities on a principal basis.
This report is the intellectual property of Janney Montgomery Scott LLC (Janney) and may not be reproduced, distributed, or published by any person for any purpose
without Janney’s prior written consent. This presentation has been prepared by Janney Investment Strategy Group (ISG) and is to be used for informational purposes only.
In no event should it be construed as a solicitation or offer to purchase or sell a security. Past performance is no guarantee of future performance and future returns are
not guaranteed. There are risks associated with investing in stocks such as a loss of original capital or a decrease in the value of your investment. For additional
information or questions, please consult with your Financial Advisor.

                                          WWW.JANNEY.COM • © JANNEY MONTGOMERY SCOTT LLC • MEMBER: NYSE, FINRA, SIPC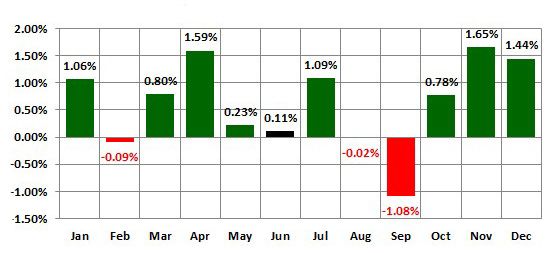
You can also read