Paul Manktelow

Barclaycard Payment Solutions

Hospace 2013
←
→
Page content transcription
If your browser does not render page correctly, please read the page content below
Paul Manktelow Barclaycard Payment Solutions Hospace 2013
Sector Knowledge – L&E

                                                                    Barclaycard CTO Growth
                                                                              YoY:

                                                                     12.3%
                                                              • GPA showed strong growth YoY, key performing
                                                                sectors included Restaurants growing 17% on book
  • Graph shows the overall view of the L&E market              vs. market growth of 17.5%.

  • GPA is one of the largest Acquirers within this sector,   • Although there has been a continued squeeze on
    we have good coverage in both the corporate and the         consumer pockets, restaurants have remained a
    SME sectors                                                 must with discretionary spend.

                                                              • The Fast food sub-sector within restaurants also
                                                                showed strong growth of 28.5% across the whole
                                                                market
Total Open Market

                            Total Open Market: L&E Sector
       Theatre, Ticketing,                   Catering
        Dance & Cinema                         2%
              10%
                    Stadiums Arenas
                           4%

                                                                   In the overall L & E sector, Hotels &
                                                                   Restaurants makes up 43% of the total
                                                                   with Gambling closely behind with 41%
                                                                   of the L&E market.
                                                        Gambling
                                                          41%
                           Restaurants
                              25%

                                         Hotels
                                          18%
L & E Sector

  • Graph shows the view of the L& E sector within GPA   • Graph shows the view of the Open Market, other
                                                           acq’s (not including Barclaycard).
  • GPA is strong in the Hotels and restaurant sector,
    which account for over 50% of the L&E sector         • Within the L&E sector, gambling is the largest sector,
    coverage within GPA                                    followed by Hotels and restaurants.

                                                         • Although the gambling sector makes up a large
                                                           proportion of the total L&E sector overall growth in
                                                           the sector has been minimal, only 2.5% YoY.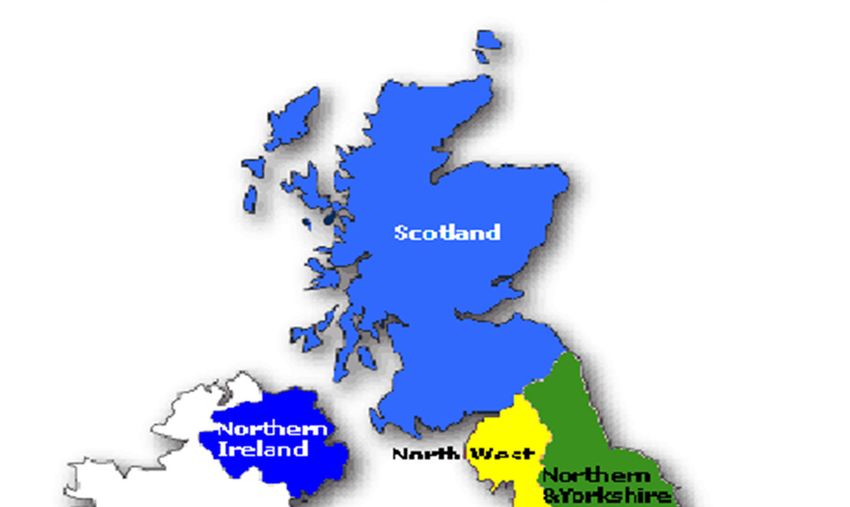
Hotels & Restaurants

  • Graph shows the YoY growth within Hotels in the      • Graph shows the YoY growth within Restaurants in
    Acquiring market                                       the Acquiring market

  • GPA growth slightly behind the market in the Hotel   • GPA growth is slightly behind the overall Market
    sector                                                 growth in Restaurants, but has shown good growth of
                                                           over 17%.
Hotels

         • Showing the growth in the Hotel sector

         • The chart is showing YoY growth rates across the whole sector, we can see that GPA is outperforming
           the market in a number of the bandings

         • Largest growth band for Barclaycard was Mid-corp merchants, however other acq’s largest growth
           band was mid-large corp (£10m - £25m).
Restaurants

       • Showing the growth in the Restaurant sector

       • The chart is showing YoY growth rates across the whole sector, based on Turnover bandings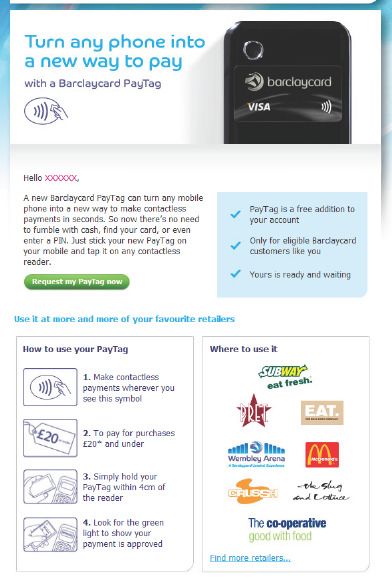
GPA – Hotels and Restaurant Foreign Spend

  • The graph shows the YoY growth of foreign spend   • The graph shows how the YoY transactional count
    within GPA in the Hotels and Restaurant sectors     has grown in Restaurants, but has seen the number
                                                        of foreign transactions reduce in the hotel sector
  • Both sectors are showing a strong growth in the
    value of transactions taken YoY                   • The ATV has been relatively stable in restaurants,
                                                        whereas we have seen a increase in the ATV
Introducing DCC

• Dynamic Currency Conversion allows international visitors the choice to pay in their home currency whilst
  travelling abroad avoiding card issuer charges

• You can make an additional income stream whist offering your customers an opportunity to pay in their own
  currency

• Barclaycard have recently added 11 new currencies, now supporting 32 currencies in total

• The additional currencies have increased potential DCC income by circa 10%

• We now cover approx. 93% of foreign card spend in the UK.

Supported currencies include:

•   Euro
•   US Dollar
•   Chinese Yen
•   Brazilian Real
•   Thai Baht
Barclaycard and DCC
• Barclaycard work with various providers to offer a first class tailored DCC solution

• In 2014 Barclaycard will be launching DCC on the Ingenico Bank Owned terminal – Powered by Fexco

• We will continue to monitor spending trends to ensure we support emerging currencies

There are many benefits to your company by choosing Barclaycard and our DCC service

• Barclaycard offer more currencies than any other Managed DCC solution

• A dedicated Relationship Manager

• Dedicated Multi Currency Support

• Barclaycard’s average DCC hit rate with Fexco is currently 60%

• Guaranteed commission rates for your company
Benefits of DCC within Hospitality
The hospitality industry naturally attracts many overseas visitors, DCC is an ideal and often expected service to
offer your international guests.

• Foreign spend is increasing year on year and rising hit rates demonstrate that customers want to use the DCC
  service, other benefits include:
     An additional income stream
     No Foreign exchange risk to you or your customers.
     Access to an online MI reporting tool
     Currency analysis – top 10 accepted currencies
Customer Profile The table below demonstrates an up-to-date profile of a Barclaycard DCC customer within the Hotel sector. • Foreign spend has increased from 2012 every month YTD • DCC revenue earned for this customer YTD is £775,365
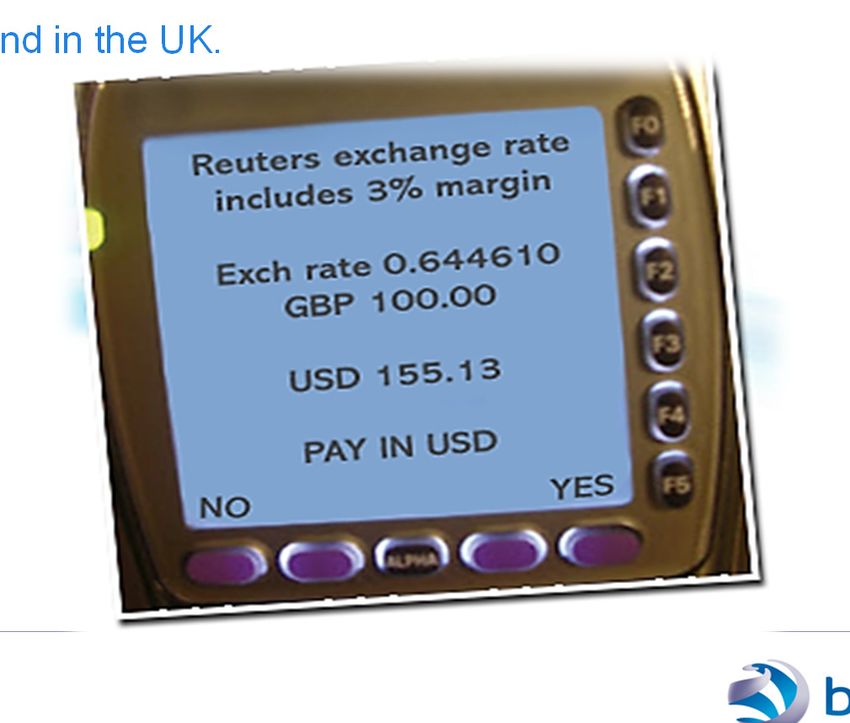
The Contactless journey

payment acceptance
61m transactions so far in 2013……..rising from
              25m in the whole of 2013!
       9m transactions per month in Sept 2013
                                                       Some retailers already see up to 20% of sub
                          24%                          £20 transactions are contactless

              36M+                             Cards issued

164k                   Terminals

                                                                   9.7M+            Transactions in June

payment acceptance
Source: UK Cards Association & Barclays sources – September 2013
Contactless acceleration in 2013 as reported by UK Cards
Apr-13 May-13 Jun-13 Jul-13 Aug-13 Sep-13
Number of Participating Issuers 8 8 8 8 8 8
Number of Contactless Credit Cards 16,195,208 16,409,416 16,471,284 16,567,824 16,766,086 16,765,576
Number of Contactless Debit Cards 16,638,734 17,321,157 18,063,296 18,540,095 19,082,806 19,580,376
Total Number of Contactless Cards 32,833,942 33,730,573 34,534,580 35,107,919 35,848,892 36,345,952
Contactless Terminals in Postcode Range * 0 0 0 0 0 0
Contactless Terminals Within the M25 41,884 42,267 43,923 45,261 44,882 46,035
Contactless Terminals Outside the M25 109,575 111,308 114,495 116,637 118,427 118,530
Total Number of Contactless Terminals 151,459 153,575 158,418 161,898 163,309 164,565
Number of Contactless Transactions
Acquired within the month (includes
internal sites) 6,207,222 6,969,999 7,111,872 8,536,087 8,487,735 9,726,744
Credit/ Charge Card 938,681 1,044,761 1,057,497 1,246,241 1,210,503 1,354,558
Debit Card 5,268,541 5,925,238 6,054,375 7,289,846 7,277,232 8,372,186
Value (£s) of Contactless Transactions
Acquired within the month (includes
internal sites) £40,669,531 £44,820,591 £45,411,030 £55,475,834 £55,081,892 £62,564,076
Credit/ Charge Card £5,882,966 £6,472,002 £6,512,969 £7,824,396 £7,567,967 £8,391,637
Debit Card £34,786,565 £38,348,589 £38,898,061 £47,651,438 £47,513,925 £54,172,439
Average Value of Contactless
Transactions Acquired within the month
(includes internal sites) £6.55 £6.43 £6.39 £6.50 £6.49 £6.43
Credit/ Charge Card £6.27 £6.19 £6.16 £6.28 £6.25 £6.20
Debit Card £6.60 £6.47 £6.42 £6.54 £6.53 £6.47
payment acceptance2013 Contactless Merchant landscape
Coffee Fast Food Convenience Supermarkets Off-licences Charity Health / Transport Discount Parking / Leisure & Clothes/ Other
stores/ Entertainment Accessories
Shops Outlets / Shops Chemist Operators Stores Buses
Restaurant Newsagent
Barclays Acquired: Full roll out
Key
Barclays Acquired; Partial Roll
out
payment acceptanceAnd the journey continues into 2013/14…
Big Tier one
launches and roll
outs in 2013
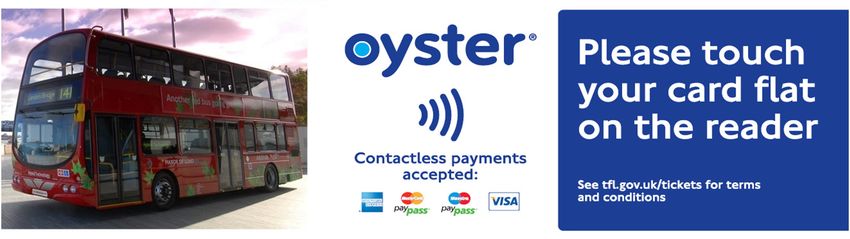
payment acceptanceContactless heatmap for contactless transactions acquired
by barclaycard shows regional spread moving out from the
M25
Region % of Outlets
EAST ANGLIA 6%
LONDON 18%
MIDLANDS 17%
NORTH EAST 9%
NORTH WEST 11%
NORTHERN IRELAND 0%
OUTER LONDON 12%
SCOTLAND 3%
SOUTH 7%
SOUTH EAST 5%
SOUTH WEST 6%
UNKNOWN 0%
WALES 4%
Grand Total 100%
payment acceptance
Source: Barclaycard Acquiring – September 2013Where to use contactless is a key part of our ongoing communications…with more to come payment acceptance
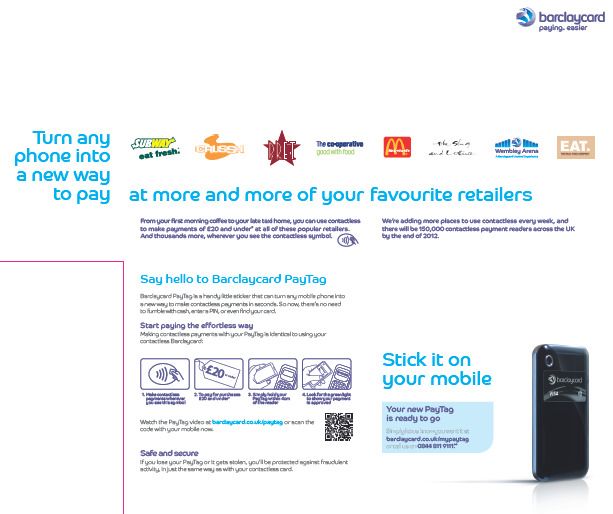
In the last 12 months, we have been busy…..
       Contactless             Contactless Evolution         Barclaycard PayTag            Barclaycard PayBand

                                                          payment acceptance

               Making Mobile                                                   Accepting Mobile
                Payments                         Pingit                           Payments

payment acceptance
Way ahead
Engagement
Knowledge share
Collaboration
Joint planning
payment acceptanceYou can also read