Best Practice Examples - Quota Obligations and Tender Schemes - Environmental Policy Research Centre - OSCE
←
→
Page content transcription
If your browser does not render page correctly, please read the page content below
Environmental Policy Research Centre

                         Forschungsstelle für Umweltpolitik

           Best Practice Examples -
     Quota Obligations and Tender Schemes

David Jacobs
Baku, Azerbaijan, December 2009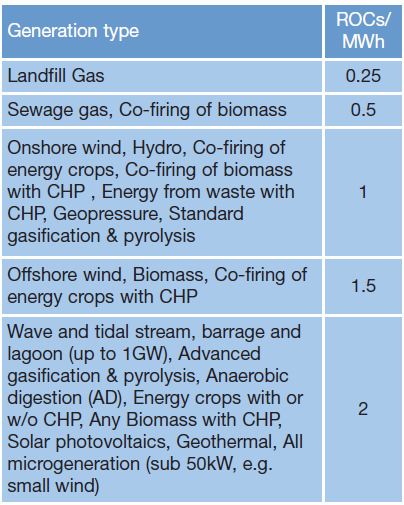
Agenda

Quantity based support instruments

1) Quota obligations
  - Tradeable Green Certificates (TGC) in EU countries
  - Renewable Portfolio Standard (RPS) in the United States

2) Tender schemes
  - France, UK

                                                              2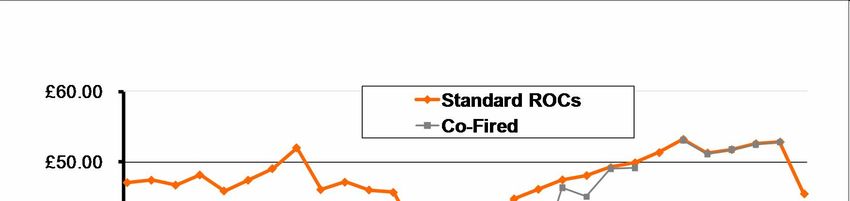
Price versus quantity

• Difference between price-based and quantity based support
mechanisms (primarily Feed-in tariff vs. quota obligation)

SUPPORT               Price                 Quantity
MECHANISMS

Feed-in tariff        „Political price“     Market

Quota-based           Market                „Political quantity“
support/
Tender

                                                                   3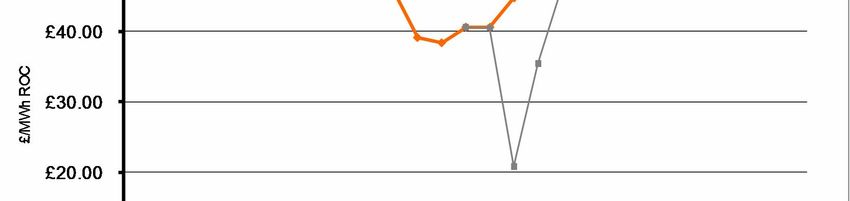
Quota obligations
(TGC and RPS)

                    4
Quota based support – obliged parties
• Obliged party (producer, consumer or supplier) has to
provide a certain percentage of renewable electricity in a
given year
• Examples:
• California (supplier): 22 % in 2010; 33 % in 2020
• UK (supplier): 15.4 in 2015
→ Steadily increase the target over time
5Quota based support – compliance
• Obliged party has different options to prove compliance
with quota based obligation
• Produce renewable electricity
• Buy renewable electricity (bi-lateral, physical trade)
• Trade certificates (multi-lateral, virtual trade)
→ Certificate trading is to increase flexibility of the support instrument
6How does certificate trading work?
ECN 2005
7Revenues under TGC
Cost
Revenues from
certificate
scheme
Market price
Revenues from
market
Price for Price for
conventional renewable
power power
Source: Jacobs 2005
8Quota obligations
- International best
practise
9Quota based mechanisms in the EU (red)
10RPS in the USA
www.dsireusa.org / November 2009
WA: 15% by 2020* VT: (1) RE meets any increase ME: 30% by 2000
New RE: 10% by 2017
MT: 15% by 2015 MN: 25% by 2025 in retail sales by 2012;
(Xcel: 30% by 2020) (2) 20% RE & CHP by 2017 ☼ NH: 23.8% by 2025
ND: 10% by 2015 MI: 10% + 1,100 MW ☼ MA: 15% by 2020
☼ OR: 25% by 2025 (large utilities)* by 2015* + 1% annual increase
5% - 10% by 2025 (smaller utilities) (Class I Renewables)
SD: 10% by 2015 WI: Varies by utility; ☼ NY: 24% by 2013
10% by 2015 goal RI: 16% by 2020
☼ NV: 25% by 2025* CT: 23% by 2020
IA: 105 MW ☼ OH: 25% by 2025†
☼ CO: 20% by 2020 (IOUs)
☼ PA: 18% by 2020†
10% by 2020 (co-ops & large munis)* WV: 25% by 2025*†
☼ IL: 25% by 2025
☼ NJ: 22.5% by 2021
CA: 33% by 2020 UT: 20% by 2025* KS: 20% by 2020 VA: 15% by 2025*
☼ MD: 20% by 2022
☼ MO: 15% by 2021
☼ AZ: 15% by 2025 ☼ DE: 20% by 2019*
☼ NC: 12.5% by 2021 (IOUs)
10% by 2018 (co-ops & munis) ☼ DC: 20% by 2020
☼ NM: 20% by 2020 (IOUs)
10% by 2020 (co-ops)
TX: 5,880 MW by 2015
HI: 40% by 2030 29 states & DC
have an RPS
6 states have goals
State renewable portfolio standard
☼ Minimum solar or customer-sited requirement
State renewable portfolio goal
Solar water heating eligible *† Extra credit for solar or customer-sited renewables
Includes non-renewable alternative resources
11Quota based support - Best practise
• Liquidity of market needed (large number of actors and
project; international market?)
• Certificate market
• Conventional power market
Source: http://www.e-roc.co.uk/graph.cfm
12Quota based support - Best practise
• Price volatility of different certificate trading schemes in the
US (2002-2006)
Source: Mendonca et al. 2009
13Minimum level for certificate price
• Minimum certificate level - to reduce investment risk in
immature markets
• De facto security of price based support instruments
Source: Optres 2007
14Penalties for non-compliance
• Penalty for non compliance needs to be sufficiently high
• Significantly above the marginal generation costs
• Penalty = maximum certificate price
• Sweden has linked the penalty to the certificate price
(150% of certificate price)
15Long time frame for support
• Time frame should reflect long-lifetime of renewable energy
power plants (more than 20 years)
• UK ROC scheme - timeframe until 2037
• Sweden: original time horizon until 2010 – crucial problem for
investment security
16Technology specific support
• Technolgy-specific quotas (RPS in US)
www.dsireusa.org / December 2009
WA: double credit for DG
NH: 0.3% solar-electric by 2014
OR: 20 MW solar PV by 2020;
double credit for PV MI: triple credit for solar MA: TBD
NY: 0.1312% customer-sited
NV: 1.5% solar by 2025; OH: 0.5% solar- by 2013
2.4 to 2.45 multiplier for PV CO: 0.8% solar-electric electric by 2025
by 2020 NJ: 2.12% solar-electric by 2021
IL: 1.5% solar PV
UT: 2.4 multiplier by 2025 PA: 0.5% solar PV by 2020
WV: various
for solar multipliers DE: 2.005% solar PV by 2019;
triple credit for PV not counted
AZ: 4.5% DG by 2025 MO: 0.3% solar-electric toward solar carve-out
by 2021
NC: 0.2% solar MD: 2% solar-electric in 2022
by 2018
NM: 4% solar-electric by 2020 DC: 0.4% solar by 2020;
0.6% DG by 2020 1.1 multiplier for solar
TX: double credit for non-wind
(Non-wind goal: 500 MW)
16 states & DC
have an RPS with
State renewable portfolio standard with solar / distributed generation (DG) provision solar/DG provisions
State renewable portfolio goal with solar / distributed generation provision
17Technology specific support
• Certificate banding (UK)
• Different numbers of years
for issuing certificates (Italy)
• Combination with other
instruments (FIT for solar in
Italy)
18Quota obligations –
pros and cons
19Quota obligation - Advantages
• Exact target achievement (in theory)
• Cost efficiency through focus on least cost technologies (additonal
support for less mature technologies is needed)
Cost Cost
p0
WP X0
C C
p1
P Cert0 WP
P
Cert1
B B
A A
MP MP
Quantity
Quantity
x0 x1
X0
Source: Jacobs 2005
20Quota obligation - Disadvantage
• Exclusive support of low cost technologies
• Certificates issued in the UK (2007)
• Wave power, solar PV and micro hydro were excluded
Sewage gas
offshore wind
biomass
small hydro
onshore wind
co-fireing
landfill gas
Source: Ofgem 2007
21Quota obligation - Disadvantage
• Little investment security (volatile market and certificate
price) requires risk premium for financing (increased capital
costs)
• Little dynamic efficiency (focus on mature technologies), de
facto penalizing technological innovations
22Quota obligation - Disadvantage
•Best applicable in fully liberalized electricity markets
• Large number of independent renewable power producers (for
liquidity on certificate market)
• Large number of independent conventional power producers (for
liquidity on the spot market)
→ Countries with long-term tradition in liberalized energy markets
23Tender/auctioning
mechanism
24Tender/auctioning mechanism
• Government issues call for tender
• Either for total investment cost of one project (investment
focused)
• Generally: cost per unit of electricity (generation focused)
• For example: 100 MW wind energy onshore
• Bidder with the lowest price “wins” contract and has the
exclusive right for renewable electricity generation
• Bid normally includes power generation cost for a long period
of time
25Tender mechanism
- International best
practise
26Tender – International best practise
• Used in Ireland (until 2005), England (until 2003), France,
Denmark (offshore wind) and China (until 2009)
• Tenders should be technology specific
•Continuity of calls for tender in order to create sustainable
market growth (avoid stop-and-go cycles)
• Auctioned capacity should not be to low (transaction costs) nor
too high (strategic bidding)
• Establish a high penalty for non-compliance (to avoid
unreasonably low bids)
27Tender –
Pros and cons
28Tender - advantages
• High degree of cost-efficiency because lowest bidder is chosen
(theoretically)
• Legislator can require additional “demand” (regional
distribution, etc).
→Direct control of legislators over power plant selection (China)
29Tender – disadvantages
• Low effectiveness because of low bids and non-fulfillment of
projects
• Stop-and-go development cycles – insecurity for industry
• Difficulty of establishing a national industry (UK experience)
because of import of cheapest technologies
• Intense price competition favors large players (utilities) or
public companies (without profit interests)
30Thank you for your attention!
David Jacobs
Environmental Policy Research Centre
david.jacobs@gmx.de
http://www.fu-berlin.de/ffu/
31You can also read