Barclays Global Healthcare Conference Investor Presentation - March 2019
←
→
Page content transcription
If your browser does not render page correctly, please read the page content below
Barclays Global Healthcare Conference
        Investor Presentation

             March 2019
Forward-looking Statements and Non-GAAP Information
➢ This presentation may include projections and other “forward-looking statements” within the meaning of the Private Securities
Litigation Reform Act of 1995. Such statements relate to future events and expectations and involve unknown risks and
uncertainties. Omega’s actual results or actions may differ materially from those projected in the forward-looking statements.
For a summary of the specific risk factors that could cause results to differ materially from those expressed in the forward-looking
statements, see Omega’s most recent Annual Report on Form 10-K filed with the Securities and Exchange Commission.
➢ This presentation may contain certain non-GAAP financial information including EBITDA, Adjusted EBITDA, Total Adjusted Debt
(a/k/a, Funded Debt), Adjusted FFO, FAD, Total Cash Fixed Charges and certain related ratios. A reconciliation of these non-GAAP
disclosures is available in the Exhibit to this presentation or on our website under “Non-GAAP Financial Measures” at
www.omegahealthcare.com. Other financial information is also available on our website.
➢ Information is provided as of December 31, 2018, unless specifically stated otherwise. We assume no duty to update or
supplement the information provided.
Investor Presentation, March 2019 2What does Omega Healthcare do?
What does Omega Healthcare do?

            ◼    Among all REITS, Omega has the largest portfolio of Skilled Nursing Facilities (“SNFs”)

                                                            Number of SNF Properties
                                    1000
                                                792
                                    800

                                    600

                                    400                     335
                                                                         187
                                    200                                               140
                                                                                                    93            76
                                       0
                                                OHI        SBRA         WELL         CTRE          LTC            NHI
                                      Source: MedPAC Report to the Congress: Medicare Payment Policy March 2018

            ◼    We also have a growing Senior Housing portfolio concentrated in areas with
                 high barriers to entry

            ◼    We are a “Triple Net” REIT- meaning we own the real estate and improvements
                 but our tenants are responsible for capex, taxes and insurance

Investor Presentation, March 2019                                                                                       4
What is a SNF?
What is a SNF?

            ◼        SNFs are post-acute providers of 24 hour nursing care

            ◼        SNFs are primarily funded through Medicare and Medicaid reimbursement

            ◼        SNFs are the lowest cost provider of post-acute 24 hour nursing care

            ◼        SNFs provide care for much higher acuity patients than can be handled in Senior
                     Housing or Home Health settings – so hospital discharges to SNFs have held steady

                         Average Cost per Day per Care Setting                                                         % of Discharges to SNFs
                        Acute Care                     Post-Acute Care
                                                                                              22.0%
          $2,500         $2,271                                                                                                                       20.2%   20.3%   20.0%
                                                                                                                            19.3%             19.7%
                                                                                              20.0%       18.9%    19.1%             19.3%
          $2,000
                                           $1,512            $1,456                           18.0%
          $1,500
                                                                                              16.0%
          $1,000
                                                                                $508          14.0%
            $500
                                                                                              12.0%
                $0
                                                                                              10.0%
                        Hospital           LTACH               IRF              SNF                       2009     2010     2011     2012     2013    2014    2015    2016

            Sources: 1999-2015 AHA Annual Survey; MedPAC Data Book, June 2016, NIC Skilled   Source: Medicare claims and enrollment, 2009 - 2016
            Nursing Data Report, June 2017

Investor Presentation, March 2019                                                                                                                                             6
Why do we like SNFs?
Why do we like SNFs? Accelerating demand from demographics

            ◼      The aging of the baby boomers will drive a multi-decade increase in demand
                   for SNFs

            ◼      Increasing occupancy will improve SNF operator financial performance and
                   increase their capacity to pay rent

        Source: Avalere analysis of Medicare Part A 100% Standard Analytic File (SAF) for 2016   Source: www.cdc.gov

Investor Presentation, March 2019                                                                                      8
Why do we like SNFs? Limited supply growth
◼ Certified facilities and beds have remained steady for many years, with no
net new supply
(figures in 000s, unless
otherwise indicated)
Source: Compiled by American Health Care Association (AHCA) Research Department from CMS OSCAR/CASPER survey data (2009-2018)
◼ Certificates of Need restrictions apply in 36 states and many other states
have various other restrictions, e.g., bed moratoriums, etc.
Investor Presentation, March 2019 9Why do we like SNFs? Limited disintermediation
◼ Per the most recent MedPAC data, the average SNF margin is 0.7%. This low margin
provides little opportunity for disintermediation.
Average SNF Profit Margin
2.0% 1.90% 1.90%
1.80%
1.60%
1.5%
1.0%
0.70%
0.5%
0.0%
2012 2013 2014 2015 2016
◼ Low disintermediation risk provides additional clarity into investing in the
SNF asset class.
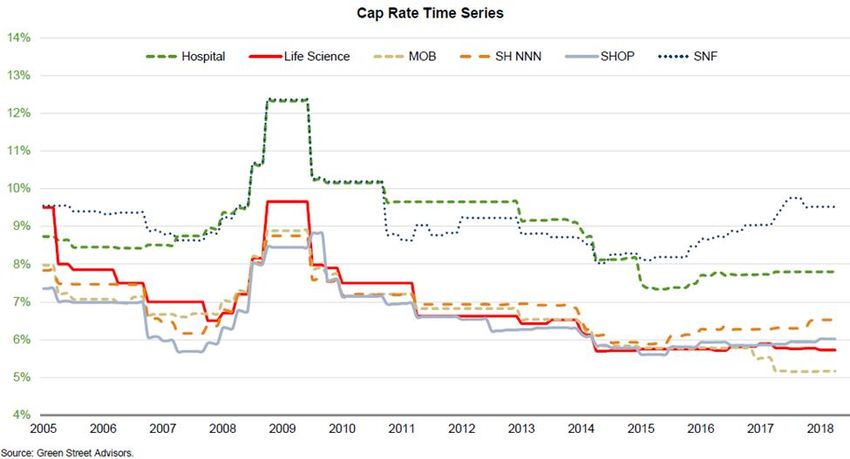
Investor Presentation, March 2019 10Why do we like SNFs? Excellent investment yields
◼ Investing in SNFs is able to provide an excellent entry yield of ~9.5%
◼ This yield compares very favorably with all other healthcare real estate sub-
sectors.
◼ Our standard annual rent escalator is 2.5%, providing a compelling and
growing return for investors.
Investor Presentation, March 2019 11Why do we like SNFs? Long growth runway
◼ Even though Omega is the largest owner of SNFs, we still only own about 5%
of the market.
% of SNF Ownership
CTRE
WELL
SBRA LTC
OHI NHI
5% OHI
SBRA
WELL
CTRE
Other LTC
89%
NHI
Other
◼ Given the accretion created from acquisitions, the fragmented ownership of
SNFs provides a significant opportunity for further growth.
Investor Presentation, March 2019 12How are Omega’s tenants faring?
How are Omega’s tenants faring?

            ◼    Overall, tenants are faring quite well considering average EBITDAR coverage, a proxy
                 for an operator’s capacity to pay rent, has declined in recent years.

            ◼    Caused by multiple headwinds:
                   ❑    Baby bust
                   ❑    Migration to Medicare Advantage and reduction in length of stay
                   ❑    Increase in observation stays
                   ❑    Wage pressures
            ◼    These headwinds are starting to moderate and the demographic tailwinds will help
                 occupancy and operator performance going forward

Investor Presentation, March 2019                                                                       14
How has Omega performed?
How has Omega performed?

            ◼     Omega has a history of strong shareholder returns

            Omega’s Total Returns vs Healthcare REIT Averages (1)                                Omega Share Price Growth, 12/31/2002 to 2/15/2019

                                (Years ending 12/31/2018)

           ◼      We believe we will continue to provide solid shareholder returns through:
                   ❑      Accretive capital allocation
                   ❑      A strong dividend yield
                   ❑      Built-in escalators
                   ❑      A value-enhancing development platform
             1)   Source: KeyBanc Capital Markets The Leaderboard, December 28, 2018. Peer returns are simple average of returns of NHI, HR, LTC, SABRA, VTR, WELL, and HCP

Investor Presentation, March 2019                                                                                                                                       16
Questions?
You can also read