The 'Magnificent Seven' of European Defence Integration - Spyros BLAVOUKOS & Panos POLITIS-LAMPROU
←
→
Page content transcription
If your browser does not render page correctly, please read the page content below
EUROPEAN INSTITUTIONS & POLICIES

The ‘Magnificent Seven’ of
European Defence Integration

Spyros BLAVOUKOS & Panos POLITIS-LAMPROU

                                   June 2021
                                   Policy Paper #73/2021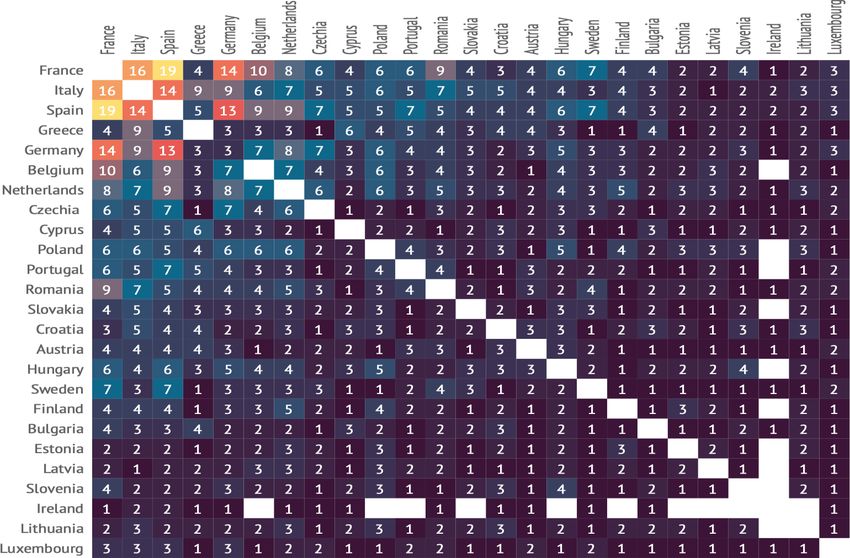
ELIAMEP         | Policy Paper # 73/2021

The ‘Magnificent Seven’ of European Defence
Integration
 Copyright © 2021 | All Rights Reserved
 HELLENIC FOUNDATION FOR EUROPEAN & FOREIGN POLICY (ELIAMEP)
 49 Vasilissis Sofias Ave., 10676, Athens, Greece
 Tel.: +30 210 7257 110 | Fax: +30 210 7257 114 | www.eliamep.gr | eliamep@eliamep.gr

ELIAMEP offers a forum for debate on international and European issues. Its non-partisan character supports the right to
free and well-documented discourse. ELIAMEP publications aim to contribute to scholarly knowledge and to provide policy
relevant analyses. As such, they solely represent the views of the author(s) and not necessarily those of the Foundation.

Spyros BLAVOUKOS
Research Fellow, ELIAMEP; Associate Professor, Athens University of Economics and Business

Panos POLITIS-LAMPROU
BSc, Athens University of Economics and Business

Abstract

Defence cooperation in the EU is growing, reflecting the European citizens’ view of the EU as a
security enhancer. This policy paper takes stock of current developments and analyses the positions
of seven EU member-states on defence integration (France, Germany, Italy, Spain, Poland, Portugal,
and Greece). The ‘Magnificent Seven’ are key players in this process, not least because of their large
defence budgets and their engagement in the existing forms of cooperation. We examine the
defence budget of the seven countries and their breakdown, as well as their participation in
Battlegroups, EU military operations and missions, and PESCO projects. The analysis provides
significant insights on the national defence priorities. The seven countries form overlapping clusters,
according to their political status and aspirations in the European integration process, their economic
condition, their geographical location, and their relations with the US and NATO. All of them are
facing significant dilemmas and engage in subtle balancing acts, which explains the slow and arduous
path of European defence integration.
ELIAMEP                                      Policy Paper #73/2021                                                                    p. 3
The ‘Magnificent Seven’ of European Defence Integration

  Table of Contents

1.      Introduction .................................................................................................................................... 5
2.      ‘No money, no honey’: European defence budgets and EU defence integration ........................ 8
     2.1       Defence Budgets: A Global Perspective .................................................................................. 8
     2.2       Defence Budgets of the ‘Seven’—A Macroscopic Overview ................................................... 9
     2.3       Categorisation of military expenditure ................................................................................. 12
        2.3.1 Size of Armed Forces and Personnel Costs .......................................................................... 12
        2.3.2 Equipment and Infrastructure .............................................................................................. 17
        2.3.3 ‘Other Functions’ .................................................................................................................. 21
3.      EU Schemes of Military Cooperation ........................................................................................... 23
     3.1       EU Battlegroups (EUBGs)....................................................................................................... 23
        3.1.1 Overview............................................................................................................................... 23
        3.1.2 Battlegroup Participation ..................................................................................................... 25
     3.2       EU Military Missions and Operations .................................................................................... 29
        3.2.1 Overview............................................................................................................................... 29
        3.2.2 Participation in the EU Military Missions ............................................................................. 29
     3.3       Permanent Structured Cooperation (PESCO Projects) .......................................................... 33
        3.3.1 Overview............................................................................................................................... 33
        3.3.2 Participation in PESCO Projects ............................................................................................ 35
4.      Discussion...................................................................................................................................... 41
     4.1       “We deal in lead, friend” ....................................................................................................... 41
     4.2    On Defence Budgets: The ‘High-spending Enforcer’, the ‘Unwilling Investor’, the ‘Expensive
     Guardian of the Borders’, and the Others......................................................................................... 42
     4.3   On Military Cooperation: The ‘Unsatisfied Leader’, the ‘Hesitant Partner’, the ‘Aspiring
     Powers’, the ‘Security Demandeur’ and the ‘Ambivalent Débutante’ .............................................. 43
5.      Conclusions: the ‘Fiddlers on the Roof’ of European Defence Integration ................................ 45
Bibliography .......................................................................................................................................... 47
ELIAMEP Policy Paper #73/2021 p. 4 The ‘Magnificent Seven’ of European Defence Integration List of Figures, Graphs and Tables Figure I: Military Expenditure of Countries as Percentage of GDP, 2020 ............................................... 9 Figure II: Number of countries that participate in at least one Battlegroup (2005–2020) ................... 24 Figure III: National contributions to EU military missions and operations ........................................... 30 Figure IV: Bilateral Cooperation in PESCO Projects ............................................................................... 35 Graph I: Military expenditure as percentage of GDP, 2006–2020 ........................................................ 11 Graph II: Personnel contributions to a European Army ........................................................................ 13 Graph III: Expenditure on personnel as a percentage of total military expenditure, 2006–2019 ........ 14 Graph IV: Military personnel as a percentage of the total labor force (2006–2018) .......................... 16 Graph V: Expenditure on equipment as a percentage of total military expenditure, 2006–2019 ....... 19 Graph VI: Expenditure on infrastructure as a percentage of total military expenditure, 2006–2019.. 19 Graph VII: Expenditure on other functions as a percentage of total military expenditure, 2006–2019 ............................................................................................................................................................... 22 Graph VIII: Participations in EU Battlegroups, 2005–2020 ................................................................... 28 Graph IX: Participations in PESCO projects ........................................................................................... 36 Table 1: Military expenditure as percentage of GDP 2006–2020 ......................................................... 11 Table 2: Personnel contributions to a European Army ......................................................................... 13 Table 3: Expenditure on personnel as percentage of total military expenditure (2006–2019)............ 14 Table 4: Military personnel as percentage of total labor force (2006–2018) ....................................... 16 Table 5: Expenditure on equipment and infrastructure as percentage of total military expenditure 2006–2019 ............................................................................................................................................. 18 Table 6: Expenditure on other functions as percentage of total military expenditure 2006–2019 ..... 22 Table 7: Participations in EU Battlegroups 2005–2020 ......................................................................... 25 Table 8: National contributions to EU military missions and operations.............................................. 30 Table 9: Total number of Commanders and French Commanders in EU missions in Central and Western Africa....................................................................................................................................... 31 Table 10: Participations in PESCO projects ........................................................................................... 36 Table 11: Countries’ participation in PESCO Projects by areas ............................................................. 37 Table 12: Summary of the Empirical Findings ....................................................................................... 42
ELIAMEP                                      Policy Paper #73/2021                         p. 5
The ‘Magnificent Seven’ of European Defence Integration

   1. Introduction

In the classic Western The Magnificent Seven, seven wandering gun-slingers join forces to protect the
inhabitants of a remote village from a cruel bandit and his gang. The film, which is a remake of the
also seminal The Seven Samurai by the Japanese director Akira Kurosawa glorifies the sense of duty
that exists among even outcasts and outlaws, but also the agonizing quest for a purpose worth living
and dying for. The film highlights the different motives that can bring highly diverse personalities
together for a just and common cause. Each of the seven has their own reason to join the group,
whether it be money, action, recognition or simply redemption for past crimes and guilt.

What has this film to do with European defence integration? If security and defence integration is the
Holy Grail of the next European narrative, taking the place of economic integration, which has
reached its limits, then it is important to identify how member-states contribute to the existing
European schemes of military collaboration. We argue that this participation, and the concomitant
commitments undertaken, reveal national positions and intentions and are useful as proxy indicators
for the operationalisation of the member-states’ attitudes toward enhanced defence integration.

We focus on seven countries (the ‘Seven’) with quite different features, taking stock of their
contributions and accounting for the underlying motives that drive them. First and foremost, we look
at the Franco-German axis, without which the discussion on defence integration is meaningless both
politically and substantially. The Southern rim countries are also included, namely, Italy, Spain,
Portugal and Greece. This is not only because they face similar security challenges stemming from
their being adjacent to areas of significant regional instability—Portugal to a lesser extent that the
other three, and Greece with the additional external constraint of Turkish expansionism and
revisionism. They also traditionally share an integrationist view on the future of the EU and have
joined the demandeurs’ camp on issues of political and foreign policy integration. Poland is the
seventh country in our study. It is the largest of the bloc of states that joined after 2004 and often
considers and presents itself as the political leader of the countries in the region. The size of the
Polish military, its significant security preoccupations with Russia, as well as its aspirations to play a
leading political role in the European integration process render the country a potentially influential
actor in the process of deepening defence cooperation further.

Obviously, our venture does not claim to be a comprehensive review of all member-states. Countries
with significant armed forces and an active role in the various forms of EU military cooperation, like
Belgium and the Netherlands, are not included in our analysis. Likewise, with their divergent security
concerns and needs, countries from Central and Eastern Europe are underrepresented. However, the
comparison of the seven countries selected allows for substantial variation, useful insights, and
credible conclusions.

To fill in the background to our analysis, back in the 1950s, the initiation of the integration process
was based on the neo-functionalist logic of small incremental steps with cooperation in a limited
number of sectoral policies to overcome the rivalries that had led to catastrophic military conflict in
the past. Economic interaction and interdependence were considered the sword that would cut the
Gordian knot of Franco-German antagonism and competition for dominance and political control in
ELIAMEP                                      Policy Paper #73/2021                        p. 6
The ‘Magnificent Seven’ of European Defence Integration

Europe. This logic flourished in the protected and insulated security bubble provided by the United
States, through NATO, in the broader geopolitical context of the Cold War.

However, the European integration process could have taken a different path. In October 1950, only
a few months after the Schuman declaration of 9 May 1950 that is widely viewed as the formal
launch of the European integration process, the French premier René Pleven announced a similar
project for the defence integration of the same six partners. The Pleven plan envisaged a European
Defence Community (EDC) based on a unified European army that would fully integrate the armed
forces of France, (West) Germany, Italy, Belgium, the Netherlands and Luxembourg. This project
never took off, mainly due to its rejection by the French National Assembly, in 1954. This negative
development not only put the discussion on European defence on ice, it also highlighted for the first
time the gulf often separating the governmental political elites from the national demoi—the same
gulf that would dog the integration process in the decades to follow, causing significant political
turmoil and frequent major upsets, most importantly through the several negative referenda on
Treaty ratifications.

The shelving of the Pleven plan meant that European integration would evolve primarily as an
economic project with political --but not security—ramifications. Other collaborative schemes would
take on the task of enhancing security to (Western) Europe in the form of the Western European
Union (WEU) and, most notably, NATO. Over the decades, timid efforts to institutionalize
cooperation in the field of foreign policy did occur, either in parallel with the integration process
(European Political Cooperation, 1973) or embedded in it (Common Foreign and Security Policy, in
the Maastricht Treaty, 1992).

Nonetheless, the military dimension remained beyond the scope of the European Union until very
recently. The Franco-British St Malo Declaration of 1998 constituted a breakthrough that paved the
way for the ‘Headline Objective’ and the European Rapid Reaction Force agreed to at the Cologne
and Helsinki European Councils in 1999. The concept of Battlegroups followed in 2004, and since the
Treaty of Lisbon the protocol on Permanent Structured Cooperation has provided the institutional
and political framework for enhanced cooperation between those member-states capable and willing
to engage in closer military cooperation (PESCO projects).

There is no doubt that a ‘European army’ is not an option in the foreseeable future. However, to
even discuss the ‘wood’ of European military and defence integration, we need to have a clear idea
of its ‘trees’, which is to say the EU member-states. Hence, it is important to take stock of their
military outlook, and especially their engagement and participation in the existing forms of
collaboration. This stock-taking exercise will reveal how much effort and resources member-states
currently invest in the European military integration venture, which will in turn help us to discuss and
assess their future intentions and aspirations. This is the underlying rationale of this working paper.

Our comparative analysis is structured along two basic axes. Both are resource-oriented, with the
first focused on economic and financial resources (i.e. the budgetary dimension) and the second on
human (and institutional) resources (i.e. the participatory dimension in the existing collaborative EU
military configurations). Starting with the former, we begin by examining the military expenditure of
the seven countries, breaking it down into four categories to enable a more structured and insightful
ELIAMEP                                      Policy Paper #73/2021                            p. 7
The ‘Magnificent Seven’ of European Defence Integration

analysis. These categories are: personnel cost, equipment, infrastructure, and other expenditure.
Moving on to the latter dimension, we present the countries’ level of participation in the existing
forms of EU defence cooperation, namely the EU Battlegroups, contributions to the EU military
missions and operations, and current engagement in PESCO projects.

For the needs of our analysis, we resort to data eclecticism, using four different data sources. We
have chosen this path mainly because there is no single definitional measurement for military
expenditure and the necessary information is spread between different databases. We make
extensive use of the Military Expenditure Database maintained by the Stockholm International Peace
Research Institute (SIPRI), which provides information on defence budgets as a percentage of the
national GDP of each of the countries studied. The EU-27 average comes from Eurostat, which
employs a different methodological approach, however. For example, SIPRI takes into account the
spending on paramilitary forces that receive military training—the French “Gendarmerie National”,
for example, or the Portuguese “Guarda Nacional Republicana”—and the financial burden
constituted by the pensions of retired military personnel. EUROSTAT adopts a stricter and narrower
definition of military spending, which does not even include expenditure on military aid missions. For
the above reasons, SIPRI’s percentages tend to be higher than Eurostat’s. It goes without saying that,
given these discrepancies, the EU-27 average is used for indicative purposes only, and the
comparison between the expenditure of individual member-states and the EU-27 average suffers in
terms of its methodological purity. Still, it is useful to juxtapose these figures for illustrative purposes.

The data on the breakup of the military budget is taken from NATO’s Communiqués de presse.
Definitional differences exist here, too, but they are minor, since SIPRI uses NATO’s statistics as a
guide. The data used on military personnel as a percentage of the total labor force and on personnel
contributions to a European army come from the International Institute of Strategic Studies (IISS).

As far as the second axis of our analysis is concerned—i.e. the participation of the seven member-
states in the existing EU schemes of military cooperation—, we rely on two types of sources. The first
contains information from official documents issued by the European institutions—Council Decisions
and/or Conclusions, for example, or Reports of the European External Action Service (EEAS) and the
Political and Security Committee (PSA)—as well as documents from the European Defence Agency
(EDA). The second type is a database made available by the European University Institute’s Robert
Schuman Centre for Advanced Studies (EUI-RSCAS), which contains detailed information on CSDP
military and civilian missions.

Our analysis highlights the seven countries’ main dilemmas vis-à-vis further European defence
integration. The countries form alternative and overlapping clusters along four axes. Their positions
vary according to their political aspirations vis-à-vis European integration, their economic situation,
their geographical location, and their envisaged relations with NATO. Political relations revolve
around the countries’ views of further European integration. However, participation in military
cooperation schemes is not only a matter of will; it is also a question of resources. The economic
crisis has impacted on the resources available for such ventures, especially in the four Mediterranean
countries. Geography also plays a significant role, with some member-states facing immanent
security threats. Those that do face such threats are, reasonably, more interested in defence
cooperation than those that do not. Still, such cooperation should not jeopardize the future of NATO
ELIAMEP                                      Policy Paper #73/2021                        p. 8
The ‘Magnificent Seven’ of European Defence Integration

as the predominant long-term security provider. Fine tuning all these often contradictory
preoccupations necessitates a delicate balancing act. This means that all seven countries included in
this analysis are, to some extent, ‘fiddlers on the roof’ of European defence integration.

   2. ‘No money, no honey’: European defence budgets and EU defence
      integration

   2.1 Defence Budgets: A Global Perspective

One of the main criticisms leveled by the United States at its European and NATO allies is that they
have been systematically freeriding underneath the American security umbrella while investing
domestically on ‘butter’ rather than ‘guns’. Such complaints and pressures, expressed and exerted by
several US presidents over the years and not just by the Trump administration, led the NATO allies to
agree at the 2014 Wales summit on the threshold of 2 percent of Gross Domestic Product (GDP)
which each member of the alliance should allocate to military expenditure.

According to the Stockholm International Peace Research Institute (SIPRI, 2021), military expenditure
covers the full range of military forces and activities. More specifically, military expenditure is
operationalized as the money used for military forces and operations, the Defence ministry and other
governmental agencies involved in defence-related actions and programs, para-military forces if they
have been trained and organized by state actors, as well as military-oriented space activities. In
general, the demand for military expenditure depends on the extent and type of security challenges
a state is facing, the positive externalities generated by diplomatic alliances, the availability of
resources, and last but not least the political aspirations of the country and its strategic orientation
(Sandler & Hartley, 1995).

From a global perspective, EU member-states invest a relatively small percentage of their GDP in
military expenditure compared with global or regional hegemons or countries situated in or close to
unstable and crisis-prone regions. States like Oman, Saudi Arabia, Algeria, Kuwait and Israel are the
highest spenders in relation to their GDP, with the US and Russia following close behind. The EU
countries that spend the most in relation to their GDP are Bulgaria (3.2%) and Greece (2.6%),
followed by the Baltic states, Poland and Romania, whose percentages are all just above or around
the 2% threshold agreed by NATO. Given the precarious economic condition of some of these
countries and their low GDP in comparison to most other EU member-states, these figures should
not necessarily be considered a credible indicator of large-scale military investment. For Poland and
the Baltic states, historic memory, their proximity to Russia, and the set of recent security crises in
Georgia, Ukraine and the broader neighborhood account for their strategic choices. With the
exception of Greece, which is an old member of NATO, the other states had to undergo a process of
military reorganisation and modernisation in pursuit of NATO membership, which could also account
for their increased military spending in recent years (Flanagan & et al., 2019).
ELIAMEP Policy Paper #73/2021 p. 9
The ‘Magnificent Seven’ of European Defence Integration
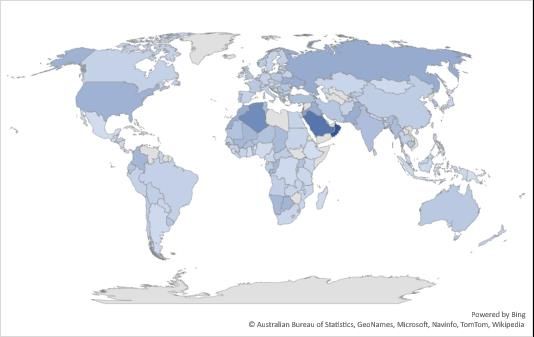
Figure I: National military expenditure as a percentage of GDP, 2020
Source: SIPRI, 2021
Note: There is no data available for Cuba, Djibouti, Equatorial Guinea, Eritrea, Laos, Libya, North Korea, Qatar,
Somalia, Syria, Turkmenistan, Uzbekistan, Venezuela, Vietnam and the United Arab Emirates. Data for
Cambodia, Egypt, Ethiopia, Iraq, Myanmar and Swaziland is highly uncertain. Figures for Bahrain, China,
Georgia, Kyrgyzstan, Lebanon, Luxembourg, Oman, Saudi Arabia, Serbia and Ukraine are SIPRI estimates.
2.2 Defence Budgets of the ‘Seven’—A Macroscopic Overview
In Table 1, we present the military expenditure of the Seven as a percentage of their GDP from 2006
to 2020. Greece consistently spends more in relative terms than any other of the six countries (2.63%
in average), followed by France, Portugal and Poland, which are close but not above the 2% NATO
threshold. At the other end of the spectrum, Spain and Italy spend considerably less, with Germany
occupying the last place in the list. All six countries, with the exception of Germany, are above the
EU-27 average, although, as mentioned in the Introduction, this comparison is for illustrative
purposes only. For 2020, the economic crisis brought on by the pandemic and the subsequent
reduction in national GDPs globally led to a large nominal increase in military expenditure as a GDP
ratio in all the countries under examination. This is worth stressing to avoid jumping to conclusions
on the basis of the 2020 figures (SIPRI, 2021).
France is the EU-27’s military leader in every respect. The increase in the French defence budget at
the end of the first decade of the new millennium was artificial, since it occurred due to the shrinkingELIAMEP Policy Paper #73/2021 p. 10 The ‘Magnificent Seven’ of European Defence Integration of the French GDP and not due to an actual increase in the country’s military spending. Although the growth in French GDP obscures it in the Table, there was a substantial increase in military spending between 2014 and 2016. There were two main reasons for this: ISIS and related terrorist attacks. To counter these threats, France actively engaged in military operations abroad, with the launch of “Opération Chammal” against ISIS, the dispatching of the aircraft carrier “Charles de Gaulle” to the Persian Gulf in 2015 to participate in attacks against the jihadists, and the deploying of French troops in the field to support the Iraqi and Kurdish forces then fighting ISIS. At the same time, “Opération Sentinelle” led to 10,000 soldiers being deployed in France after the January 2015 Île-de-France attacks to protect sensitive home targets. This intensive military activity consumed significant resources (Marrone, De France, & Fattbene, 2016; De Hoop Scheffer, Michelot, & Quencez, 2016; Morcos, 2020). Germany is the country that spends the least on its army in relative terms. The small increase from 2007 to 2008 can be seen as a result of Russian aggression, as experienced in the political turmoil in Estonia and the mobilisation of the Russian-speaking population in Tallin in 2007, and the 2008 Russo-Georgian War in South Ossetia (Kunz, 2018). However, if this is the case, it is interesting to notice that the 2013–14 Russo-Ukrainian imbroglio did not elicit a similar response from the German government neither percentage wise nor in absolute numbers. Cybersecurity has emerged as one of the key German priorities, as evidenced by the establishment of the Cybersecurity Innovation Agency in 2020, with an initial budget of 350 million Euros, to ensure the country’s ‘digital sovereignty’ (Deutsche Welle, 2020). According to state officials, Germany is committed to meeting the 2% NATO requirement. Von der Leyen, the former Federal Defence Minister and current President of the European Commission, stated in 2018 that Germany would be spending 1.5% of its GDP on defence by 2025. Kramp-Karrenbauer, the current Federal Defence Minister, noted that Germany will meet the 2% NATO requirement by 2031 at the latest (Buck, 2018; Von Krause, 2018; Kramp-Karrenbauer, 2019). The financial and public debt poly-crises that hit the Southern periphery hard from 2009 on could be seen in the defence budgets of the countries, most strongly in Greece and Italy. Greece’s defence budget fell from 3.22% in 2009 to 2.33% in 2014. The drop in Greek military expenditure during this period is estimated to be in the region of 40% (Dokos, 2017, p. 209). Italy’s military spending also fell, though less sharply, from 1.56% in 2009 to 1.21% in 2015. The 2015 Italian White Paper highlighted an irrational and inefficient allocation of resources, with too much spending on military personnel, and proposed a plan to reallocate resources toward investments and operations (Ministro della Difesa, 2015). Portugal was hit by the crisis only after the country had launched a program of military modernisation in 2009–2010 which includes the acquisition of new equipment. Due to the crisis, this program had to be postponed and partly cancelled. Spain reveals modest defence budget cuts until 2012, but significant cuts between 2012 and 2016 (from 1.42% to 1.14%). In 2017, the Spanish government committed to increase its military spending by 80% over the next seven years in order to meet its NATO commitments. To meet this target, the Finance Ministry proposed to include the costs of the Civil Guard in the defence budget, which would lead to an artificial 0.2% increase (González, 2017).
ELIAMEP                                      Policy Paper #73/2021                                    p. 11
The ‘Magnificent Seven’ of European Defence Integration

Last but not least, fueled by the country’s concerns about the expansion of Russian influence
westwards, Poland is an aspiring military partner. It is not by chance that the Polish defence budget
reached its highest levels in 2015 after Russia’s illegal annexation of the Crimea. Although
strengthening NATO constitutes the main pillar of Polish foreign and security policy, prudence
suggests a diversification of its defence portfolio, including support for European defence integration
(Bajczuk, 2011; Jankowski, 2015; Zaborowski, 2018).

Table 1: Military expenditure as percentage of GDP, 2006–2020

      Year         EU-27      France       Germany        Greece      Italy     Poland      Portugal           Spain
      2006         1.30%      1.98%         1.22%          2.78%      1.53%     1.92%            1.95%         1.37%
      2007         1.30%      1.91%         1.20%          2.68%      1.45%      2%              1.82%         1.36%
      2008         1.30%      1.90%         1.25%          2.98%      1.54%     1.75%            1.84%         1.37%
      2009         1.40%      2.10%         1.36%          3.22%      1.56%     1.80%            2.03%         1.36%
      2010         1.30%      1.97%         1.32%          2.73%      1.51%     1.83%            1.98%         1.39%
      2011         1.30%      1.89%         1.25%          2.48%      1.49%     1.79%             2%           1.33%
      2012         1.30%      1.87%         1.26%          2.41%      1.44%     1.80%            1.91%         1.42%
      2013         1.20%      1.85%         1.20%          2.36%      1.41%     1.77%            2.09%         1.27%
      2014         1.20%      1.86%         1.14%          2.33%      1.29%     1.90%            1.79%         1.25%
      2015         1.20%      1.87%         1.10%          2.45%      1.21%     2.14%            1.79%         1.27%
      2016         1.20%      1.92%         1.15%          2.54%      1.34%     1.94%             2%           1.14%
      2017         1.20%      1.91%         1.16%          2.52%      1.36%     1.90%            1.68%         1.23%
      2018         1.20%      1.85%         1.18%          2.64%      1.34%     2.06%            1.86%         1.26%
      2019         1.20%      1.86%         1.28%          2.57%      1.35%     2.02%            1.94%         1.24%
      2020             -      2.07%         1.40%          2.80%      1.57%     2.22%            2.14%         1.40%
   AVERAGE         1.26%      1.92%        1.23%          2.63%      1.43%      1.92%            1.92%         1.31%
                                        Source: Eurostat 2021, SIPRI, 2021

Graph I: Military expenditure as percentage of GDP, 2006–2020

 3.4%
 3.2%
 3.0%
 2.8%
 2.6%
 2.4%
 2.2%
 2.0%
 1.8%
 1.6%
 1.4%
 1.2%
 1.0%
         2006 2007 2008 2009 2010 2011 2012 2013 2014 2015 2016 2017 2018 2019 2020

              France        Germany          Greece         Italy      Poland         Portugal           Spain

                                                Source: SIPRI, 2021
ELIAMEP Policy Paper #73/2021 p. 12 The ‘Magnificent Seven’ of European Defence Integration 2.3 Categorisation of military expenditure Following this broad overview of the military expenditure of the seven countries, we will turn our attention to the individual budget lines to compare the expenditure priorities and the composition of the nations’ defence budgets. The NATO database breaks total military spending down into four categories: personnel, equipment, infrastructure and other expenditure. Personnel expenditure captures the costs of military and civilian personnel, including wages and pensions. The equipment expenditure covers armaments and military equipment as well as R&D-related activities. Infrastructure covers expenditure on national military constructions (a national military base, for example) as well as the costs of common NATO infrastructure (like a NATO base). Other expenditure consists of costs for operations, maintenance and other R&D, plus expenditure that does not belong to any of the aforementioned categories (NATO, 2019). 2.3.1 Size of Armed Forces and Personnel Costs 2.3.1.1 Size of Armed Forces and Personnel Contributions to a European Army The seven countries under examination account together for more than 70% of the total personnel of the EU-27 armed forces. Overall, the armed forces of the EU-27 consisted in 2018 of 350,000 fewer personnel than in 2006, a considerable reduction of approximately 15%. This reduction reflects the general trend toward professional, leaner and more specialized armed forces (Burk, 1992; Caforio, 2006; Sheehan, 2011). It is also a direct corollary of the major financial crisis that hit hard especially Southern member-states like Greece, Spain, Portugal, and Italy—all of which traditionally maintain large armed forces. If a European Army were to be agreed upon by the EU member-states and the armed forces of all EU- 27 countries merged, on the basis of the current figures Italy would be the largest contributor in terms of personnel (18%), although this share is smaller than it would have been a decade ago. Italy would be followed by France (c. 16%), Spain, and Germany (with approximately 10% each). Poland (7.7%) and Greece (7.3%) would come next, with Portugal in last place on this short list (at approximately 4%, but still falling). While the share of countries like Italy, Germany and Portugal are dropping, Poland is the only country whose share has significantly increased, from 6.45% in 2006 to 10.25% in 2018. This is illustrative of Polish political aspirations to move center stage by investing in its defence, but also indicative of the security challenges facing the country.
ELIAMEP                                      Policy Paper #73/2021                                          p. 13
The ‘Magnificent Seven’ of European Defence Integration

Table 2: Personnel contributions to a European Army

                    EU-27
    Year                        France     Germany       Greece        Italy          Poland      Portugal       Spain
                    Army
    2006          2.294.862     15.43%      10.72%       7.02%        19.17%          6.45%         3.97%        9.67%
    2007          2.257.862     15.63%      10.81%       7.13%        19.31%          6.29%         4.03%        9.83%
    2008          2.254.962     15.65%      10.82%       7.14%        19.34%          6.34%         4.04%        9.89%
    2009          2.069.093     16.53%      12.15%       6.91%        15.80%          5.87%         4.40%       10.75%
    2010          2.101.107     16.28%      11.97%       7.12%        17.10%          5.78%         4.30%       10.62%
    2011          2.004.680     16.57%      9.78%        7.40%        18.33%          5.89%         4.50%       10.76%
    2012          2.025.550     16.07%      9.20%        7.27%        17.75%          8.53%         4.46%       10.64%
    2013          2.005.400     15.88%      9.05%        7.43%        17.93%          8.61%         3.98%       10.67%
    2014          1.995.100     15.66%      8.95%        7.37%        17.89%          8.66%         3.91%       10.02%
    2015          1.979.130     15.48%      8.96%        7.42%        18.03%          8.73%         3.72%       10.10%
    2016          1.967.550     15.56%      9.10%        7.39%        18.14%          9.07%         3.79%       10.06%
    2017          1.919.000     16.00%      9.38%        7.61%        18.08%          9.95%         2.71%       10.21%
    2018          1.919.805     15.88%      9.45%        7.70%        17.79%          10.25%        2.72%       10.23%
 AVERAGE          2.061.085     15.89%      10.03%      7.30%      18.05%             7.72%         3.89%       10.27%
                                                Source: IISS, 2019

Graph II: Personnel contributions to a European Army

 20%
 18%
 16%
 14%
 12%
 10%
  8%
  6%
  4%
  2%
           2006   2007   2008     2009    2010    2011    2012      2013       2014     2015     2016    2017        2018

              France          Germany        Greece         Italy          Poland             Portugal        Spain

                                                 Source: IISS, 2019

2.3.1.2 Personnel Costs and Military Personnel as a Percentage of the Total Labor Force

Having glanced at the size of the seven countries’ armed forces, Table 3 lists their expenditure on
personnel as a percentage of their total military spending. Italy, Greece, Portugal and to a lesser
extent Spain are by far the top employers, using three fourths of their defence budgets to cover
ELIAMEP Policy Paper #73/2021 p. 14
The ‘Magnificent Seven’ of European Defence Integration
personnel costs. Italy topped the list initially, only to be replaced by Portugal and later on by Greece.
At the other end of the continuum, France, Germany and Poland spend on average only around half
of their defence budget to cover personnel costs.
Table 3: Expenditure on personnel as a percentage of total military expenditure, 2006–2019
Year France Germany Greece Italy Poland Portugal Spain
2006 57.40% 57.10% 73.80% 81.90% 53.80% 76.20% 53.50%
2007 57.10% 54.90% 79.50% 72.80% 54.40% 78.70% 53.00%
2008 57.40% 53.90% 74.10% 70.80% 63.20% 71.70% 70.80%
2009 49.34% 53.19% 56.52% 73.89% 61.08% 75.31% 58.67%
2010 47.64% 52.66% 65.07% 75.08% 56.79% 70.18% 63.38%
2011 49.35% 52.29% 76.03% 74.78% 57.80% 78.30% 64.81%
2012 49.11% 50.60% 73.19% 77.05% 57.34% 78.39% 57.19%
2013 49.23% 49.86% 74.56% 75.00% 57.70% 79.85% 68.25%
2014 48.59% 50.67% 77.18% 76.41% 51.45% 81.27% 67.34%
2015 47.79% 49.86% 72.05% 77.55% 41.96% 81.90% 65.18%
2016 47.94% 48.35% 73.13% 70.79% 47.15% 81.38% 72.61%
2017 47.98% 48.96% 76.56% 67.58% 50.04% 80.19% 61.64%
2018 46.90% 47.99% 78.76% 68.16% 46.14% 74.75% 59.64%
2019 45.81% 45.26% 76.88% 70.21% 48.43% 71.67% 61.86%
AVERAGE 50.11% 51.11% 73.38% 73.71% 53.38% 77.13% 62.71%
Source: ΝΑΤΟ 2011, 2012, 2016, 2018, 2021
Graph III: Expenditure on personnel as a percentage of total military expenditure, 2006–2019
85%
80%
75%
70%
65%
60%
55%
50%
45%
40%
2006 2007 2008 2009 2010 2011 2012 2013 2014 2015 2016 2017 2018 2019
France Germany Greece Italy Poland Portugal Spain
Source: ΝΑΤΟ 2011, 2012, 2016, 2018, 2021ELIAMEP Policy Paper #73/2021 p. 15 The ‘Magnificent Seven’ of European Defence Integration France has reduced its military personnel in two stages. During 2008–14, President Sarkozy announced a round of 54,000 layoffs; he was followed by President Hollande, who announced an additional round of 24,000 layoffs over 2014–19. However, these plans were not implemented in full, with the terrorist attacks limiting the second round of layoffs to only 7,500 employees. Thus, for a decade, France has been reducing both its military personnel costs and the number of people employed in the armed forces as a percentage of the total labor force. This is evidenced by Tables 3 and 4. President Macron has announced 6,000 hirings with a special focus on the intelligence services and cyber security. This relates to French aspirations to play a more active geopolitical role and signals a strategic change in terms of employment toward a leaner but more focused army (République française, 2013, p. 128; Major, 2008; McLennan, 2020). Germany is percentagewise the smallest employer of the seven, with only 0.5% of its total labor force employed in the German army. In 2011, the country proceeded with a reorganisation of the services of the Federal Defence Ministry, resulting in 55,000 layoffs. The reorganisation also included the abolition of compulsory military service. As a result of the above, the personnel cost component declined still further in the following years, from 52.3% in 2011 to 45.2% in 2019. As did the size of German military personnel as a percentage of the country’s total labor force, from 0.60% in 2010 to 0.42% in 2018. When considering the percentage of the total labor force of each country represented by military personnel, as presented at Table 4, Italy leads by far, with 3% of its total labor force classified as military personnel.1 The 2015 White Paper acknowledged this problematic situation and initiated a rationalisation process intended to produce a leaner, more flexible, more effective army. In practical terms, this envisaged a reduction in both military personnel, especially in the upper echelons of the military hierarchy, and the auxiliary civilian bureaucracy (Gilli, Ungaro, & Marrone, 2015). These three countries are followed by Greece and Portugal. Greece has a sizable army due to the security challenges it faces. It should come as no surprise, therefore, that, as mentioned above, almost three fourths of the defence budget is spent on personnel costs, including the operational costs of the nation’s compulsory military service. During the period of fiscal austerity and budget consolidation, new hiring was only possible on very strict terms, and this, coupled with many early retirements, led to a substantial decrease in the number of people employed in the armed forces as a percentage of the total labor force (from 1.20% in 2008 to 1% in 2018). Portugal also went through a process of budget consolidation, including structural reforms in 2013, which impacted on the size of its army. According to NATO data on military personnel, the number of people employed by the Portuguese armed forces has fallen from 43,000 in 2010 to 28,600 in 2019 (NATO, 2021; NATO, 2018). However, this reduction has not had a significant effect on this budget line as a percentage of overall defence budget, with Portugal remaining at the top of the list for almost all the years under consideration. Only in the last couple of years has a downwards trend been evident which could be indicative of the reforms’ eventual success. 1 Italy has two law enforcement agencies with military features: the Carabinieri, which is the fourth branch of the Italian Armed Forces, patrol the interior in coοperation with the police and are usually deployed in military operations abroad (Lutterbeck, 2013, pp. 24-26), and the Guardia di Finanza, whose duties are related to financial crimes, but is also entrusted with naval military tasks (Lioe, 2010, p. 70). Therefore, the high number of military personnel may not fully reflect the actual Italian military.
ELIAMEP                                      Policy Paper #73/2021                                        p. 16
The ‘Magnificent Seven’ of European Defence Integration

Spain and Poland come next, at approximately 1.5%. Spain has also engaged in recent years in a
process of personnel rationalisation, with salary cuts of up to 5% and thousands of layoffs within the
armed forces during the Spanish financial crisis, and especially in 2011 (Valasek, 2011; European
Parliament - DG External Policies, 2011). Poland abolished compulsory military service in 2008, which
lowered both its operational costs and the percentage of the labor force employed by the army. The
preparations for and establishment of a new corps, the Territorial Defence Forces, in 2016, with an
estimated 35,000 troops in its ranks, boosted personnel expenditure from 42% in 2015 to 50% in
2017 (Chadwick, 2016; Michta, 2020).

Table 4: Military personnel as percentage of total labor force (2006–2018)

                  EU-27
    Year                      France        Germany         Greece           Italy     Poland    Portugal          Spain
                  Army
    2006          1.11%          1.01%         0.59%         1.22%       3.19%         1.80%       0.85%           1.64%
    2007          1.08%          0.99%         0.58%         1.21%       3.20%         1.79%       0.82%           1.64%
    2008          1.07%          0.97%         0.58%         1.20%       3.21%         1.76%       0.81%           1.64%
    2009          0.98%          0.95%         0.60%         1.15%       2.83%         1.33%       0.68%           1.66%
    2010          0.99%          0.95%         0.60%         1.15%       2.97%         1.47%       0.67%           1.65%
    2011          0.95%          0.92%         0.47%         1.12%       2.98%         1.50%       0.65%           1.66%
    2012          0.96%          0.91%         0.45%         1.09%       2.98%         1.44%       0.95%           1.68%
    2013          0.94%          0.91%         0.43%         1.06%       3.04%         1.43%       0.95%           1.51%
    2014          0.94%          0.86%         0.42%         1.04%       3.04%         1.40%       0.94%           1.49%
    2015          0.93%          0.86%         0.42%         1.02%       3.05%         1.40%       0.94%           1.41%
    2016          0.92%          0.86%         0.42%         1.01%       3.01%         1.38%       0.97%           1.43%
    2017          0.89%          0.85%         0.42%         1.01%       3.03%         1.34%       1.04%           0.99%
    2018          0.89%          0.85%         0.42%         1.00%       3.08%         1.31%       1.07%           0.99%
  AVERAGE         0.97%          0.91%         0.49%         1.10%       3.05%         1.49%      0.87%            1.49%
                                                  Source: IISS, 2019

           Graph IV: Military personnel as a percentage of the total labor force (2006–2018)
  3.5%
  3.0%
  2.5%
  2.0%
  1.5%
  1.0%
  0.5%
  0.0%
           2006   2007    2008       2009   2010    2011    2012      2013      2014    2015    2016   2017        2018

                             EU-27 Army        France              Germany             Greece
                             Italy             Poland              Portugal            Spain

                                                   Source: IISS, 2019
ELIAMEP Policy Paper #73/2021 p. 17 The ‘Magnificent Seven’ of European Defence Integration 2.3.2 Equipment and Infrastructure Table 5 offers a joint overview of equipment and infrastructure expenditure as a percentage of the total military expenditure of the seven countries. In most cases, these two categories go hand in hand because major equipment is stored, maintained and repaired in military bases, buildings and/or permanent installations. In addition, it is obvious that aircrafts need runways to take off and land and a strong navy requires appropriate port installations to meet its operational needs. For these reasons, we present and discuss them together. France is the country that invests the most on military equipment, followed by Poland and, to a lesser extent, Spain. Greece, Italy and Portugal have a significantly lower average, which is the mirror image of their high expenditure on military personnel discussed in the previous section.
ELIAMEP                                      Policy Paper #73/2021                                         p. 18
              The ‘Magnificent Seven’ of European Defence Integration

 Year               France                       Germany                       Greece                            Italy                        Poland                       Portugal                        Spain
          Equipment   Infrastructure   Equipment    Infrastructure   Equipment      Infrastructure   Equipment     Infrastructure   Equipment   Infrastructure   Equipment    Infrastructure   Equipment     Infrastructure

 2006      22.80%            3.70%      15.00%         3.60%          14.90%            1.00%          7.20%             0.60%       18.20%            3.80%       8.90%          1.80%         21.70%             2.80%
 2007      21.40%            3.90%      14.60%         4.10%          10.50%            0.40%         14.00%             1.00%       18.60%            5.00%       8.40%          0.70%         20.80%             2.90%
 2008      21.00%            3.70%      17.10%         4.10%          16.40%            0.40%         12.70%             1.60%       13.90%            4.70%      13.50%          0.90%         21.40%             1.90%
 2009      26.98%            2.17%      17.56%         4.75%          27.75%            0.84%         11.33%             1.45%       15.88%            4.98%       8.75%          0.80%         17.39%             2.26%
 2010      30.20%            3.13%      17.59%         5.16%          17.98%            0.76%         10.92%             1.40%       18.13%            3.96%      13.20%          0.43%         12.10%             1.25%
 2011      28.17%            2.68%      16.41%         4.13%           5.86%            1.26%         11.74%             1.31%       16.13%            4.80%      12.07%          0.01%          6.74%             1.88%
 2012      30.58%            3.42%      16.45%         3.53%           7.47%            0.79%          8.87%             1.02%       15.16%            4.76%       9.34%          0.04%         22.86%             0.85%
 2013      28.56%            2.30%      12.74%         3.55%          12.06%            0.63%         12.51%             1.57%       13.90%            5.62%       8.65%          0.04%         12.37%             0.67%
 2014      24.64%            2.33%      12.94%         3.75%           8.17%            1.10%         10.92%             1.40%       18.84%            5.47%       8.43%          0.11%         13.49%             0.66%
 2015      25.04%            2.80%      11.93%         3.60%          10.40%            0.65%          9.72%             1.30%       33.20%            4.74%       8.70%          0.25%         14.82%             0.97%
 2016      24.44%            2.70%      12.21%         3.39%          13.45%            0.58%         19.09%             0.70%       21.62%            4.62%       9.95%          0.06%          6.65%             0.97%
 2017      24.17%            2.88%      11.77%         4.06%          11.28%            0.79%         20.68%             0.94%       22.04%            4.21%      11.42%          0.03%         20.39%             0.68%
 2018      23.66%            3.51%      12.36%         4.15%          11.03%            0.62%         19.13%             1.29%       27.51%            3.45%      15.48%          0.05%         21.83%             0.64%
 2019      24.50%            3.12%      14.69%         3.99%          12.51%            0.66%         17.00%             0.67%       23.24%            3.68%      16.61%          0.11%         21.02%             0.98%
AVERAGE    25.44%            3.02%      14.53%         3.99%          12.84%            0.75%         13.27%             1.16%       19.74%            4.56%      10.96%          0.38%         16.68%             1.39%
                                       Table 5: Expenditure on equipment and infrastructure as a percentage of total military expenditure, 2006–2019

                                                                                    Source: ΝΑΤΟ 2011, 2012, 2016, 2018, 2021
ELIAMEP Policy Paper #73/2021 p. 19
The ‘Magnificent Seven’ of European Defence Integration
Graph V: Expenditure on equipment as a percentage of total military expenditure, 2006–2019
35%
30%
25%
20%
15%
10%
5%
0%
2006 2007 2008 2009 2010 2011 2012 2013 2014 2015 2016 2017 2018 2019
France Germany Greece Italy Poland Portugal Spain
Source: ΝΑΤΟ 2011, 2012, 2016, 2018, 2021
Graph VI: Expenditure on infrastructure as a percentage of total military expenditure, 2006–2019
6%
5%
4%
3%
2%
1%
0%
2006 2007 2008 2009 2010 2011 2012 2013 2014 2015 2016 2017 2018 2019
France Germany Greece Italy Poland Portugal Spain
Source: ΝΑΤΟ 2011, 2012, 2016, 2018, 2021
For France, investment in equipment and infrastructure is considered indispensable if its military
strength is to be maintained and appropriately projected (Ministère des Armées, 2018). The military
planning law for the period 2019–2025 envisages the upgrading of the Armed Forces’ conventionalELIAMEP Policy Paper #73/2021 p. 20 The ‘Magnificent Seven’ of European Defence Integration equipment, new nuclear submarines and frigates, new aircraft, the upgrading of the nuclear arsenal, and a significant increase in defence research and development. In general, the military expenditure on both purchasing new and maintaining existing equipment is expected to increase by more than a third between 2017 and 2025 (Mentz, 2019). Germany’s equipment expenditure puts the country in fourth place behind France, Poland and Spain. This modest performance is due to two main reasons: firstly, Germany is still reluctant to invest in military equipment (Buras, 2018). Secondly, the Bundeswehr is bogged down by severe bureaucratic inertia and outdated procurement systems that discourage large-scale modernisation plans, which would lead in turn to a significant demand for smarter and more efficient military equipment (Barrie & Giegerich, 2020). This is acknowledged in several parliamentary reports that have repeatedly noted that the identified bureaucratisation has a negative impact on the effectiveness of the German Armed Forces (German Bundestag, 2019; German Bundestag, 2020). Infrastructure expenditure is higher than in the other countries under examination because Germany has invested in NATO- related construction and infrastructure projects and installations used mainly by American troops stationed in Germany (Winter, 2019). In the case of Italy, the 2012 defence sector reforms and, still more significantly, the 2015 White Paper paved the way for the modernisation of the Italian army, placing an emphasis on equipment, maintenance, and military research and development. The procurement of new equipment was prioritized, which led to the significant increase in this budget line from 10% in 2015 to 17% in 2019 (Sabatino, 2017). Lately, the Italian government has shown great interest in the Coordinated Annual Review on Defence (CARD), European Defence Fund (EDF), and the Permanent Structure Cooperation (PESCO)counting on their co-financing potential to achieve a further upgrade of the national defence capabilities (Muti & Varvelli, 2021). The equipment expenditure of Spain is characterized by significant peaks and valleys, which are very much associated with the country’s financial crisis. Spending reached its nadir in 2011 and again in 2016, when it absorbed less than 7% of the defence budget, which is far below the Spanish average. Between 2010 and 2016, the main defence budget cuts were felt in the procurement of new and the modernisation of existing equipment (Ortega, 2012). The two programs most affected by these cuts were the Leopard II tank and the EF-2000 fighter jet (European Parliament - DG External Policies, 2011, p. 26). During this period, the national shipbuilding company Navantia had to reduce its running costs by 30% (European Parliament - DG External Policies, 2011). The same holds for Portugal which had to postpone payments to arm suppliers due to the economic crisis, and freeze or suspend some programs that were already underway, including the NH90 helicopter and PANDUR II 8/8 armored vehicle (Teixeira & Pinto, 2014, p. 4). Greece’s expenditure on equipment suffered a heavy blow during the financial crisis. Due to budget cuts, expenditure on equipment dropped from 27% in 2009 to 8% in 2014; in practice, this meant the halting of almost all armament projects. The domestic defence industry, which had historically faced a wide range of problems, struggled hard to survive, though not with much success (Slijper, 2013, p. 13). In the post-2015 era, expenditure on equipment rose a little without reaching pre-crisis level. However, it is important to note that the country launched a massive rearmament plan in 2020 worth 10 billion euros. This plan entails the purchase of new anti-tank weapons for the Greek army,
ELIAMEP                                      Policy Paper #73/2021                                    p. 21
The ‘Magnificent Seven’ of European Defence Integration

Rafale fighter jets from France for the Hellenic Air Force, and new frigates for the Hellenic Navy. This
program, which will be implemented over the next decade, will significantly increase the share of this
budget line in the country’s overall defence budget.

Poland’s expenditure on military equipment shows a remarkable increase. There are two main
reasons for this. The first relates to the need to modernize much of its Soviet-era arsenal, which had
become essentially obsolete by the turn of the millennium. The second relates to politics since th
political semantics of this modernisation program are hard to miss. Poland portrays itself as the star
pupil in the Central and Eastern European class and is engaged in an ongoing attempt to meet all
NATO guidelines (defence budget equivalent to 2% of GDP with 20% of the budget spent on military
equipment). These efforts took the form of two large-scale projects, namely the 2001–2006
‘Program of Restructuring       and     Technical   Modernisation     of    the    Armed      Forces of
the Republic of Poland’ and its 2015 update. The former legally obliged the Polish government to
spend 1.95% of the country’s GDP on defence and at least 20% of this expenditure on technical
modernisation. The latter restated this legally binding commitment, which brings Poland very close
to the NATO threshold. Poland purchased significant amounts of military equipment from Germany
in the period 2013–15 and from the United States, in 2018 and 2020 (Świerczyński, 2018; U.S.
Embassy & Consulate in Poland, 2020).2 As regards its infrastructure expenditure, the construction of
NATO bases in Poland accounts for the size of this budget line in the Polish defence budget (Feickert,
McInnis, & Mix, 2020). In a 2018 proposal, the Polish Ministry of Defence suggested that Poland
could develop the necessary infrastructure to house an even larger permanent US military presence
(Polish Ministry of Defence, 2018). This is illustrative of Poland’s intention to ‘purchase’ more
security by hosting American and NATO forces in its territory and shouldering the related financial
burden.

2.3.3 ‘Other Functions’

Table 6 provides information on the seven member-states’ expenditure on ‘other functions’, which
include the costs for operations, maintenance, other R&D and other categories. A quick look reveals
that Germany spends an impressive thirty percent of its military expenditure on average on other
functions, followed by Poland, France, and Spain, which allot roughly twenty percent for these
purposes. Greece, Italy, and Portugal form a third group for whom other costs do not account for
more than fifteen percent of their defence budgets.

2
  Poland purchased 105 Leopard 2A5 main battle tanks, 14 Leopard 1A4 main battle tanks, 18 Bergepanzer 2 armored
recovery vehicles, 200 trucks and peripheral material from Germany, worth 180 million euros in total. The 2018 and 2020
purchases from the US consisted of the US Patriot Missile System (from the Raytheon Company in 2018) and aircraft (from
Lockheed Martin in 2020) (Świerczyński, 2018; U.S. Embassy & Consulate in Poland, 2020).
ELIAMEP                                      Policy Paper #73/2021                                               p. 22
The ‘Magnificent Seven’ of European Defence Integration

Table 6: Expenditure on other functions as a percentage of total military expenditure, 2006–2019

       Year              France       Germany                Greece             Italy        Poland    Portugal           Spain
       2006          16.20%            24.30%                10.20%            10.30%        24.20%    13.10%         22.00%
       2007          17.50%            26.50%                9.60%             12.20%        22.00%    12.20%         23.30%
       2008          17.90%            24.90%                9.10%             14.90%        18.20%    13.90%         22.90%
       2009          21.51%            24.49%                14.88%            13.33%        18.06%    15.14%         21.68%
       2010          19.03%            24.58%                16.19%            12.60%        21.12%    16.19%         23.26%
       2011          19.80%            27.17%                16.84%            12.17%        21.27%     9.62%         26.58%
       2012          16.89%            29.42%                18.55%            13.06%        22.73%    12.22%         19.11%
       2013          19.91%            33.84%                12.75%            10.93%        22.78%    11.46%         18.71%
       2014          24.43%            32.63%                13.55%            11.27%        24.24%    10.19%         18.50%
       2015          24.37%            34.61%                16.90%            11.42%        20.11%     9.15%         19.03%
       2016          24.92%            36.05%                12.84%            9.42%         26.61%     8.61%         19.78%
       2017          24.97%            35.20%                11.37%            10.80%        23.71%     8.35%         17.28%
       2018          25.92%            35.49%                9.60%             11.43%        22.89%     9.72%         17.89%
       2019          26.57%            36.06%                9.96%             12.11%        24.65%    11.60%         16.14%
   AVERAGE           21.42%            30.37%                13.02%            11.85%        22.33%    11.53%         20.44%
                                            Source: ΝΑΤΟ 2011, 2012, 2016, 2018, 2021

Graph VII: Expenditure on other functions as a percentage of total military expenditure, 2006–2019

 40%

 35%

 30%

 25%

 20%

 15%

 10%

  5%

  0%
         2006     2007      2008    2009     2010    2011     2012      2013    2014    2015    2016   2017   2018        2019

                France            Germany           Greece            Italy         Poland        Portugal         Spain

                                            Source: ΝΑΤΟ 2011, 2012, 2016, 2018, 2021
You can also read