The Moderating Effect of Family Business Ownership on the Relationship between Short-Selling Mechanism and Firm Value for Listed Companies in ...
←
→
Page content transcription
If your browser does not render page correctly, please read the page content below
Journal of
               Risk and Financial
               Management

Article
The Moderating Effect of Family Business Ownership on the
Relationship between Short-Selling Mechanism and Firm Value
for Listed Companies in China
Wenzhen Mai * and Nik Intan Norhan Binti Abdul Hamid

                                          Azman Hashim International Business School, Universiti Teknologi Malaysia, Johor Bahru 81310, Malaysia;
                                          m-norhan@utm.my
                                          * Correspondence: wenzhen@graduate.utm.my

                                          Abstract: This study demonstrates an investigation of the external corporate governance effect of
                                          short selling mechanisms on firm value in the Chinese context. The effect of family businesses is also
                                          examined as a moderator of the relationship between short-selling and firm value. Using panel data
                                          analysis of Chinese listed companies, this paper tests a total sample of 22,468 firm-year observations
                                          from the Shanghai and Shenzhen Stock Exchange from 2009 to 2019 by applying the PSM-DID
                                          method in order to mitigate self-selection and endogenous problems caused by the uniqueness of
                                          Chinese short selling mechanisms. The findings suggest that both deregulation and the propensity
                                          of short selling can improve the firm value. Our findings also established that family ownership
                                weakens firm value with the availability of short-selling, which indicates that family businesses have

                                          long orientations and conduct better corporate governance practices than non-family business, as
Citation: Mai, Wenzhen, and Nik
                                          short-selling shows a weaker external governance effect on firm value creation by family businesses
Intan Norhan Binti Abdul Hamid.
                                          in China. A robust test of alternative measurements is conducted and validated. This study provides
2021. The Moderating Effect of
                                          significant insights for policymakers to consider in order to further relax short-selling constraints,
Family Business Ownership on the
Relationship between Short-Selling
                                          which can act as effective external governance for better firm value creation, especially for non-family
Mechanism and Firm Value for Listed       businesses in developing countries.
Companies in China. Journal of Risk
and Financial Management 14: 236.         Keywords: short-selling; family ownership; firm value
https://doi.org/10.3390/jrfm14060236

Academic Editors: Khaled Hussainey
and Shawkat Hammoudeh                     1. Introduction
                                                The significance of short-selling has been documented in the extensive and varied
Received: 30 January 2021
                                          literature that investigates the effectiveness of short-sellers’ supervisory and monitoring
Accepted: 19 May 2021
                                          role on firm performance and value creation. Short sellers, as compared to ordinary
Published: 25 May 2021
                                          individual investors, are more experienced traders with advanced information processing
                                          skills to uncover and profit from negative news of companies that otherwise might remain
Publisher’s Note: MDPI stays neutral
                                          hidden (Massa et al. 2015). Scholars have previously focused on developed countries, but
with regard to jurisdictional claims in
                                          more research about short selling has been conducted in emerging markets such as China
published maps and institutional affil-
iations.
                                          (Cai and Guo 2018; Chen et al. 2016; Chen et al. 2020a; Jiang and Chen 2019; Mai and Hamid
                                          2021a; Meng et al. 2017; Zou et al. 2021). China provides a critical point of discussion in the
                                          capital market and business management because of its unique cultural and social values
                                          and a strong sense of hierarchical structure for family networks and businesses.
                                                The Chinese financial regulatory board has loosened its stock of short selling restric-
Copyright: © 2021 by the authors.
                                          tions since March 2010. This transformative reform to the capital market has brought about
Licensee MDPI, Basel, Switzerland.
                                          a breakthrough in China’s A-share market, ending a history of the unilateral trading market
This article is an open access article
                                          for over 20 years. The loosening of short selling rules is encouraged through the gradual
distributed under the terms and
                                          expansion of underlying stocks. For the first phase of deregulation implementation, 90 com-
conditions of the Creative Commons
Attribution (CC BY) license (https://
                                          panies were selected in the list of shortable stocks by the Shanghai and Shenzhen Stock
creativecommons.org/licenses/by/
                                          Exchanges. By December 2019, the implementation of short-selling business in both stock
4.0/).                                    markets has grown exponentially, and qualified investors could short 1600 companies with

J. Risk Financial Manag. 2021, 14, 236. https://doi.org/10.3390/jrfm14060236                                   https://www.mdpi.com/journal/jrfm
J. Risk Financial Manag. 2021, 14, 236 2 of 20
shorting positions exceeding 290 billion yuan in 2019, according to reported short-selling
data from Shanghai and Shenzhen Stock Exchange official websites. The securities lending
business has rapidly developed in China, so it is crucial to understand the implications of
short selling activities on the firm’s financial and management performance.
With the rapidly increasing trend in research on short selling, the existing literature has
shown that short selling has significant deterrent and monitoring implications for financial
management by the function of post-factum price discovery, which limits abusive, ex-
ante management opportunistic misbehaviors (Hughes-Morgan and Ferrier 2017; Li 2018;
Lu 2018; Mai and Hamid 2020). Brockman et al. (2020) and Liu et al. (2019) confirmed
that managers of companies would increase the firm operating performance due to the
threat of short selling to avoid being accused of giving an excessive compensation pack-
age. Scholars also demonstrated that the short-selling mechanism is also a motivator
for corporate innovation, referring to its quality and quantity by enhancing innovation
transparency among firms and optimizing their top managers’ compensation efficiency
(He and Tian 2018; Li et al. 2019). While the above literature provides insights for the de-
terminants of superior management affected by short selling, the influence of short selling
control relaxation on firm value creation by reducing the company’s agency problems is
still unknown. Hence, this research conducted an empirical examination of the relationship
of short selling deregulation and firm value of listed companies.
Moreover, this study considers the uniqueness of the context of Chinese business.
Like other Asian countries, the characteristics of the Chinese private business’s ownership
identity are mostly family-owned, which largely mitigate the problems incurred by state-
owned companies (Yang et al. 2020). Based on previous research in developed countries,
businesses with high family ownership tend to mitigate Type I agency problems with
appropriate management involvement by family members (Miroshnychenko et al. 2020;
Tseng 2020). In comparison, family businesses imply a different dimension of conflicts of
interest between the family owner and minor shareholders, as family owners have the incen-
tive to pursue family interests at the expense of minority shareholders (Pittino et al. 2020;
Swanpitak et al. 2020b), which is known as a Type II agency problem. Gao et al. (2020)
further analyzed that the unfavorable environment for institutions and weak protection in
rules and law for minor shareholders’ protection induces family owners to be involved
in activities benefiting their private interests. For understanding family ownership in the
Chinese business context, this study attempts to investigate how family ownership can
moderate the relationship between short selling and firm value for listed family companies
in China.
The main contributions of this paper are presented as follows. First, from the de-
terrence perspectives, short selling can prevent management misbehaviors and mitigate
agency problem, although the effectiveness of short selling on firm creation remains un-
known. This research further expands the existing literature to directly examine how the
deregulation of short selling in China affects firm value creation by assessing the Tobin’s
Q and ROA of listed companies as measurements. Second, as most private businesses in
China are family-owned, this research further considers family ownership as a moderat-
ing effect in order to examine whether this deregulation of short-selling mechanisms can
work better for family businesses than other ownership identities. Lastly, Li et al. (2017)
mentioned that the list of short selling deregulation only includes selected stocks rather
than all stocks, which may lead to self-selection problems. Aiming to establish the reli-
ability of empirical results, this paper will conduct propensity score matching (PSM) to
compare shortable and non-shortable firms by mitigating the problem of endogeneity and
self-selection and apply the difference-in-differences (DID) approach in examining the
pure effect of deregulation of short selling on firm value for the listed family businesses
in China.
This paper’s succeeding sections begin with a literature review, which presents the
theoretical foundation and hypotheses development of this research. The methodology
section of this study extensively describes the data, methodology, and measures of variables.J. Risk Financial Manag. 2021, 14, 236 3 of 20
The results and discussion parts analyze the thorough findings of the empirical study and
conduct a robust test. The final part presents the conclusions, implications, and limitations
of this research.
2. Literature Review and Hypothesis Development
While China is experiencing rapid development as the second-largest economy glob-
ally, the remarkable growth of family businesses only appeared after the transition from
state-owned based economy to a socialist setting in 1992 (Cheng 2014). In this fledgeling
economic environment, family businesses have severe problems concerning concentrated
ownership (Yang et al. 2020), inadequate protection for minor shareholders and creditors
(Gao et al. 2020), and managerial myopia for innovation investment (Xiang et al. 2019).
One way to strengthen investor protection and reinforce governance mechanisms is to
involve other stakeholders because of the unique Chinese business environment, in which
short-sellers can supervise and punish misbehaviors of managers and family owners
(Gong 2020; Massa et al. 2015).
2.1. Short Selling Mechanism
Two attributes are primarily expressed in determining the effects of short selling. The
first aspect is that short selling acted as external governance to alleviate agency costs and
promote its value (Mai and Hamid 2020). The second feature is that short selling provides
pessimistic public traders with the opportunity to invest in the stock market, leading to
reduced share prices and financial performance (Chen et al. 2020a). However, these two
attributes of short selling are contradictory, which leads to a non-consensus about its effects
on firm value creation.
Following the theory of external governance, short selling activities stimulate the
detection of negative information from companies and increase the cost of seeking private
benefits by managers, which can benefit from restricting their unethical behaviors and
being cautious of moral hazards (Brockman et al. 2020; Chen et al. 2020b; Li et al. 2019; Mai
and Hamid 2020; Rennekamp et al. 2019). For example, Chen et al. (2020b) suggested that
relaxing short-selling constraints can help to reduce the risk of companies facing agency
problems and information opaque, lower the borrowing costs of business loans and increase
firm value, because the potential adverse effect on stock prices adds pressure on the man-
agers of companies to act as external supervisors of the corporate governance mechanism.
Brockman et al. (2020) presented empirical results from the US under Regulation SHO
and stated that an increased threat of short selling could significantly improve employee
relations because short-sellers may aim to short-sell stocks of firms with employee-related
negative publicity. Besides, firms with a higher level of earnings manipulation, probability
of labor disputes and employee whistle-blowing, and reduced workplace concerns are
the targets for short-sellers. To alleviate the threats of short-sellers, companies experience
better stock performance during the post Reg-SHO period.
However, only a few studies directly measure how short selling deregulation affect
firm value. While short selling can act as external governance, it is still unknown whether
its effect can positively improve firm value. Mai and Hamid (2020) specifically researched
the effects of short selling on firm value in the Pharmaceutical Industry in China. They
indicated that the appearance of short selling plays a deterrent role in corporate policies
so that shortable firms engage in fewer earnings management and more productive R&D
investments. In addition, Mai and Hamid (2021b) further analyzed the tourism indus-
try and found that short-selling can improve corporate social responsibility. However,
Ni and Yin (2020) criticized that companies have weaker short-run and long-run financial
performance after the removal of short-sale bans. Additionally, shortable companies un-
dertake less risk and suffer worse profitability because these companies reduce capital
expenditures, cut innovation investment, and decrease external financing in the light of
increasing short-selling threats.J. Risk Financial Manag. 2021, 14, 236 4 of 20
Overall, this paper is inclined to hypothesize that short selling deregulation can
improve firm value by alleviating agency cost, compliance cost, and management myopia
and misconducts. Therefore, the hypotheses are examined as bellow:
Hypothesis 1 (H1). There is a positive relationship between short-selling deregulation and Tobin’s Q.
Hypothesis 2 (H2). There is a positive relationship between short-selling deregulation and ROA.
Based on the viewpoint of the information detective theory, the literature demon-
strated that short-sellers have superior experience and skills in collecting and analyzing
public and private information compared to ordinary investors. In effect, a high vol-
ume of short selling trading offers vital signs of unfavorable risk events of the company
and the predictable underperformance of the underlying stock price (Massa et al. 2015).
Meng et al. (2017) further confirmed this analysis with Chinese evidence from 2010 to 2014
and stated that short-sellers have similar analyzing abilities and skills as financial analysts.
Gao et al. (2018) considered the US examples and found that company insiders, such as
senior managers, will take advantage of short-sellers’ shorting position information to
sell their shares, indicating the short-sellers are even more informative than insiders of
companies. Zhou et al. (2019) reviewed the short-selling data and earning reports for listed
Chinese companies from 2013 to 2016 and empirically showed that short sellers started
their shorting positions just before the negative earnings report disclosure, indicating the
short sellers are informed and skillful traders in detecting and predicting negative events
of companies. Additionally, Chen et al. (2020b) also studied China’s context before and
after the 2014 short-selling ban lifting for 205 stocks and confirmed the above analysis
of the prediction ability of skillful short sellers on the stock price efficiency, which im-
plied that short-selling influences market liquidity and asymmetry of information, thereby
strengthening price efficiency.
The above literature review stated that short sellers are informed investors who can
detect negative information regarding companies. In contrast, corporate executives notice
the accumulated short-selling positions on their stocks. Thus, they may correct their
misbehaviors and announce positive hidden information to defend their stock price, which
would eventually improve the stock price and firm value. Therefore, the hypotheses are
postulated as bellow:
Hypothesis 3 (H3). There is a positive relationship between short-selling propensity and Tobin’s Q.
Hypothesis 4 (H4). There is a positive relationship between short-selling propensity and ROA.
2.2. Family Business
Most of the listed private companies in China are governed by an individual share-
holder or his family group (Cheng 2014; Ramos et al. 2016). However, there is no consensus
about whether a family business has a premium as an ownership identity to improve the
companies’ firm value. The characteristics of family business can be classified into two
broad categories: ‘competitive advantage’ and ‘private benefits wedge’ (Villalonga and
Amit 2010). The competitive advantage hypothesis states that family ownership fosters
value maximization for both family and minor shareholders (Aguiar-Inmaculada Diaz and
Trujillo 2020). Under the personal benefits of the wedge hypothesis, family ownership is
deeply entrenched because the family’s priorities are maximized at other stakeholders’
expense (Abrardi and Rondi 2020). The critical difference lies in which group of share-
holders gains the highest value from the corporation. Zhu and Lu (2020) investigated the
effect of family ownership on corporate environmental responsibility. Their results showed
that concentrated family ownership leads to lower corporate environmental responsibility,
but the negative relationship is reversed when venture capital investment comes from
developed markets.J. Risk Financial Manag. 2021, 14, 236 5 of 20
From the competitive advantage perspective, the literature has demonstrated that the
Type-I agency problem, the conflict of interests between shareholders and managers, can
be mitigated by close supervision on managers by family owners or even a family CEO.
Tseng (2020) attempts to find the linkage of family business’ long-term orientation and
its SG&A expenditures by studying family firms for 11 years in the US. He hypothesized
that firm value would be enhanced if SG&A expenditures are aimed for the long-term
purpose of family firms. The results confirmed that, compared to non-family businesses,
higher family-related ownership would positively influence innovation performance and
branding management for long-lasting orientation. As a result, the Type-I agency problem
is mitigated in this research, while the Type-II problem is also lessened with the align-
ment of interests of family members and other minor shareholders. By comparing family
business, state-owned firms, and diverse-owned business in Europe from 2002 to 2011,
Miroshnychenko et al. (2020) investigated how ownership structure can affect innovation
inputs, combined with growth opportunities measured by Tobin’s Q. They found that
family ownership is more favorable for innovation investments with the moderating ef-
fect of growth opportunities than other ownership structures. Aguiar-Inmaculada Diaz
and Trujillo (2020) studied Spanish family firms in the port industry. They found that
concentrated family ownership can be constructive to corporate profitability measured by
ROA, which is explained as confiscating behaviors practiced by the dominant shareholder
in a concentrated family business because of a lack of minor shareholders. Their further
research also found that the financial performance of firms in the hands of the subsequent
generation of family members is more potent than that of the first-generation, indicating the
diverse and professional knowledge of the next generations of family member involvement
in management can contribute more to corporate profitability. The results of a study by
Koji et al. (2020) showed that, when univariate analysis is used, family firms perform
better than their non-family counterparts in terms of the return of assets (ROA) and Tobin’s
Q. Moreover, while using multivariate analysis, family firms show better performance
than non-family firms with Tobin’s Q. Consistent with this outcome, Ntoung et al. (2020)
presented that family-owned companies have smaller financial structures than non-family-
owned firms. As a result, most family-owned companies use less debt financing than
non-family firms and maintain a lower level of debt.
However, from the perspective of personal benefits, family ownership enlarges the
gap between family owners and minor shareholders as family owners may sacrifice the
interests of the minority when necessary. Swanpitak et al. (2020b) found that family
ownership in Thailand is harmful to the stock price when the society experienced unrest
during the political change in 2014, which indicates that investors may discount the
firm value of the family business for the bad reputation as corruption is deemed serious
among family owners and politicians. As a result, the cost of high family ownership
outweighed other benefits from the monitoring role of family members when the political
crisis happened. By reviewing the relationship between family ownership and the financial
performance of listed firms in Italy in 2000–2017, Abrardi and Rondi (2020) revealed that
both concentrated ownership of family or family member as senior managers could not
consummate premium on firm accounting performance. Contrary to the results of Aguiar-
Inmaculada Diaz and Trujillo (2020) in Spain, the effect on stock price growth is consistent
with the value-discounted theory mentioned by Swanpitak et al. (2020b). They explained
that the excessive power of the controlling family and their senior family manager could
destroy the firm value even with sufficient efforts on corporate governance.
The family business is also unique under the view of creditors who may offer favorable
or unfriendly credit policy. By studying family businesses in Thailand, Swanpitak et al.
(2020a) attempted to examine the influence of family ownership on creditors’ trust by
representing how family businesses can solve Type-III agency problems. The results
reflected a positive relationship between the high percentage of family ownership and
the cost of debt because family owners tend to achieve long-term success and invest in
lower-risk projects that are preferable to creditors. Additionally, intensive ownership ofJ. Risk Financial Manag. 2021, 14, 236 6 of 20
the family business can act as a supervisor for daily management involvement and enjoy
higher profitability, which is also a channel for explaining the low cost of debt compared
to non-family firms. Ergün and Doruk (2020) confirmed that family businesses have
unique resources or attractions from creditors when acquiring external financing supports,
according to Turkish empirical evidence. By studying financial constraints confronting
both family business and non-family counterparts, the advantage of achieving financial
sources is significantly observable for firms controlled by well-developed family groups,
indicating that the family network is a vital social resource for firms to access support for
growth from outside stakeholders.
For the moderating effect of family ownership, Kamaludin et al. (2020) used family
ownership as moderating factors in the relationship between corporate governance and
firm value of Saudi Arabian listed companies from 2012 to 2016. Surprisingly, the higher fre-
quency and attendance of audit committee meetings are detrimental for the financial value
of family firms measured by Tobin’s Q, suggesting that auditing diligence in Saudi Arabia
may not improve firm value. Hamid et al. (2020) demonstrated that family ownership
moderated the effects of cash management and corporate governance on firm perfor-
mance by studying 317 Pakistan-listed firms for 2010–2019, indicating that cash manage-
ment is negatively associated with firm performance, especially among family businesses.
Cordeiro et al. (2020) also examined the moderating role of the family business on the links
between gender-diverse boards and firm value for stakeholders. Their findings suggest
that gender-diverse boards are strongly associated with environmental value creation, in
which their relationship is strengthened with the moderating effect of family ownership.
Female directors display a pro-environmental stance, though family ownership leads them
to focus on environmental stakeholders generally.
In China, Cheng (2014) reviewed the overall performance of family business perfor-
mance and found that Chinese family owners have a substantial privilege in voting rights
among the board, which can also decide the company’s cash flow decision-making. With
decision-making convenience, family owners are motivated to possess corporate resources
at the opportunity cost of minority shareholders. Besides, the Chinese capital markets are
characterized by weak investor protection and legal environment and a lack of supervision
by other market stakeholders, which also induced the Type-II agency problem in Chinese
family businesses. However, Tang et al. (2017) empirically stated that family ownership
experienced better firm performance than non-family businesses by investigating listed
companies in China from 2003 to 2014. They confirmed that family businesses could
mitigate the Type-I agency problem due to lower compensation to management, lower cost
of information asymmetries, and less industry influence, leading to better performance.
According to the competitive advantage theory, the presence of family ownership
can alleviate agency costs and improve firm performance, while family ownership will
destroy firm value creation under the perspectives of private benefits (Villalonga and
Amit 2010). Nonetheless, minor shareholders will benefit from a short-selling mechanism
manifested by excellent monitoring and supervision and improved investment decision
and risk assessment by family owners. As most family businesses aim to retain and increase
their social and economic wealth through their business, this primary objective is consistent
with the competitive advantage perspectives. To achieve this objective, family owners
will choose family members to lead to management positions to alleviate the agency
problem and prioritize a conservative financing strategy to avoid risks and illiquidity
(Harith and Samujh 2020). Based on the above reviews, this paper tends to perceive that
family-owned businesses implement goal commitment aligned with the objectives of minor
shareholders and management. As the agency problems in Chinese businesses widely
existed and are challenging to solve due to the weak legal and economic protection for
investors, the family business is a solution to balance the interests of relevant parties. As
a result, a family business with better corporate governance practices in China is less
threatened by the external governance of short-selling. In effect, the relationship betweenJ. Risk Financial Manag. 2021, 14, x FOR PEER REVIEW
businesses widely existed and are challenging to solve due to the weak legal and eco
J. Risk Financial Manag. 2021, 14, 236 7 of 20
protection for investors, the family business is a solution to balance the interests o
vant parties. As a result, a family business with better corporate governance pract
China is less threatened by the external governance of short‐selling. In effect, the rel
ship
short-selling and thebetween short‐selling
firm value and the firm
of family business value of family
is weakened. business
Therefore, is weakened. Ther
the hypotheses
are outlined asthe hypotheses are outlined as follows:
follows:
Hypothesis
Hypothesis 5 (H5). Family 5business
(H5). Family business
weakens weakens the
the relationship relationship
between between the
the deregulation deregulation o
of short
selling and Tobin’s‐Q.
selling and Tobin’s-Q.
Hypothesis
Hypothesis 6 (H6). Family 6business
(H6). Family business
weakens weakens the
the relationship relationship
between between the
the deregulation deregulation o
of short
selling
selling and ROA. and ROA.
Hypothesis
Hypothesis 7 (H7). Family 7business
(H7). Family business
weakens weakens the
the relationship relationship
between between
short-selling short‐selling prop
propensity
and Tobin’s-Q. and Tobin’s‐Q.
Hypothesis 8 (H8). Family 8business
Hypothesis weakens
(H8). Family the relationship
business between
weakens the short-selling
relationship betweenpropensity
short‐selling prop
and ROA. and ROA.
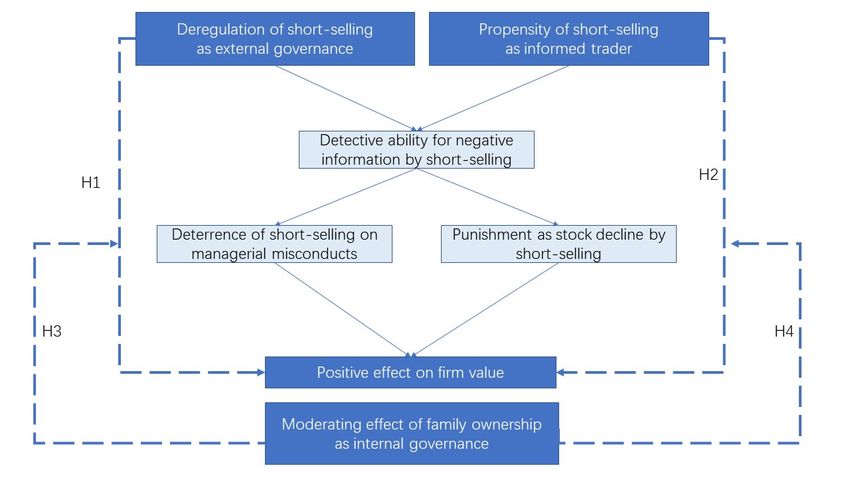
The hypotheses development
The hypothesesisdevelopment
constructed and demonstrated
is constructed and in Figure 1. in Figure 1.
demonstrated
Figure 1. Hypotheses development.
Figure 1. Hypotheses development.
3. Methodology
3. Methodology
3.1. Data and Sample Sources
3.1. Data and Sample Sources
This paper uses data from Chinese A-share listed firms from 2009 to 2019 as the scope
Thisof
of the sample. The data paper
shortuses datavolume
selling from Chinese A‐share
and financial listed
data are firms from
from the 2009Stock
China to 2019 as the
Market and Accounting Research Database (CSMAR). The short-sale list data is acquiredthe China
of the sample. The data of short selling volume and financial data are from
from Shenzhen Market and Accounting
and Shanghai Researchwebsites,
Stock Exchange Database while
(CSMAR). The short‐sale
the family ownership data is acq
list is
from
obtained from the Shenzhen
annual and
reports ofShanghai Stock Exchange
listed companies. We beginwebsites, while
the analysis in the
2009family
becauseownership
the first roundtained
of short from the annual
selling reports
ban lifting fromofMarch
listed 2010,
companies. We begin
so starting from the
2009analysis
ensuresin 2009 be
thestock
that no shortable first round of our
is left in short selling
scope bansample.
of the lifting from March 2010, so starting from 2009 en
Suggestedthat
by notheshortable
commonstock is left
practice in in our scopecountries
developed of the sample.
(Massa et al. 2015) and
Suggested by the common practice in developed
China (Chen et al. 2020a), financial firms, ST* firms, firms that were previously countries shortable,
(Massa et al. 2015
but later becameChina (Chen et al.and
non-shortable, 2020a),
firms financial firms, related
with missing ST* firms, firms thatare
information were previously sho
excluded
butThis
in this research. laterpaper
became non‐shortable,
winsorised and at
the data firms
1% with missing
and 99% related
levels information
to mitigate the are exc
effects of outliers. After the above process, we preliminarily obtained a sample of 22,468
firm-year observations, including 1405 firms in the shortable list and 1865 firms out of the
shortable list.J. Risk Financial Manag. 2021, 14, 236 8 of 20
3.2. Measurement of Variables and Models
This paper needs to measure both deregulation of short selling and the propensity of
short sales. Following Park (2017), (Lu 2018), and Mai and Hamid (2020), SHORT ∗ TREAT
is the variable to measure deregulation of short selling. SHORT is the variable, short
dummy, which is regarded as one if the stock is permitted to short during the sample
period, and zero otherwise. TREAT is the time dummy that equals 1 if the stock can be
shortable by the end of the current fiscal year, and zero otherwise. SHORT ∗ TREAT is
the interactive item for differences in the difference (DID) model that ensures that the
firm value of a firm captures all its activities over an entire fiscal year, either before or
after the exogenous shock. The interactive item SHORT ∗ TREAT and SHORT are used as
independent variables to observe the effect of short selling deregulation. Secondly, the
short interest ratio (SIR) is used to measure short selling propensity, which is calculated as
the number of stocks sold by short sellers minus the number of stocks repaid, divided by
the trading volume of the prior day. The average SIR during a year is adopted in this paper.
For measuring firm value, this paper employed Tobin’s-Q and ROA as indicators.
To identify the firm value in terms of the stock market, Tobin’s-Q is appropriate and is
calculated as the market value of total assets divided by the asset value. While accounting
for the financial value of the firm, ROA is adopted and calculated by the net income divided
by the total assets.
According to previous studies (Kamaludin et al. 2020; Mai and Hamid 2020; Xiang
et al. 2019), this paper adopts several sets of control variables to capture the fundamentals
of companies. For financial characteristics of companies, we use firm size (SIZE) measured
as a natural logarithm of the market capitalization, firm growth (GROWTH) calculated
as the sales growth, leverage (LEV) measured as total liability divided by total assets,
and R&D investment (RD) calculated as R&D expenditures divided by total expenses.
In addition to controlling the corporate governance level of firms in the regression, we
added board size (b-size) measured as the natural logarithm of the number of board
members and board independence (b-ind) calculated as independent directors divided by
the corporate board. To measure the identity of shareholders, we capture state-ownership
(SOE) and Institutional ownership (IO), which are dummy variables (0,1). If the largest
shareholder is the state or institution, then it is 1, otherwise it is 0. Year-effect (YEAR) and
firm-effect (FIRM) account for time and firm-specific conditions that could play a role in
the relationship between short-selling and firm value. Additionally, this paper uses robust
standard errors in all models and estimations, corrected for heteroscedasticity.
For Hypotheses 1 and 2, this paper examines whether deregulation of short selling
has a positive impact on firm value by using model 1 and model 2 below:
Tobin0 s Q = a0 + a1SHORT + a2SHORT ∗ TREAT + a3controls + a4FIRM + a5YEAR + ε (1)
ROA = a0 + a1SHORT + a2SHORT ∗ TREAT + a3controls + a4FIRM + a5YEAR + ε (2)
For Hypotheses 3 and 4, this paper examines whether propensity of short selling has
a negative impact on firm value by using model 3 and model 4 below:
Tobin0 s Q = a0 + a1SIR + a2controls + a3FIRM + a4YEAR + ε (3)
ROA = a0 + a1SIR + a2controls + a3FIRM + a4YEAR + ε (4)
When measuring family ownership, this paper adopts the insights of Leitterstorf
and Rau (2014) by defining family business as a type of business by which the founder
and his family possess more than 25% of this total ownership. This measurement is also
adopted by Zulfiqar et al. (2020) when they measured the family firms in China. Moreover,
Mustafa et al. (2020) also used family ownership as a dummy variable moderator (0,1)
where family firm was regarded as 1 and non-family firm is 0. In order to investigate the
moderating effect of family ownership between short selling and firm value, this paper
adopts an interactive item for DID model between the independent variables: deregulationJ. Risk Financial Manag. 2021, 14, 236 9 of 20
of short selling (SHORT ∗ TREAT) and short selling propensity (SIR), with the moderating
variable: family ownership (FO), namely SHORT ∗ TREAT × FO and SIR × FO.
For Hypotheses 5 and 6, this paper examines whether family ownership weakens the
relationship between the deregulation of short selling and firm value by using model 5 and
model 6 below:
Tobin0 s Q = a0 + a1SHORT + a2SHORT ∗ TREAT + a3SHORT ∗ TREAT ∗ FO
(5)
+ a4controls + a5FIRM+ a6YEAR + ε
ROA = a0 + a1SHORT + a2SHORT ∗ TREAT + a3SHORT ∗ TREAT ∗ FO+
(6)
a4controls + a5FIRM+ a6YEAR + ε
For Hypotheses 7 and 8, this paper examines whether family ownership weakens the
relationship between the deregulation of short selling and firm value by using model 7 and
model 8 below:
Tobin0 s Q = a0 + a1SIR + a2SIR∗ FO + a3controls + a4FIRM+ a5YEAR + ε (7)
ROA = a0 + a1SHORT + a2SHORT ∗ TREAT + a3SHORT ∗ TREAT ∗ FO
(8)
+ a4controls + a5FIRM+ a6YEAR + ε
This paper demonstrates the definitions of the main variables in Table 1.
Table 1. Description and measurement of variables.
Variables Measurement Sources
Independent Variables
A dummy variable (0,1), equals to 1 if the
Deregulation of short selling (SHORT) Shanghai and Shenzhen Stock exchange
firm is shortable, and 0 otherwise
A dummy variable (0,1), equals to 1 for the
Time factor of short selling (TREAT) years after firm is shortable, Shanghai and Shenzhen Stock exchange
and 0 otherwise.
SHORT*TREAT Interactive item of SHORT and TREAT Shanghai and Shenzhen Stock exchange
number of stocks sold by short-sellers
Short Interest (SIR) minus the number of stocks repaid, divided CSMAR Database
by trading volume of the prior day.
A dummy variable (0,1), equals 1 if the firm
is family-owned, and 0 otherwise; Family
Family ownership (FO) business is defined as the founder and his Annual Reports
family possesses more than 25% of this
total ownership.
Dependent Variables
Market value of total assets divided by
Tobin’s Q CSMAR Database
asset value
ROA Net income divided by total assets CSMAR Database
Control Variables
Natural logarithm of the market
Firm size (SIZE) CSMAR Database
capitalisation
Firm growth (GROWTH) Sales growth CSMAR Database
Leverage (LEV) Total liability divided by total assets CSMAR Database
R&D expenditures divided by
R&D investment (RD) CSMAR Database
total expensesJ. Risk Financial Manag. 2021, 14, 236 10 of 20
Table 1. Cont.
Variables Measurement Sources
Control Variables
Natural logarithm of the number of
Board size (b-size) CSMAR Database
board members
independent directors divided by
board independence(b-ind) CSMAR Database
corporate board
A dummy variable (0,1), equals to 1 if the
state-ownership (SOE) firm’s largest shareholder is state-owned, CSMAR Database
and 0 otherwise
A dummy variable (0,1), equals to 1 if the
Institutional ownership (IO) firm’s largest shareholder is institution, and CSMAR Database
0 otherwise
Firm effect
Year effect
3.3. The Propensity Score Matching (PSM) Method
The shortable list of pilot stocks in China is selected based on specific standards and
unique characteristics of those listed companies by the Shanghai and Shenzhen stock ex-
change, instead of randomly picked companies in the developed market (He and Tian 2015).
To avoid the problem of self-selection, this paper attempts to use the propensity score match-
ing (PSM) method to build an experimental group (companies in the short-sale list) and a
control group (companies out of the short-sale list) that has no significant differences in the
characteristics of the company in order to estimate our main specific models.
Based on the guidelines set by Caliendo and Kopeinig (2008), this paper conducted the
subsequent procedures in adopting the PSM method. Firstly, we used the following stock-
level characteristics of shortable firms: liquidity and volatility, firm-level characteristics (i.e.,
firm size, growth, leverage, and R&D expenses), and corporate governance characteristics
such as board size, independence, and the identity of shareholders, as the experimental
dataset and the firms out of the short-sell list as the matching sample. Secondly, we
applied a logit model for the propensity score estimation in which the dependent variable
is experimental. Additionally, a nearest neighbor matching strategy was conducted to
achieve the closest propensity score within 0.01 to match each experimental firm with one
control firm. In this method, all pairs were retained in the situation of multiple matching.
Besides, the year and the industry fixed effects were considered in the model.
After the matching procedure, a total of 1405 pairs of treatment (shortable firms) and
control (non-shortable firms) groups were matched with 11,234 firm-year observations.
The statistical results of the differences of the after-matching treated and control firms are
presented in Table 2. Before PSM, the differences among variables had been significant
at the 1% level. After the process of PSM, the significance of differences dropped to 5%,
10% significance level or insignificance, with the decline of T-statistics as well. The PSM
method facilitated alleviating the potentially problematic differences in company features
that were known to affect corporate value and lessen concerns that the results are guided
by trends in general time.J. Risk Financial Manag. 2021, 14, 236 11 of 20
Table 2. Propensity score matching (PSM) results.
Before PSM After PSM
Variables Treatment Control Diff T-Statistics Treatment Control Diff T-Statistics
SIZE 22.6435 21.4996 1.1440 *** 81.4867 22.6273 22.6304 −0.0031 −0.1958
GROWTH 0.1213 0.0433 0.0780 *** 4.4002 0.1206 0.1107 0.0099 * 2.9007
LEV 0.4559 0.3848 0.0711 *** 27.5174 0.4555 0.4647 −0.0091 −3.4203
RD 0.0625 0.0913 −0.0288 *** −8.7765 0.0627 0.0579 0.0047 * 1.6472
TURNOVER 21.4475 20.6484 0.7992 *** 59.4930 21.4351 21.3271 0.1079 ** 8.4327
VOLATILITY 6.4023 6.9809 −0.5786 *** −9.6234 6.3758 6.8646 −0.4888 ** −7.6344
b-size 2.1746 2.1098 0.0648 *** 24.9848 2.1737 2.1730 0.0007 0.2598
b-ind 0.3710 0.3728 −0.0018 ** −2.4779 0.3710 0.3695 0.0015 * 2.0150
SOE 0.4728 0.2732 0.1997 *** 31.5082 0.4707 0.4851 −0.0145 * −2.2142
IO 0.6765 0.4354 0.2411 *** 37.4953 0.6751 0.6410 0.0341 * 5.4941
Note: *, **, *** Denote significance at the 10%, the 5%, and the 1%, respectively.
4. Results and Discussion
4.1. Empirical Results and Discussion
In Table 3, we describe the descriptive statistics of the key variables in this study. The
means of Tobin Q and ROA are 1.7047 and 0.0483, respectively. The maximum number of
Tobin Q and ROA are 6.6414 and 0.1872, while the minimum value of Tobin Q and ROA are
0.9106 and −0.1046. Due to the PSM method, the mean of SHORT is 0.5226, which indicates
that about 50% of the observations are pilot firms. SIR has an average value of 0.0139,
indicating 1.39% of short selling activities in the daily trading volume of observations. It is
obvious that short selling trading in China is not a common tool for investors. The mean of
FO is 0.3534, representing that 35% of the observations are family firms. Regarding other
control variables, the mean value of firm size, growth, leverage, R&D intensity, board size,
board independence, SOE and IO are 22.6289, 0.1160, 0.4601, 0.0603, 2.1734, 0.3702, 0.4779,
and 0.6581 respectively.
Table 3. Summary statistics.
Variables Sample Mean Sd Min Max
Tobin’s Q 22,468 1.7047 0.8614 0.9106 6.6414
ROA 22,468 0.0483 0.0434 −0.1046 0.1872
SHORT 22,468 0.5226 0.4103 0.0000 1.0000
TREAT 22,468 0.2523 0.4632 0.0000 1.0000
SIR 5680 0.0139 0.0135 0.0000 0.3442
FO 22,468 0.3534 0.4780 0.0000 1.0000
SIZE 22,468 22.6289 1.1986 19.7432 26.1355
GROWTH 22,468 0.1160 0.2750 0.0177 0.6743
LEV 22,468 0.4601 0.2035 0.0515 0.8616
RD 22,468 0.0603 0.1826 0.0010 0.9660
b-size 22,468 2.1734 0.2011 1.3863 2.8904
b-ind 22,468 0.3702 0.0535 0.0000 0.8000
SOE 22,468 0.4779 0.4995 0.0000 1.0000
IO 22,468 0.6581 0.4744 0.0000 1.0000
Table 4 presents the Pearson correlation matrix among variables. The short dummy
(SHORT) is positively correlated with both measures of firm value, indicating that short-
selling deregulation moves in the same direction of firm value, though the coefficients are
only 0.2436 and 0.0641, representing a weak correlation. As the short interest ratio (SIR)
is only available for shortable observation, it is not included in the correlation metrics.
Family ownership is positively related to firm value, but also has a weak correlation.
For the control variables, the firm growth, R&D intensity, and board independence are
positively correlated with firm value. On the contrary, the firm size, leverage, board size,
state-ownership, and institutional ownership are negatively correlated with market value
and financial value.J. Risk Financial Manag. 2021, 14, 236 12 of 20
Table 4. Pearson correlation coefficients.
Variables Tobin’s Q ROA TREAT*SHORT FO Size Growth LEV RD b-size b-ind SOE IO
Tobin’s Q 1.0000
ROA 0.2753 *** 1.0000
TREAT*SHORT 0.2436 *** 0.0641 ** 1.0000
FO 0.1505 *** 0.1923 *** −0.0580 *** 1.0000
SIZE −0.5104 *** −0.1661 *** 0.2438 *** −0.2821 *** 1.0000
GROWTH 0.4002 *** 0.2178 *** −0.1311 *** 0.1333 *** −0.2276 *** 1.0000
LEV −0.3776 *** −0.4268 *** 0.0275 *** −0.2592 *** 0.5602 *** −0.1178 *** 1.0000
RD 0.0047 ** 0.0749 *** 0.0985 *** 0.0376 *** 0.0108 −0.0542 *** −0.0913 *** 1.0000
b-size −0.1379 *** −0.0349 *** 0.0270 *** −0.2493 *** 0.2520 *** −0.1455 *** 0.1523 *** −0.0584 *** 1.0000
b-ind 0.0182 *** −0.0306 *** 0.0388 *** 0.0471 *** 0.0320 *** 0.0370 *** 0.0142 ** 0.0027 −0.4531 *** 1.0000
SOE −0.1981 *** −0.1791 *** 0.0480 *** −0.7069 *** 0.3328 *** −0.1722 *** 0.3170 *** −0.0821 *** 0.2572 *** −0.0274 *** 1.0000
IO −0.0115 * −0.1845 *** 0.1655 *** −0.3207 *** 0.2156 *** −0.2399 *** 0.2516 *** −0.0468 *** 0.1238 *** −0.0481 *** 0.3390 *** 1.0000
Note: *, **, *** Denote significance at the 10%, the 5%, and the 1%, respectively.J. Risk Financial Manag. 2021, 14, 236 13 of 20
Table 5 illustrates the empirical findings on the relationship between short-selling
deregulation, as measured by short dummy and firm value with Tobin’s-Q and ROA,
respectively. As hypothesised, the findings of Model 1 and 2 indicated a significant positive
relationship between short-selling deregulation and ROA, as well as Tobin’s Q, at the 1%
level. Thus, Hypotheses 1 and 2 were supported. This result shows that short selling
deregulation helps to improve the firm value of listed companies in China, indicating that,
after deregulation, the appearance of short selling can act as external governance, encourage
the detection of unfavourable business information, and raise the cost of demanding
private benefits of executives by limiting their unethical behaviour and conflicts of interest
(Mai and Hamid 2020; Massa et al. 2015).
Table 5. Short-selling deregulation and firm value.
M1a M1b
Tobin’s Q ROA
Variables Coefficient Probability Coefficient Probability
Intercept 6.8401 *** 0.000 −0.0966 *** 0.000
SHORT 0.2176 *** 0.000 0.0027 *** 0.000
TREAT*SHORT 0.5087 *** 0.000 0.0046 *** 0.000
SIZE −0.2597 *** 0.000 0.0081 *** 0.000
GROWTH 11.0309 *** 0.000 0.4074 *** 0.000
LEV −0.5509 *** 0.000 −0.1147 *** 0.000
RD 0.0161 ** 0.032 0.0119 *** 0.000
b-size −0.5139 *** 0.000 −0.0060 *** 0.000
b-ind 0.2552 *** 0.004 0.0199 *** 0.002
SOE −0.2972 *** 0.000 −0.0125 *** 0.000
IO −0.0182 * 0.063 −0.0135 *** 0.000
Firm-fixed yes yes
Year-fixed yes yes
R-square 0.501365 0.276921
Adj R-square 0.500171 0.272055
F-statistics 5856.637 2229.85
N 22468 22468
Note: *, **, *** Denote significance at the 10%, the 5%, and the 1%, respectively. Coefficients are based on robust
standard errors, corrected for heteroscedasticity.
Table 6 exemplifies the empirical findings on the relationship between short-selling
regulation, as measured by short-selling propensity (SIR), and firm value. Model 3 and 4
demonstrated a positive relationship between short interest ratio and Tobin’s Q, as well as
ROA, significant at the 1% level, respectively. Thus, Hypotheses 3 and 4 were supported.
This result indicates that the high short interest ratio may be regarded as a signal for
the threats to corporate executives. To avoid further accumulating short-selling position,
managers choose to correct those misconducts and eventually improve the firm value.
Table 7 demonstrates the effect of family ownership on the relationship between
short-selling deregulation and firm value. In model 3a and 3b, the moderating effects were
tested by adding the interaction terms (TREAT*SHORT*FO) to models 1 and 2. The results
showed that the interacting terms were negatively significant at 1% level, supporting
Hypothesis 5 that family ownership can act as a moderator of the relationship between
short-selling and firm value. With the presence of family ownership, the firm value is
dampened. This finding is consistent with Hypotheses 5 and 6. In models 4a and 4b, the
moderating effects were also tested by adding the interaction terms (SIR*FO), suggesting
that the interacting terms in both models were negative and significant at the 5% and
1% level. Addtionally, with respect to family business, short selling propensity does not
improve firm value, which is consistent with 4a and 4b.J. Risk Financial Manag. 2021, 14, 236 14 of 20
Table 6. Short-selling propensity and firm value.
M2a M2b
Tobin’s Q ROA
Variables Coefficient Probability Coefficient Probability
Intercept 6.2755 *** 0.000 −0.2106 *** 0.000
SIR 4.4419 *** 0.000 0.2668 *** 0.000
SIZE −0.1874 *** 0.000 0.0133 *** 0.000
GROWTH 22.5524 *** 0.000 0.5337 *** 0.000
LEV −1.6376 *** 0.000 −0.1267 *** 0.000
RD 0.0153 * 0.062 0.0122 *** 0.000
b-size −0.4899 *** 0.000 −0.0062 *** 0.000
b-ind 0.2433 *** 0.004 −0.0205 *** 0.000
SOE −0.2833 *** 0.000 −0.0128 *** 0.000
IO −0.0174 * 0.060 −0.0139 *** 0.000
Firm-fixed yes yes
Year-fixed yes yes
R-square 0.692211 0.285828
Adj R-square 0.688559 0.280504
F-statistics 3097.965 550.754
N 5680 5680
Note: *, **, *** Denote significance at the 10%, the 5%, and the 1%, respectively. Coefficients are based on robust
standard errors, corrected for heteroscedasticity.
Table 7. Short-selling, family ownership and firm value.
M3a M3b M4a M4b
Tobin’s Q ROA Tobin’s Q ROA
Variables Coefficient Coefficient Coefficient Coefficient
7.1748 *** −0.1025 *** 5.2974 *** 0.2026 ***
Intercept
(0.000) (0.000) (0.000) (0.000)
SHORT 0.2249 *** 0.0027 ***
(0.000) (0.000)
0.4073 *** 0.0079 ***
TREAT*SHORT
(0.000) (0.000)
TREAT*SHORT* −0.0890 *** −0.0087 ***
FO (0.000) (0.000)
4.4454 *** 0.3605 ***
SIR
(0.000) (0.000)
−0.3561 * −0.2907 ***
SIR*FO
(0.051) (0.000)
−0.2377 *** 0.0083 *** −0.1675 *** 0.0125 ***
SIZE
(0.000) (0.000) (0.000) (0.000)
10.3988 *** 0.3783 *** 20.9496 *** 0.4954 ***
GROWTH
(0.000) (0.000) (0.000) (0.000)
−0.1062 *** −1.3233 *** −0.1298 ***
LEV −0.5434 *** (0.000)
(0.000) (0.000) (0.000)
RD 0.0166 * 0.0121 *** 0.0145 * 0.0122 ***
(0.082) (0.000) (0.071) (0.000)
b-size −0.5311 *** −0.0062 *** −0.5295 *** −0.0062 ***
(0.000) (0.000) (0.000) (0.000)
b-ind 0.2637 *** −0.0204 *** 0.2629 *** −0.0205 ***
(0.004) (0.000) (0.007) (0.000)
SOE −0.3071 *** −0.0128 *** −0.3062 *** −0.0128 ***
(0.000) (0.000) (0.000) (0.000)
IO −0.0188 * −0.0138 *** −0.0188 * −0.0139 ***
(0.064) (0.000) (0.055) (0.000)
Firm-fixed yes yes yes yes
Year-fixed yes yes yes yes
R-square 0.484504 0.284432 0.685413 0.27678
Adj R-square 0.492699 0.27627 0.692603 0.285283
F-statistics 4609.131 1776.662 2516.156 450.1694
N 22468 22468 5680 5680
Note: *, **, *** Denote significance at the 10%, the 5%, and the 1%, respectively. Coefficients (Probability value in
parentheses) are based on robust standard errors, corrected for heteroscedasticity.J. Risk Financial Manag. 2021, 14, 236 15 of 20
Table 8 explained the effect of short selling on firm performance by comparing family
and non-family-owned companies. It is observed that deregulation of short selling is
beneficial to the market values (Tobin’s Q) of both family and non-family businesses, but
the effect of short selling performs better for those non-family firms. However, deregu-
lation of short selling is insignificant with the financial value (ROA) of family business,
indicating that the moderating effect on short-selling constraints and ROA is not observed.
Additionally, short selling propensity also significantly improves the firm value for both
family and non-family businesses, but the effect is also negative on the family business
firms. This finding indicates that the short-selling mechanism, which is intended to profit
from detecting misconducts of business management and negative information, leads to
a positive firm value by serving as external governance for all firms, including family
business and non-family business. However, this external governance effect works better
for non-family business. This result supports our argument that family business has better
corporate governance and achieves a higher firm value (Tang et al. 2017). As a result, the
appearance of short selling may not act as external governance in improving firm value
for family businesses, which can alleviate the agency problem by aligning the interests of
other shareholders and management. In short, when short selling is available, it is more
beneficial for value creation for the non-family firms than family business.
Table 8. Family ownership vs. non-family ownership.
SHORT*TREAT SIR
FO/Non-FO
Coefficient Coefficient
Family-owned 0.3183 ** 4.0893 ***
Tobin’s Q
Non- Family-owned 0.4073 *** 4.4454 ***
Family-owned −0.0008 0.0698 *
ROA
Non- Family-owned 0.0079 *** 0.3605 ***
Note: *, **, *** Denote significance at the 10%, the 5%, and the 1%, respectively. Coefficients are based on robust
standard errors, corrected for heteroscedasticity.
4.2. Robustness Test
4.2.1. Alternative Measures of Firm Value
In this section, the researchers employ alternative measurements for the firm value as
dependent variables. Specifically, PB (Price/Book value) and ROE (Return on Equity) are
adopted to substitute Tobin’s Q and ROA to represent market-based value and accounting-
based value. Table 9 demonstrates that the interacting terms (TREAT*SHORT*FO) were
negatively significant at 1% and 10% level, indicating that family ownership can act as a
moderator on the relationship between short-selling and the alternative measurements of
firm value (PB and ROE). However, with the presence of family ownership, the firm value
decreases. In addition, the moderating effects were also tested by adding the interaction
terms (SIR*FO). The results show that the interacting terms in both models were negative
and significant at the 5% and 1% level, suggesting that short selling propensity does not
improve alternative measurements of firm value (PB and ROE) for family business.
Table 10 explains the effect of short selling on alternative measurements of firm value
(PB and ROE) with the comparison of family and non-family-owned companies. It is
observed that deregulation of short selling is beneficial to the accounting value (ROE) of
both family and non-family business, but the effect of short selling is better for non-family
firms. However, deregulation of short selling is significant and negative in correlation
with the market value (PB) of family business; thus, short selling deregulation negatively
affects PB for family business. Additionally, short selling propensity (SIR) also significantly
improves the alternative measurements of firm value (PB and ROE) for all firms, but the
effect is also negative on family business firms. The robustness test is valid and consistent
with the above analysis.J. Risk Financial Manag. 2021, 14, 236 16 of 20
Table 9. Robustness test for alternative measurements of firm value.
PB ROE PB ROE
Variables Coefficient Coefficient Coefficient Coefficient
−1.0819 −0.3905 *** 7.8102 *** −0.5131 ***
Intercept
(0.299) (0.000) (0.000) (0.000)
−0.4644 *** 0.0033 ***
SHORT
(0.000) (0.000)
TREAT*SHORT 0.1018 * 0.0191 ***
(0.073) (0.000)
TREAT*SHORT* −0.1939 * −0.0189 ***
FO (0.068) (0.000)
7.5322 *** 0.7819 ***
SIR
(0.000) (0.000)
−2.3574 ** −0.6833 ***
SIR*FO
(0.040) (0.000)
0.0458 0.0203 *** −0.2554 *** 0.0270 ***
SIZE
(0.332) (0.000) (0.000) (0.000)
72.2093 *** 0.8964 *** 69.7196 *** 1.0069 ***
GROWTH
(0.000) (0.000) (0.000) (0.000)
1.5528 *** −0.0638 *** 0.6751 *** −0.0814 ***
LEV
(0.000) (0.000) (0.000) (0.000)
−0.7636 *** 0.0129 *** −0.7226 *** 0.0127 ***
RD
(0.001) (0.000) (0.001) (0.000)
1.8901 *** 0.0001 1.7885 *** 0.0001
b-size
(0.000) (0.781) (0.000) (0.769)
−4.2970 *** −0.0066 −4.0660 *** −0.0065
b-ind
(0.000) (0.358) (0.000) (0.352)
0.0639 −0.0086 *** 0.0604 −0.0084 ***
SOE
(0.441) (0.000) (0.418) (0.000)
−2.0428 *** −0.0106 *** −1.9330 *** −0.0105 ***
IO
(0.000) (0.000) (0.000) (0.000)
Firm-fixed yes yes yes yes
Year-fixed yes yes yes yes
R-square 0.112722 0.112938 0.8386 0.1434
Adj R-square 0.113555 0.116671 0.8347 0.1450
F-statistics 610.9079 605.8619 5416.794 193.0208
N 22468 22468 5680 5680
Note: *, **, *** Denote significance at the 10%, the 5%, and the 1%, respectively. Coefficients (Probability value in
parentheses) are based on robust standard errors, corrected for heteroscedasticity.
Table 10. Family ownership vs. non-family ownership.
SHORT*TREAT SIR
FO/Non-FO
Coefficient Coefficient
Family-owned −0.0921 * 5.1748 ***
PB
Non-Family-owned 0.1018 * 7.5322 ***
Family-owned 0.0002 * 0.0819 ***
ROE
Non-Family-owned 0.0191 *** 0.0986 ***
Note: *, **, *** Denote significance at the 10%, the 5%, and the 1%, respectively. Coefficients are based on robust
standard errors, corrected for heteroscedasticity.
4.2.2. Multicollinearity Test Using Variance Inflation Factor (VIF)
To ensure the reliability of regression results, this section tests the multicollinearity
of variance in four models of this research by adopting the variance inflation factor test
(VIF). All independent variables have VIF scores that demonstrate how much this variable
is explained by other independent variables. The higher the value of VIF score means the
higher the multicollinearity of that independent variable. The problem of multicollinearity
exists when the VIF score is higher than 10 (Hair et al. 2006). Table 11 shows that the VIFYou can also read