The National Skills Academy for Rail (NSAR) Skill, planning and productivity - Rail Forum ...
←
→
Page content transcription
If your browser does not render page correctly, please read the page content below

The National Skills Academy for Rail (NSAR) Skill, planning and productivity
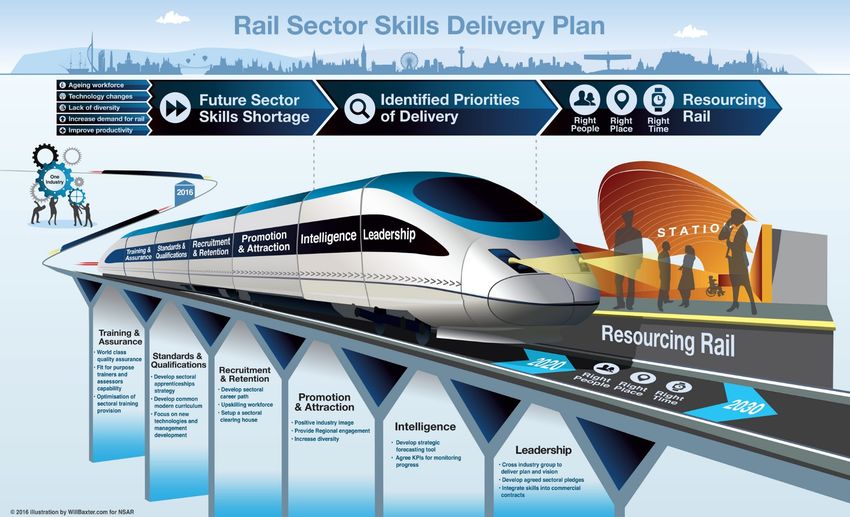
CONTEXT
 Skills shortages across all infrastructure sectors
 are putting at risk the National Infrastructure
 Plan – cost and schedule.

 Skills are not an end in their own right but one of
 the drivers of productivity

 Government has announced:
 - a productivity plan where skills is one of the
 principal drivers
 - a target of 3m apprenticeships
 - a levy to help pay for this
 - 30,000 transport apprentices
 - DfT transport skills strategy
 - RSG leading ‘sector strategy’ (productivity)

 DfT, organisations and individual business all
 recognise and are addressing the skills
 shortages. A s tro n g c ollective re s p o n s e will
 require co-ordination and support.

 Not just engineering skills.

Update summary

Skills forecasting underway at
national and now company level          What does this mean for me?

Strategic workforce planning eg route
                                        • Have I got a clue about
Procurement changes                       what my workforce looks
                                          like in 5 years?
Sector deal                             • How can I prove I will be
                                          productive?
Productivity scorecard and pilots
                                        • How do I know if I am
Wider economic impact - treasury
                                          ticking the right boxes at
                                          tendering?
Apprenticeship levy, service and        • Am I influencing the right
forecasts
                                          things/people?

Today’s Workforce (1) – Population of 219,000
Gender imbalance is decreasing, from
approximately 4% in rail engineering
four years ago, the figure is now closer
to 10%. More needs to be done though.
Operations figures contain all TOCs.
There are more staff at Level C than B,
indicating multiple management layers
STAT
Slides
v2
-‐ December
2016 5
Investment Plans (2)
These charts show total planned investment until end of CP8 depicted over time, then proportions of
investment by organisation, work type and asset. DfT is Rolling Stock
STAT
Slides
v2
-‐ December
2016 6
Future Workforce : Outputs (5) : 2020 = 202,770;
and 2024 = 180,426
Charts showing the total predicted workforce for
2020 (b) and 2024 (c) compared to today’s
workforce (a) presented proportionally by Skill
level.
STAT
Slides
v2
-‐ December
2016 7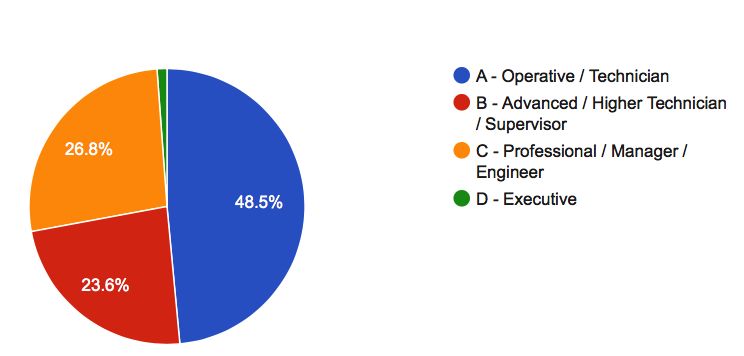
Future Workforce (5)
10196
South West - 2020
South West - 2024 9490
Wales - 2020
4021
Wales - 2024
Midlands - 2020 3699
Midlands - 2024 23241
North of England - 2020
21677
North of England - 2024
London & South East - 2020 25776
London & South East - 2024 24511
Scotland - 2020
Scotland - 2024 111346
(blank) - 2020 96269
(blank) - 2024 12112
0 10000
11608 20000 30000 40000 50000 60000 70000 80000 90000 100000110000120000
16217
13298
A - Operative / Technician B - Advanced / Higher Technician / Supervisor
C - Professional / Manager / Engineer D - Executive
Graph showing the future workforce required in 2020 & 2024 shown by skill level proportions
per region. Notable are the ‘(blank)’ entrants that refer to Traction & Rolling Stock workers so
therefore cannot be assigned a region.
STAT
Slides
v2
-‐ December
2016 8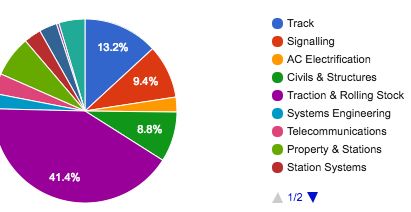
Future
  Demand

                   9
Construction
unlike Transport
&
Storage
has failed
to
return
to
trend
productivity suggesting
over
capacity
Construction Transport
&
Storage
Construction
GVA
(£Bn)
Actual
vs
Extrapolation Transport
&
Storage
GVA
(£Bn)
Actual
vs
Extrapolation
160
80
140
70
120
60
100
50
80
40
60
30
40 20
20 10
0 0
Jan
00
Jan
01
Jan
02
Jan
03
Jan
04
Jan
05
Jan
06
Jan
07
Jan
08
Jan
09
Jan
10
Jan
11
Jan
12
Jan
13
Jan
00
Jan
01
Jan
02
Jan
03
Jan
04
Jan
05
Jan
06
Jan
07
Jan
08
Jan
09
Jan
10
Jan
11
Jan
12
Jan
13There
is
evidence
of
significant
wage
inflation
in
rail
construction;
a
significant
contrast
with
construction
as
a
whole.
This
would
be
unlikely
to
occur
if
sufficient,
trained
resource
was
available.
Avg
Employee
Cost Notes:
90.00 • In
the
construction
sector
overall
the
cost
per
80.00 worker
only
went
up
by
5%
between
2008
70.00 and
2014.
60.00 • In
rail
construction
the
average
employee
50.00 cost
rose
by
85%
over
this
same
timeframe.
40.00 • This
could
be
due
to
a
lack
of
skills
planning
30.00 (so
demand
exceeding
supply
and
driving
up
20.00 wages)
or
due
to
outsourcing
the
lowest
cost
10.00 2008 roles
(thereby
shifting
up
the
average).
0.00 • If
it
were
due
to
outsourcing
lower
cost
roles
2014
we
would
expect
the
margin
to
increase,
as
no
organization
would
outsource
low
cost
roles
so
that
they
cost
more.
• All
things
being
equal,
if
the
employee
cost
had
stayed
flat,
the
productivity
uplift
(ie the
efficiency
component)
would
only
have
been
15%
in
Rail.The
study
suggests
that
there
are
opportunities
to
avoid
significant
(10-‐30%)
over-‐run
capital
costs
and
deliver
(10-‐40%)
efficiencies
£300
Billion
of
Infrastructure
Spend
50%-‐60%
Optimally
Excess
Efficiencies
Missed
Spent Costs
A:
Avoid
the
cost
of
conflict
and
the
cost
of
poor
capability
and
create
an
environment
for
efficiency
B:
Avoid
the
costs
of
skills
shortages
C:
Stop
restarting
the
learning
curve
on
people,
processes,
products,
contracts
and
technology
D:
Take
the
right
risks
and
stop
paying
for
excessive
design
redundancy
and
unrealistic
risk
transfer
E:
Use
“digital
/
don’t
build”
to
get
the
outcome
without
concrete
F:
Use
our
scale
for
robust
asset
data,
manufacturing,
R&D
and
asset
standards
12C:
Stop
restarting
the
learning
curve
on
people,
processes,
products,
contracts
and
technology
“We
actually
had
“negative
certainty”
we
all
20%-‐40%+ knew
[department]
would
cancel
the
project
but
they
and
the
minister
were
refusing
to
Value blink
…
so
£100m
was
wasted.”
It
was
“their
10-‐20% risk”
[the
supply
chain’s]
but
that
money
still
needs
to
be
recovered
somewhere
.”
5-‐10%
“It
is
like
turning
up
on
the
station
every
day
Timeframe 0-‐18 18-‐36 36-‐48 48+
and
demanding
the
cheapest
single
…
when
People Team
Dynamics Workforce
leveling,
Long term
career
Culture
change you
could
have
just
bought
a
season
ticket
Training development
and
saved
a
boatload.”
Processes Explicit
method
Documented
Continuous
process
ISO
standards
for
reuse processes improvement continuous
delivery “I
remember
building
5
terminals
in
Azerbaijan
to
exactly
the
same
standard.
It
Designs Design
templates Repeat building
Standard
Assets DfMA
was
hard
work
avoiding
changes
but
the
fifth
same
asset Asset Standards came
in
30%
under
budget.”
Contracts Heavy lifting
to
Reuse
/ extend
Small changes Repeatable
document
intent same
framework standard
call
off
Technology Project
tools
and
Automated
design
Whole
life
asset
Digital
replicas
of
templates and
reporting management assets
Resourcing Consultants, contractors
&
sub
Employees, trainees
and
long
term-‐
contracts supplier
relationships
and
talent
development
13F:
Use
our
scale
for
robust
asset
data,
manufacturing,
R&D
and
asset
standards
Picture
1 Picture
1 Picture
1 Picture
1
Typ. %
Maturity
Level
Lever
Impact 0 Level
1
– Initial 2 Level
3
-‐ Developing 4 Level
5
-‐ Mature
More than
50%
of
asset
There is
a
national
set
of
standard
asset
The
QMS
is
well
established
and
the
supply
Standard
value
is
procured
from
a
components
and
more
than
50%
of
asset
value
is
chain
is
building
compliant
products
that
are
Assets
&
10%-‐30% set
of
regional
standard
spent
on
these
items.
There
is
a
Quality
designed,
assembled
and
commissioned
DfMA assets
(above
the
base
Management
System
and
Product
Management
efficiently.
component
level) System
in
place.
Periodic attempts
to
The value
of
asset
data
is
defined
and asset
data
Collection
of
asset
data
is
embedded
in
the
systematically
collect
is
systematically
collected
and
asset
data
quality
organisation’s processes.
The
data
quality
is
Asset
Data 10%-‐20% asset data
for
projects.
is
defined. assured
and
the
organisation is
confident
to
act
on
the
basis
of
asset
data.
The
expected
value
is
being
delivered.
Asset
Standards are
Asset
Standards are
“delayered”
to
provide
a
“Principle
based”
asset
standards
are in
Asset
systematically
collated
for
single
coherent
reference
with
no
inconsistency
place
where
designers
have
the
mandate
to
5-‐10%
Standards asset
types for
major
asset
types innovate
to
provide
same
outcomes
with
different
approaches.
Regional or
local
National
sharing
of
R&D
results
or
national
R&D
shared
nationally,
with
portfolio of
innovation
focused
on
1-‐3
portfolio
or
national
integration
with
horizon
3
horizon
1
(1-‐3yr)
and
horizon
2
(3-‐5yr)
R&D 5-‐10%
year
horizon
with
results
(5yr+)
innovation research
targets.
Tight
integration
with
shared
locally sources
of
horizon
3
(5yr+)
innovation.
14C:
Policy
vs
Reality:
The
erosion
of
the
investment
time
horizon
A Policy certaintyFuture
Alignment of skills and other rsg
strands into scorecard • How do we backfill after
brexit?
Strategic workforce planning at • How do we get 20%
project level productivity gains in 5
years?
Procurement changes • Is 2.5% apprenticeships in
the workforce enough?
Sector deal • Is it 50/50 upskilling / new
right?
Productivity scorecard and pilots • How can tier 1s help their
supply chain?
Wider economic impact - treasury
• How can I use nsar
connect?
Social inclusion and brexitYou can also read