Why is the Euro Punching Below its Weight? - Banco de España
←
→
Page content transcription
If your browser does not render page correctly, please read the page content below
Why is the Euro Punching
 Below its Weight?

 ETHAN ILZETZKI, LONDON SCHOOL OF ECONOMICS
 CARMEN M. REINHART, HARVARD UNIVERSITY
 KENNETH S. ROGOFF, HARVARD UNIVERSITY

3RD ANNUAL RESEARCH CONFERENCE OF THE BANCO DE ESPAÑA
 MADRID, SEPTEMBER 16, 2019
• The euro is the world’s second most
 important international currency…its
 creation consolidated the French franc
 and DM currency areas
 • But is a far second to the dollar by a
 Some broad variety of measures
observations • Furthermore, after a promising start in
 its early years, it has lost ground in the
 global economy
 • We document these facts and delve into
 its plausible causes
Roadmap

 The international role of
 Why is the euro punching
 the Euro as an anchor Further research
 below its weight
currency: Various metrics
• IIR exchange rate • Illiquid euro debt • Measuring the liquidity
 regimes markets of debt markets
• The geography of • The role of official • De facto versus dejure
 exchange rate regimes institutions capital controls
• Central bank reserves • Post-crisis financial • China’s global footprint
• The denomination of regulation and its implications
 EM external debt • The crisis and the
 “emergence” of a
 European periphery
 (evidence from ECB
 monetary policy)
 • EZ’s relative decline

 ILZETZKI, REINHART AND ROGOFF: EURO PUNCHING 3
The International Role of
 the Euro

 ILZETZKI, REINHART AND ROGOFF: EURO PUNCHING 4
Dollar and Euro as Anchor Currencies
80 Percent

 US Dollar
70

60

50

40

 DM & FFR Euro
30

20

10

 0
 1975 1980 1985 1990 1995 2000 2005 2010 2015

 Share of countries anchored to the dollar and euro by their share in world
 GDP, 1975-2015
 ILZETZKI, REINHART AND ROGOFF: EURO PUNCHING 5
Dollar and Euro as Anchor Currencies
60 Percent

 US Dollar

50

40

 DM & FFR Euro
30

20

10

 0
 1975 1980 1985 1990 1995 2000 2005 2010 2015

Note: Share of countries anchored to the dollar and euro, 1975-2015

 ILZETZKI, REINHART AND ROGOFF: EURO PUNCHING 6
Countries with Euro Anchor

 ILZETZKI, REINHART AND ROGOFF: EURO PUNCHING 7
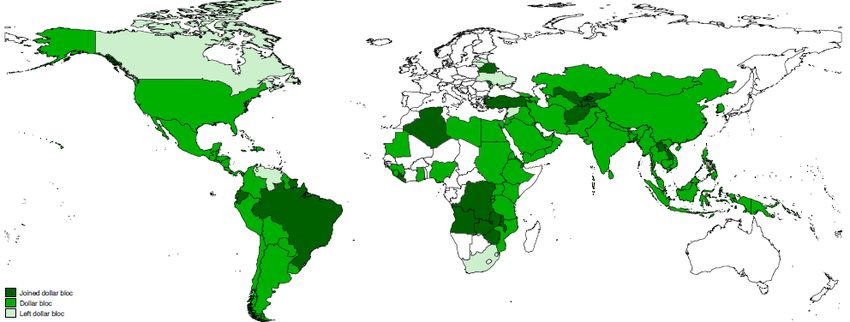
Countries with Dollar Anchor

 ILZETZKI, REINHART AND ROGOFF: EURO PUNCHING 8
Currency Composition of Central Bank
 Reserves: Dollar and Euro
100 Percent Billions USD 12.000

90

 10.000
80

70
 Total Reserves
 8.000

60

50 6.000

40

 US Dollar 4.000
30

20
 2.000
 Euro
10 Euro

 0 0
 1995 2000 2005 2010 2015

 Note: Allocated central bank reserves denominated in euro (bottom, blue) and dollar (top, green), 1995-
 2018.(Both left-hand axis.) The line (right-hand axis) shows total world central bank allocated reserves in
 billions of US dollars. The vertical line shows the date of euro adoption.
 ILZETZKI, REINHART AND ROGOFF: EURO PUNCHING 9
Foreign Exchange Turnover:
 Shares of Major Currencies
200 Percent

180

160

140

120
 US Dollar
100

 80

 60 UK Pound
 Yen
 40

 Euro
 20

 0
 1995 1998 2001 2004 2007 2010 2013 2016

Note: Share of foreign exchange transactions in which each of presented currencies was one side of the
transaction, 1995-2016.

 ILZETZKI, REINHART AND ROGOFF: EURO PUNCHING 10
80 Percent

Borrowing in 70

Euros and 60
 US Dollar

Dollars:
Developing 50

Country 40

External Debt
Not just what 30

you see but what DM & FFR Euro
 20
you don’t see…
 10

 0
 1975 1980 1985 1990 1995 2000 2005 2010 2015

 ILZETZKI, REINHART AND ROGOFF: EURO PUNCHING 11
The preceding chart (based on official World
 Bank data) seriously underestimates developing
 country exposure to US dollar debt. “Hidden
 Debts to China” are almost exclusively dollar-
denominated (see Horn, Reinhart, and Trebesch,
 2019). According to their estimates, the World
Bank data incorporates about ½ of actual Chinese
lending to EMs and developing countries--further
 widening the existing Euro-dollar gap in the past
 two decades.

 Ilzetzki, Reinhart and Rogoff: Euro Punching 12
China: Overseas lending boom, 1998-2018
 Aggregate Data: PBOC Balance of Payments
 Statistics

 Loans: $590 bn
 Trade credits: $750 bn
 FDI debt: $160 bn

Source: Horn, Reinhart, and Trebesch (2019) 13
Why is the Euro
Punching Below its
Weight?
The role of increasingly
illiquid debt markets

ILZETZKI, REINHART AND ROGOFF: EURO PUNCHING 14
6.000 Billions USD

 Fed Dollar Liabilities to non-US residents

5.000
 Global
 Demand for
4.000
 Dollar and
 Euro
 Liquidity
3.000

 of which to Europe
2.000

1.000

 ECB Euro Liabilities to non-EZ r

 0
 2000 2002 2004 2006 2008 2010 2012 2014 2016 2018

ILZETZKI, REINHART AND ROGOFF: EURO PUNCHING 15
16,000
 Billions USD

Bank dominance and bond
 14,000

 12,000

“scarcity”: Marketable Debt 10,000

Outstanding, 2018
 8,000 US

 6,000

 4,000 Eurzone
The top panel shows the marketable 2,000 France
central government outstanding in 0
 Germany

billions of US dollars in 2018 for France
and Germany, all Eurozone countries
(including France and Germany) and the 40 Perecent
 of GDP
 Corporate Bonds Bank Lending

US. 35

The bottom panel plots corporate bonds 30

outstanding and total corporate bank 25

lending as a percent of GDP in the 20

Eurozone and the US. 15
 US
 Eurzone
 10

 5 Eurzone US

 0

 ILZETZKI, REINHART AND ROGOFF: EURO PUNCHING 16
The post-crisis shift in EZ monetary
 policy (more to follow) has also
contributed to the illiquidity of local
 bond markets…

 Ilzetzki, Reinhart and Rogoff: Euro Punching 17
% of total government debt

 10
 15
 20
 25
 30
 35
 40

 0
 5
 Austria
 Belgium
 Finland
 France
 Germany
 Greece
 Ireland
 Italy
 Netherlands
 EZ

 Portugal
 Slovenia
 2004:Q1

 Spain
 Australia
 Canada
 Czech Republic
 Select Advanced Economies: 2004 versus 2018
 2018:Q4

 Denmark
 Japan
 Korea
 New Zealand
 Norway
 Sweden
 Switzerland
 Domestic Central Bank Holdings as a Percent of Total Public Debt

 United Kingdom
 United States
 EZ avg
 Non EZ avg
 Non EZ ex Japan
 Sources: Authors' calculations based on Arsnalalp and Tsuda (2014 and 2019).

18
Other official institutions European Financial
Stability Facility (EFSF) and European Stability
 Mechanism (ESM) also purchased Greek,
Cypriot, Irish, Spanish, and Portuguese debt—
 shifting debt holdings into official hands and
 further reducing bond market liquidity.

 Ilzetzki, Reinhart and Rogoff: Euro Punching 19
Official Holdings as a Percent of Total Public Debt
 Select Advanced Economies: 2004 versus 2018
 2004:Q1 2018:Q4

 70.00
 % of total government debt
 60.00
 EZ
 50.00
 40.00
 30.00
 20.00
 10.00
 0.00

 Sweden

 United States
 Slovenia
 Portugal

 Non EZ avg
 New Zealand
 Canada

 Denmark

 Norway

 Switzerland
 Belgium

 Ireland

 Netherlands

 EZ avg
 Germany

 Korea

 United Kingdom
 Australia
 Finland

 Greece
 France

 Czech Republic
 Austria

 Italy

 Japan
 Spain
Note
scale

 Sources: Authors' calculations based on Arsnalalp and Tsuda (2014 and 2019).

 Ilzetzki, Reinhart and Rogoff 20
70 Percent

65 France
60

55 Germany

50
 US
45

40 Foreign
35

30
 Holdings as
25 a Share of
20
 1999 2004 2009 2014 Marketable
 Percent share of marketable government that
 is held by foreign investors (private and
 Government
 official sectors). Debt
 Source: Merler and Pisani-Ferry (2012).

ILZETZKI, REINHART AND ROGOFF: EURO PUNCHING 21
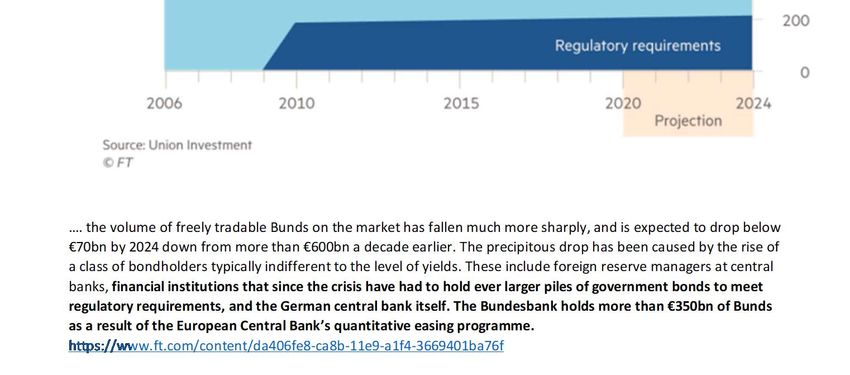
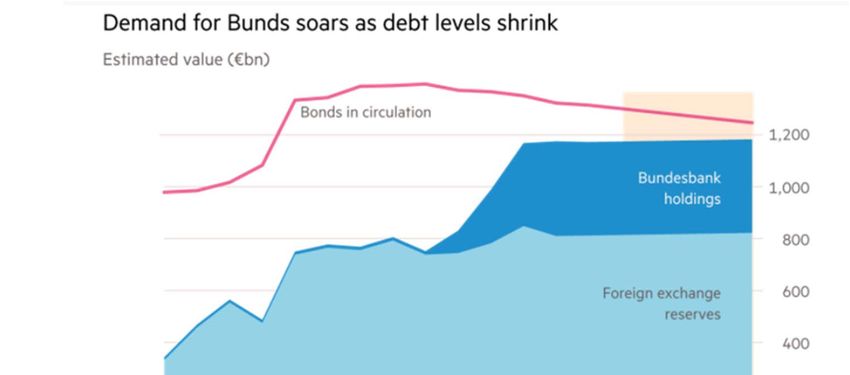
Post-crisis financial regulation (and more
 broadly financial repression) has meant that
institutions are required to hold higher levels
 of government debt—further impacting
 market liquidity…

 Ilzetzki, Reinhart and Rogoff: Euro Punching 22
Ilzetzki, Reinhart and Rogoff: Euro Punching 23
Currency Home Bias in US and Eurozone Bank
 Holdings
 100 Percent

 95

 90
 US
 85

 80

 75

 70 Eurozone

 65

 60

 55

 50
 1995 2000 2005 2010

 Share US banks’ gross foreign assets denominated in dollars (top, green line) and of Eurozone
 banks gross foreign assets denominated in euro (post 1999) or ECU-lined currencies (pre 1999)
 (bottom, blue line).
 ILZETZKI, REINHART AND ROGOFF: EURO PUNCHING 24
As the next two charts
highlight, Eurozone
government debt
markets became
radically fragmented
after the crisis.

Ilzetzki, Reinhart and Rogoff: Euro Punching 25
Sovereign Spreads and Foreign Holdings as a Share of
 Marketable Government Debt
 Italy Spain
 6 55 5 55
 Sovereign Spread (Percent) Foreign Share (Percent)
 Sovereign Spread (Percent) Foreign Share (Percent)
 5 50 4 50

 4
 45 3 45
 3
 40 2 40
 2
 35 1 35
 1
 30 0 30
 0 1997 1999 2001 2003 2005 2007 2009 2011 2013 2015 2017 2019
 1997 1999 2001 2003 2005 2007 2009 2011 2013 2015 2017 2019
 25 -1 25
 -1

 -2 20 -2 20

 14
 Portugal 90 30
 Greece
 Sovereign Spread (Percent) Foreign Share (Percent) Sovereign Spread (Percent) Foreign Share (Percent)
 70
 12 80 25

 10 60
 70 20

 8
 60 15
 50
 6
 50 10
 4 40
 40 5
 2

 30 30
 0 0
 1997 1999 2001 2003 2005 2007 2009 2011 2013 2015 2017 2019 1997 1999 2001 2003 2005 2007 2009 2011 2013 2015 2017 2019

 -2 20
 -5 20

 Percent share of marketable government that is held by foreign investors (private and
 official sectors, dashed lines, right-hand axis) and the spread of the 10-year bond of
 the country in question over Germany’s.
 ILZETZKI, REINHART AND ROGOFF: EURO PUNCHING 26
As foreign investors exit post-crisis, the reliance on domestic banks for funding
 government is greater. Home bias is not exclusively determined by currency
 denomination; within EZ national borders matter.

 The debt is
 18 Percent 20 Percent Italy
 Greece transferred to
 16 18
 14
 Official creditors
 16
 12
 10 14
 8 12
 6
 10
 4
 2 8
 0 6
 2004Jan 2006Jan 2008Jan 2010Jan 2012Jan 2014Jan 2016Jan 2004Jan 2006Jan 2008Jan 2010Jan 2012Jan 2014Jan 2016Jan

 13 Percent Portugal 15 Percent Spain
 11 13
 9 11

 7 9

 5 7

 3 5

 1 3
 2004Jan 2006Jan 2008Jan 2010Jan 2012Jan 2014Jan 2016Jan 2004Jan 2006Jan 2008Jan 2010Jan 2012Jan 2014Jan 2016Jan

Share of domestic government debt in banks’ assets. 27
ECB policy before and after
 the financial crisis:
I don’t think we’re in Kansas
 anymore

 ILZETZKI, REINHART AND ROGOFF: EURO PUNCHING 28
What we do: Estimate Taylor Rules for Eurozone
 Economies before and after the financial crisis
• ECB’s main instrument: policy interest rate(s)
• De jure mandate: target Eurozone inflation
• Estimate Taylor rule of the form:
 ∗, , γ , ,

• With possible interest rate inertia:
 1 ∗,
• GMM instruments: 6 lags of inflation and output gap
• Recall Taylor principle requires >1
i: policy interest rate
 , : inflation in country n in month t
 , : output gap measured as unemployment in country n relative to average unemployment 1992-2007.

 ILZETZKI, REINHART AND ROGOFF: EURO PUNCHING 29
What we do (cont.): Consider a
 Horse Race Regression
• Test the hypothesis directly: can we reject that ECB is
 targeting German and not EZ inflation?

 ∗ , γ , , γ , ,

 ILZETZKI, REINHART AND ROGOFF: EURO PUNCHING 30
• We document two phases in ECB policy:
 • “Bundesbank plus”: continuity with the EERM.
 • “Whatever it takes”: expansive credit policies
 with potentially new unintended consequences
 The Euro prior discussion).
 • On the ECB’s de jure inflation targeting we
 Anchor: ask: Whose inflation is targeted?
 • Germany wins the horserace (versus EZ and all

 Main •
 others) prior to the crisis.
 Cannot reject: ECB follows German Taylor principle

takeaways
 • Reject: ECB follows EZ Taylor principle
 • Reject: ECB puts greater weight on EZ than German inflation
 • Cannot reject: ECB puts zero weight on EZ inflation once
 controlling for German inflation
-.5 0 .5 1 1.5

 Austria

 Belgium

 Finland

 France

 Germany

 Greece

 Ireland

 Italy

 Luxembourg

ILZETZKI, REINHART AND ROGOFF: EURO PUNCHING
 Netherlands
 Inflation Coefficients

 Portugal

 Spain

 Euro
32
-1.5 -1 -.5 0 .5 1

 Austria

 Belgium

 Finland

 France

 Germany

 Greece

 Ireland

 Italy

 Luxembourg

ILZETZKI, REINHART AND ROGOFF: EURO PUNCHING
 Netherlands
 Output Gap Coefficients

 Portugal

 Spain

 Euro
33
Horse Race Germany and EZ: Inflation
 Coefficients

 1.5
 1
 .5
 0
 -.5

 Euro
 Germany

 ILZETZKI, REINHART AND ROGOFF: EURO PUNCHING 34
We also consider counterfactual
 Taylor Rules
What would ECB policy look like if it followed a Taylor rule for Germany?
Eurozone? Southern Europe?
Calculate the counterfactual Taylor rule for each country, using Taylor’s (1993)
original values:
 • 1.5
 • 0.5
 ∗, , γ , ,
Takeaway: Any resemblance to a Taylor rule for the EZ is of recent vintage

 ILZETZKI, REINHART AND ROGOFF: EURO PUNCHING 35
Not surprisingly, in line with the view prior
to the crisis in financial markets, ECB policy
was not concerned with fragmentation of EZ
 financial markets or the distinction between
 core and periphery country debt.
 Of more note is that the sustained change in ECB policy
 did not immediately follow the financial (banking) crisis
and that it is only after a debt crisis is underway in much of
the south that changes become systematically discernable.

 Ilzetzki, Reinhart and Rogoff: Euro Punching 36
Taylor Rule vs. ECB Policy
 Germany
12%

 DM DM Regime € Regime

10%

8%

6%
 Rule

4% Policy

2%

0%
 1992 1997 2002 2007 2012

 ILZETZKI, REINHART AND ROGOFF: EURO PUNCHING 37
Taylor Rule vs. ECB Policy
 France
12%

 DM DM Regime € Regime
10%

8%

6%
 Rule

4%

2%
 Policy

0%
 1992 1997 2002 2007 2012

 ILZETZKI, REINHART AND ROGOFF: EURO PUNCHING 38
Taylor Rule vs. ECB Policy
 Portugal
12%
 DM DM Regime € Regime
10%

8%
 Rule

6%

4%

2%
 Policy

0%

-2%

-4%
 1992 1997 2002 2007 2012

 ILZETZKI, REINHART AND ROGOFF: EURO PUNCHING 39
Taylor Rule vs. ECB Policy
 Eurozone
12%

 DM DM Regime € Regime

10%

8%

 Rule
6%

4%

2%
 Policy

0%
 1992 1997 2002 2007 2012

-2%

 ILZETZKI, REINHART AND ROGOFF: EURO PUNCHING 40
Country ρ=0 ρ = 0.9
 Austria 3.71 3.45
 MSE Belgium 6.25 6.03
 between Finland 7.14 6.71
ECB Policy France 3.45 3.55

and Taylor Germany
 Greece
 2.30
 10.91
 2.14
 11.40
 Rules Ireland 33.58 33.34
 Italy 6.06 6.04
 Luxembourg 3.41 3.07
 Netherlands 5.32 5.60
 Portugal 6.18 6.36
 Spain 19.11 19.03
 Euro 4.02 4.03
 ILZETZKI, REINHART AND ROGOFF: EURO PUNCHING 41
Lastly, the secular
decline of the
Eurozone economy

ILZETZKI, REINHART AND ROGOFF: EURO PUNCHING 42
Eurozone's GDP in US Dollars, Actual and Projected: 1991‐2023
(as a share of world GDP and US GDP)
 0.35 1.1

 1
 0.3

 0.9
% of world

 0.25

 % of US
 0.8
 0.2
 0.7

 0.15
 0.6
 Recovery followed by crisis and stagnation
 0.1 0.5
 1991
 1993
 1995
 1997
 1999
 2001
 2003
 2005
 2007
 2009
 2011
 2013
 2015
 2017
 2019
 2021
 2023
 Eurozone/World US/World Eurozone/US right axis

Sources: Authors' calculations based on World Economic Outlook,
International Monetary Fund, April 2019.

 Ilzetzki, Reinhart and Rogoff: Euro Punching 43
• Euro is punching below its weight as international
 currency.
 • May be artefact of natural monopoly in
 international medium of exchange, store of value,
 unit of account
 • Scarcity of euro safe assets may be a key
Summary contributor, as debt markets have become both
 fragmented within the EZ and other factors have
 and next impaired debt market liquidity, making Euro
 assets less globally attractive.
 steps • The nature and extent of market illiquidity merits
 closer scrutiny, as does the question of hysteresis.
 • The extent to which China’s role in global finance
 may be contributing to a mismeasurement of the
 global usage of the US dollar and the Euro also
 warrants further study.
You can also read