A Power Law for Cybercrime - Deepak Chandarana & Richard Overill Department of Computer Science King's College London
←
→
Page content transcription
If your browser does not render page correctly, please read the page content below
A Power Law for Cybercrime

 Deepak Chandarana & Richard Overill
   Department of Computer Science
       King’s College London
      richard.overill@kcl.ac.uk
Overview
Introduction to cybercrime
Power law characterisation
Examples of power law relationships
Data collection
Results of analysis
Interpretation of results
Conclusion
2Introduction
Cybercrime refers to Internet and computer
related crime
Credit card fraud, Financial fraud, Identity fraud,
Cyber-extortion, Cyber-sabotage, Cyber-espionage,...
Viruses, Worms, Logic Bombs, Trojan Horses, RATs,
Rootkits, Denial of Service attacks, Phishing attacks,..
A growing and evolving form of crime
Cost estimated at £1.5 trillion pa world-wide
Poses many challenges for organisations,
governments and law enforcement
3Who carries out Cybercrime?
Insiders (employees)
Hackers (cyber-mercenaries)
Criminals (serious & organised crime)
Terrorists (sub-state groups)
Corporations (commercial espionage)
Government agencies (counterintelligence)
4Their Motives
There are many motives:
Revenge, ideology, competition, money, influence
Two main classes:
Intrinsic: motivated by internal factors
Extrinsic: motivated by external factors
These motivations may also be combined
5Power Law Characterisation
Probability of measuring a particular value of some
quantity varies inversely as a power of that value
−α
p( x) = Cx
α is the exponent of the power law
C is the probability normalisation constant
If logarithms are taken:
log( p ( x )) = −α log( x ) + log(C )
Has a straight line form with gradient -α:
y = mx + c
6Histograms - 1
Number of values that fit into a data range is
counted
Midpoint of the range is plotted on the x-axis
Frequency of each range is plotted on the y-axis
Problems with histograms:
Trends can be hidden
What bin size to use?
Noise in the tail (due to low frequency values)
7Histograms -2
Logarithmic scales
Problem of noise in the tail (Newman, 2005)
Partially overcome noise by using logarithmic binning.
Vary the sizes of the bins using a fixed multiplier
8Cumulative Distribution Function (CDF)
The CDF defines the probability P(Xx) that
X has a value greater than x
X is plotted on the x-axis (the abscissa)
CDF/CCDF is plotted on the y-axis (the ordinate)
Advantage 1: the CDF is well-defined for values of X which
have low probability (the tail)
Advantage 2: the CDF on a log-log plot is a straight line
with gradient -(α-1)
9Calculating the Exponent α
Line of best fit (linear regression) introduces
serious inaccuracies (Goldstein et al., 2004)
Use a MLE formula for α (Newman, 2005):
−1
⎡ n
xi ⎤
α = 1 + n ⎢ ∑ ln ⎥
⎣ i =1 xmin ⎦
n is the number of points
xi, i = 1…n are the measured values of x
xmin is the minimum value of x for which the power
law behaviour holds - power laws diverge as x
approaches zero
10Calculating xmin
The distribution deviates from the power law below xmin
Solar Flare example (Newman, 2005):
xmin obtained by inspection of the graph is not accurate
Use the Kolmogorov-Smirnov D-statistic to determine xmin
from a goodness-of-fit test against the empirical CDF:
D=maxi(P(X>=xi) - (n-i)/n, (n-i+1)/n - P(X>=xi))
11Fatal Quarrels
Lewis Fry Richardson
(1948) carried out work
into the statistics of fatal
quarrels from 1820-1945
Data was placed into
ranges and plotted on
logarithmic scales
12Conventional War
Newman (2005)
considered the
cumulative distribution
of the intensity of 119
wars from 1816-1980
He calculated the
exponent to be 1.80
13Terrorism
Clauset & Young (2005)
considered terrorist
attacks 1968-2004
They divided events
into two categories:
G7 countries follow a
power law with exponent
1.71
Non-G7 countries have
an exponent of 2.5
14Why different Exponents?
Terrorist attacks in industrialised nations are
relatively rare but tend to be large when they
do occur (higher levels of security)
Attacks in the less industrialised world tend to
be smaller, but more frequent, events (lower
levels of security)
15Aims of this research
Investigate whether cybercrime conforms to a
power law model
Compare with conventional war and terrorism
models
16Collecting & Selecting the Data
Many data sources were initially considered
(UK DTI, UK NHTCU, ACCSS, etc.)
Computer Security Institute / Federal Bureau of
Investigation (CSI/FBI) Annual Computer
Crime and Security Survey was finally selected
Most complete historical data set (1997-2006)
x-value = total amount of money lost from an
attack (direct + collateral losses) in $US
Crimes for which the historical data set is
incomplete (e.g. web-site defacement) are
omitted, but are used in re-sampling tests
17Cumulative Distribution Function
Produces a curve, not a straight line, indicating that a single
power law relationship does not exist
18Dividing the Curve - 1
19Dividing the Curve -2
Graph is divided into left and right sides
To get an overall fit the weighted Pearson’s product
moment correlation coefficient is optimised wrt the
position of the dividing point:
nl = the number of points on the left side of the graph
nr = the number of points on the right side of the graph
rl 2 = correlation coefficient for the left side
rr2 = correlation coefficient for the right side
n = nl + nr
r 2 = weighted mean of the correlation coefficient of the graph
nl .rl 2 + nr .rr2
r =
2
n
20Dividing the Curve - 3
21Division of Crimes - 1
Calculate percentage of data points each type
of crime represents
To identify the most prevalent crimes:
Absolute test: A crime that represents less than
10% of the data is not considered
Relative test: If a crime appears on both sides and
if its percentage on one side is less than half its
percentage on the other side then the smaller
percentage is not considered
22Division of Crimes - 2
Total Annual Losses ($)
Crimes on Left Side Insider Abuse of Net Access
Laptop Theft
Sabotage of Data of Networks
System Penetration
Telecom Fraud
Unauthorised Insider Access
Crimes on Right Side Financial Fraud
Insider Abuse of Net Access
Theft of Proprietary Information
Malware: viruses, worms, Trojans
23Division of Crimes - 3
Left side = intrinsic (and combined) crimes
Right side = extrinsic crimes
Primarily money motivated
Follow a more targeted and organised approach
Organised crime in cybercrime
May also be an element of crimes on the left side
Why is organised crime in cybercrime?
Anonymity of the Internet
Trans-border in nature
Weak international laws
Big money to be made!
24What does the Exponent tell us? - 1
Cybercrime Cybercrime Conventional G7 Non-G7
90 subset) (122 set) war Terrorism Terrorism
Left 1.78 1.60
Side
1.80 1.71 2.5
Right 2.60 2.55
Side
25What does the Exponent tell us? - 2
Crimes on the right side are targeted against
larger organisations with stronger defensive
measures
The attacks succeed less frequently, but are
large events when they do happen
The attacks on the left side are smaller in
scale and carried out on organisations with
weaker defences
The attacks succeed with greater frequency,
but have a smaller financial impact
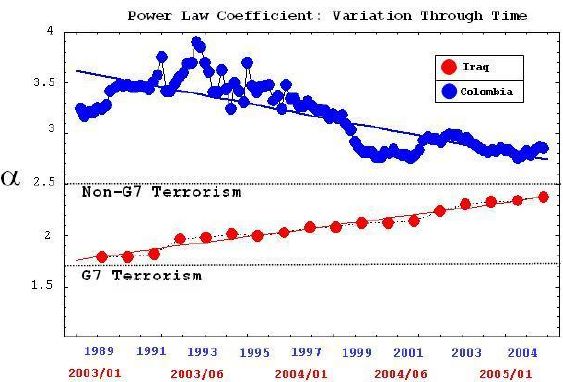
26Adapting the Model - 1
Johnson et al.
(2005) analysed the
ongoing conflicts in
Colombia and Iraq
between 1988-2004
They considered
how the power law
exponent changed
over time
27Adapting the Model - 2
They put forward a model of insurgent warfare to
explain the power law behaviour of conventional war
and terrorism
We adapt this model to the domain of cybercrime
Attack unit - group of people that can organise
themselves to act as a single unit
Attack strength - amount of money lost due to an
event carried out by this attack unit
Strength of the attack unit depends on the skill of its
members and the electronic weapons they possess
28Adapting the Model - 3
The left side gives a similar picture to war:
There can be a wide distribution of attack units
Crimes such as System Penetration or
Unauthorised Insider Access can be carried out
by a single person or a group of attackers
These attack units have different attack strengths
As a result there is a wider variation in crimes that
occur on the left side compared to the right side
29Adapting the Model - 4
The right side is comparable to terrorism in
non-G7 countries
More organised nature of the crimes
Consider an organised crime group bringing
together a number of hackers to form an attack
unit of a specific strength
Carry out the attack then disperse the group to
help avoid detection
More transient attack units whose attack strengths
change dynamically due to their continual
fragmentation and coalescence.
30Implications
Organisations, governments and law
enforcement agencies are fighting enemies
with two different attack styles and motivations
The left side contains crimes of a more
intrinsic nature
Variations in the size and strength of attack units
Attack units are more static in structure
The right side contains crimes of a more
extrinsic nature
Attack units are more dynamic in structure
31Summary & Conclusions
Reviewed the power law relationships found in
warfare
For cyber-crime (in USA) a single power law
relationship does not exist
Evidence to indicate that a double power law
relationship holds
Left side characteristic of conventional warfare
Right side characteristic of non-G7 terrorism
32References
L F Richardson (1948) J Amer Stat Assoc 43 523-546
L F Richardson (1960) Statistics of Deadly Quarrels, Boxwood
Press
L-E Cederman (2003) Amer Polit Sci Rev 97 135-150
M L Goldstein et al. (2004) Eur Phys J B41 255-258
M E J Newman (2005) Contemp Phys 46 323-351
A Clauset & M Young (2005) arxiv.org/abs/physics/0502014/
N Johnson et al. (2005) arxiv.org/abs/physics/0506213/
D Chandarana & R E Overill (2007) J Information Warfare
(to be submitted)
33Questions
34You can also read