The new genetics of intelligence - Gwern.net

Page created by Joe May
 
CONTINUE READING
The new genetics of intelligence - Gwern.net
REVIEWS
                                   The new genetics of intelligence
                                   Robert Plomin1 and Sophie von Stumm2
                                   Abstract | Intelligence — the ability to learn, reason and solve problems — is at the forefront of
                                   behavioural genetic research. Intelligence is highly heritable and predicts important educational,
                                   occupational and health outcomes better than any other trait. Recent genome-wide association
                                   studies have successfully identified inherited genome sequence differences that account for 20%
                                   of the 50% heritability of intelligence. These findings open new avenues for research into the
                                   causes and consequences of intelligence using genome-wide polygenic scores that aggregate
                                   the effects of thousands of genetic variants.

Twin studies
                                  Life is an intelligence test. During the school years,       (GWAS) focused on a very different variable — years of
Studies comparing the             differences in intelligence are largely the reason why       education. In this Review, we discuss early attempts to
resemblance of identical and      some children master the curriculum more readily             find the inherited genetic differences that account for
fraternal twins to estimate       than other children. Differences in school performance       the substantial heritability of intelligence, and a twist of
genetic and environmental
                                  predominantly inform prospects for further education,        fate involving GWAS on years of education, before dis­
components of variance.
                                  which in turn lead to social and economic opportuni­         cussing the results of recent large GWAS on intelligence.
Variance                          ties such as those related to occupation and income. In      The second half of this Review focuses on genome-wide
An index of how spread out        the world of work, intelligence matters beyond educa­        polygenic scores (GPSs) for intelligence that aggregate the
scores are in a study             tional attainment because it involves the ability to adapt   effects of thousands of DNA variants associated with
population, which is calculated
as the average of the squared
                                  to novel challenges and tasks that describe the different    intelligence across the genome (see BOX 2 for how GPSs
deviations from the mean.         levels of complexity of occupations. Intelligence also       are constructed). We illustrate how GPSs for intelligence
                                  spills over into many aspects of everyday life, such as      will transform research on the causes and consequences
Genome-wide association           the selection of romantic partners and choices about         of individual differences in intelligence before ending
studies
                                  health care1. This is why intelligence — often called        with a discussion of societal and ethical implications.
(GWAS). Studies that aim to
identify loci throughout the
                                  general cognitive ability 2 — predicts educational           We do not discuss other important research related to
genome associated with an         outcomes3, occupational outcomes4,5 and health out­          intelligence, such as evolutionary research16,17 and neuro­
observed trait or disorder.       comes6 better than any other trait. It is also the most      science research15, in order to focus on the role of GPSs
                                  stable psycho­logical trait, with a Pearson correlation      in the new genetics of intelligence.
Heritability
The proportion of observed
                                  co­­efficient of 0.54 from 11 to 90 years of age7. BOX 1
differences among individuals     describes what intelligence is and how it is assessed.       Finding the heritability of intelligence
that can be attributed to              During the past century, genetic research on intel­     Similar to results for many other complex traits, early
inherited differences in          ligence was in the eye of the storm of the nature–           results for intelligence were disappointing for more than
genome sequence.
                                  nurture debate in the social sciences8,9. In the 1970s and   100 candidate gene studies18 and for seven GWAS19–25.
                                  1980s, intelligence research and its advocates were vili­    From the 1990s until 2017, no replicable associations
                                  fied10–12. The controversy was helpful in that it raised     were found. GPSs from these early GWAS, which we
1
 Institute of Psychiatry,         the quality and quantity threshold for the acceptance of     refer to collectively as ‘IQ1’, predicted only 1% of the var­
Psychology and
                                  genetic research on intelligence. As a result, bigger and    iance of intelligence in independent samples. It became
Neuroscience, King’s College
London, 16 De Crespigny           better family studies, twin studies and adoption studies     clear that the problem was power: the largest effect sizes
Park, London SE5 8AF, UK.         have amassed a mountain of evidence that consistently        of associations between individual single-nucleotide
2
 Department of Psychological      showed substantial genetic influence on individual dif­      polymorphisms (SNPs) and intelligence were extremely
and Behavioural Science,
                                  ferences in intelligence13. Meta-analyses of this evidence   small, accounting for less than 0.05% of the variance of
London School of Economics
and Political Science, Queens
                                  indicate that inherited differences in DNA sequence          intelligence. The average effect size of the tens of thou­
House, 55–56 Lincoln’s Inn        account for about half of the variance in measures of        sands of SNPs needed to explain the 50% heritability of
Fields, London WC2A 3LJ, UK.      intelligence14.                                              intelligence is of course much lower. If the average effect
robert.plomin@kcl.ac.uk;               These studies and applications in neuroscience15 were   size is 0.005%, 10,000 such SNP associations would be
s.von-stumm@lse.ac.uk             already pushing intelligence research towards rehabili­      needed to explain the 50% heritability of intelligence. To
doi:10.1038/nrg.2017.104          tation when it was thrust to the forefront of the DNA        achieve sufficient power for detecting such small effect
Published online 8 Jan 2018       revolution 4 years ago by genome-wide association studies    sizes (that is, power of 80%, P = 0.05, one-tailed), sample

NATURE REVIEWS | GENETICS                                                                                             ADVANCE ONLINE PUBLICATION | 1
                                             ©
                                             2
                                             0
                                             1
                                             8
                                             M
                                             a
                                             c
                                             m
                                             i
                                             l
                                             l
                                             a
                                             n
                                             P
                                             u
                                             b
                                             l
                                             i
                                             s
                                             h
                                             e
                                             r
                                             s
                                             L
                                             i
                                             m
                                             i
                                             t
                                             e
                                             d
                                             ,
                                             p
                                             a
                                             r
                                             t
                                             o
                                             f
                                             S
                                             p
                                             r
                                             i
                                             n
                                             g
                                             e
                                             r
                                             N
                                             a
                                             t
                                             u
                                             r
                                             e
                                             .
                                             A
                                             l
                                             l
                                             r
                                             i
                                             g
                                             h
                                             t
                                             s
                                             r
                                             e
                                             s
                                             e
                                             r
                                             v
                                             e
                                             d
                                             .
REVIEWS

Genome-wide polygenic                sizes greater than 250,000 are required. Early IQ GWAS        associations in a sample of 125,000 individuals from
scores                               had sample sizes from 18,000 to 54,000, which seemed          54 cohorts28. These associations could be replicated in
(GPSs). Genetic indices of a         large at the time but were not sufficiently powered to        independent samples29. The largest effect size associated
trait for each individual that are   detect such small effects.                                    with an individual SNP accounted for a meagre 0.02%
the sum across the genome of
thousands of single-nucleotide
                                                                                                   of the variation, equivalent to about 2 months of edu­
polymorphisms (SNPs) of the          Breakthrough for years of education. A breakthrough           cation. Although individual SNPs of such minuscule
individual’s increasing alleles      for intelligence research came from the unlikely vari­        effect size are fairly useless for prediction, a GPS based
associated with the trait,           able of the number of years spent in full-time educa­         on all SNPs regardless of the strength of their association
usually weighted by the effect
                                     tion, often referred to as educational attainment. Because    with years of education predicted 2% of the variance in
size of each SNP’s association
with the trait in genome-wide
                                     ‘years of education’ is obtained as a demographic marker      years of education in independent samples28,29. We refer
association studies.                 in nearly every GWAS, it was possible to accumulate           to this GPS as ‘EA1’ (where EA stands for educational
                                     sample sizes with the necessary power to detect very          attainment).
Candidate gene studies               small effect sizes26. Its relevance to intelligence is that       Spurred on by this success, in 2016, a second
Studies that focus on genes for
which the function suggests that
                                     years of education is highly correlated phenotypically        meta-analytic GWAS analysis with a sample size of
they are associated with a trait,    (0.50) and genetically (0.65) with intelligence27.            294,000 identified 74 significant loci 30. This anal­
in contrast to genome-wide              In 2013, a meta-analytic GWAS analysis of years of         ysis produced a GPS, EA2, that predicted 3% of
association studies.                 education yielded three genome-wide significant SNP           the variance in years of education on average in

 Box 1 | What is intelligence?

 Intelligence can be broadly defined as the ability to learn, reason and             same time that Mendel’s laws of inheritance were rediscovered. The
 solve problems74. It is a latent trait that cannot be directly observed but         g‑factor exemplifies the generalist nature of intelligence as a complex
 is inferred from a battery of diverse cognitive test scores, as in widely           trait that penetrates many behavioural and psychological outcomes,
 used ‘intelligence tests’ that yield a so‑called IQ score, in which IQ is an        including educational attainment, occupational status, health and
 acronym for an outdated concept of an ‘intelligence quotient’.                      longevity77,78.
 Psychometric tests of cognitive abilities differ widely in form and                    Individual differences in intelligence are fairly stable across the
 content. For example, some psychometric tests assess verbal ability and             lifespan, especially from teenage years onwards, with correlations of 0.6
 others, nonverbal ability; some give strict time limits, and some are               and above32,79. However, intelligence is also subject to change, both
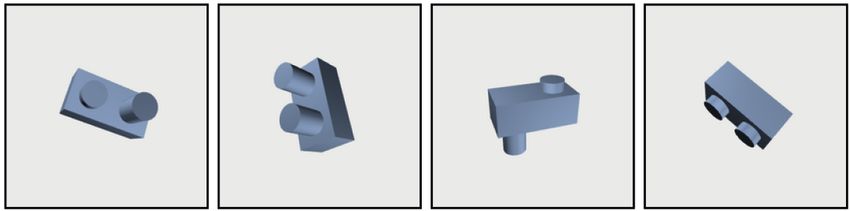
 untimed (see figure for examples). Notwithstanding these differences,               within and between individuals. For example, scores from timed
 cognitive test scores are positively intercorrelated75, suggesting that             cognitive tests tend to peak in young adulthood and decline
 any differences in test scores that occur within an individual are smaller          thereafter80. More importantly, intelligence has been shown to be
 than test score differences that exist between individuals. In other                malleable, especially in children, through major systematic
 words, a person who scores high on one type of cognitive test relative to           interventions, such as education81, dietary supplementation82 or
 other people will also do comparatively well on other cognitive tests.              adopting children away from impoverished home environments83.
 This phenomenon is known as the positive manifold, or simply ‘g’, the               That said, identifying ways to effectively improve intelligence remains a
 general factor of intelligence, which emerges from the test scores’                 key challenge for intelligence research, with many interventions failing
 covariance and was discovered by Spearman in 1904 (REF. 76), about the              to produce reliable and long-term positive effects82,84,85.

   Missing letter                                                                Complete the sentence
   Which one letter completes these words?                                       Which two words complete the sentence?
   CA*                                                                           Fingers are to nails/fish/gloves/hands
   *US                                                                           as toes are to tip/feet/flip-flops/running.
   RU*Y
   *OTH

   Complete the sequence                                                         Match the shape

                                                            ?

   Which picture completes the pattern above?                                    Which of the four options is the same object shown above?

                                                                                                                                  Nature Reviews | Genetics
2 | ADVANCE ONLINE PUBLICATION                                                                                                           www.nature.com/nrg
                                                 ©
                                                 2
                                                 0
                                                 1
                                                 8
                                                 M
                                                 a
                                                 c
                                                 m
                                                 i
                                                 l
                                                 l
                                                 a
                                                 n
                                                 P
                                                 u
                                                 b
                                                 l
                                                 i
                                                 s
                                                 h
                                                 e
                                                 r
                                                 s
                                                 L
                                                 i
                                                 m
                                                 i
                                                 t
                                                 e
                                                 d
                                                 ,
                                                 p
                                                 a
                                                 r
                                                 t
                                                 o
                                                 f
                                                 S
                                                 p
                                                 r
                                                 i
                                                 n
                                                 g
                                                 e
                                                 r
                                                 N
                                                 a
                                                 t
                                                 u
                                                 r
                                                 e
                                                 .
                                                 A
                                                 l
                                                 l
                                                 r
                                                 i
                                                 g
                                                 h
                                                 t
                                                 s
                                                 r
                                                 e
                                                 s
                                                 e
                                                 r
                                                 v
                                                 e
                                                 d
                                                 .
REVIEWS

                                 independent samples30. Surprisingly, GPSs for years of edu­       more than 10% of the variance in intelligence. The effect
                                 cation predicted more variance in intelligence than they          size of the EA3 GPS for predicting intelligence is likely
                                 predicted for the GWAS target trait of years of educa­            to rival that of family socio-economic status, which is
                                 tion27. For example, the EA2 GPS predicts 3% of the               indexed by parents’ years of education. Across studies,
                                 variance in years of education but it predicts 4% of              the correlation value for parents’ education with chil­
                                 the variance in intelligence30. A third GWAS currently in         dren’s intelligence is 0.30, implying that it accounts for
                                 progress includes more than 1 million participants, mak­          9% of the variance in children’s intelligence32. However,
                                 ing it the largest GWAS for any trait to date. Preliminary        this association is confounded by genetics because
                                 results from this GWAS have identified more than 1,000            children inherit the DNA differences that predict their
                                 significant associations and a GPS, EA3, that predicts            intelligence from their parents. Furthermore, parental
                                 more than 10% of the variance in years of education in            phenotypes, such as education, estimate only an aver­
                                 independent samples31 (P. D. Koellinger, personal com­            age association for offspring, whereas GPSs predict
                                 munication). Hence, the EA3 GPS is expected to predict            intelligence for each individual.

                                  Box 2 | Creating genome-wide polygenic scores
                                  Thousands of single-nucleotide polymorphisms (SNPs) are needed to account for the heritability of intelligence and other
                                  complex traits because the effect sizes of SNP associations are so small. Aggregating thousands of these minuscule
                                  effects in a genome-wide polygenic score (GPS) is the crux of the new genetics of intelligence. There are at least a dozen
                                  labels to denote GPSs. Most involve the word ‘risk’, such as polygenic risk scores. We prefer the term ‘genome-wide
                                  polygenic score’ because ‘risk’ does not apply to quantitative traits, such as intelligence, that have positive as well as
                                  negative poles86. The ‘genome-wide’ addition to ‘polygenic score’ distinguishes GPSs from polygenic scores that
                                  aggregate candidate genes or just the top hits from genome-wide association studies (GWAS). Finally, another reason for
                                  using the acronym GPS is that we cannot resist the metaphor of the other ‘GPS’, global positioning system. We see IQ
                                  GPSs as a system to triangulate on the genetics of intelligence from all domains of the life sciences.
                                    An intelligence test score is a composite of several tests, often with each test weighted by its contribution to general
                                  intelligence. In the same way, a GPS is a composite of SNP associations, weighted by their correlation with the trait. The
                                  table shows how a GPS could be constructed for one individual for ten SNPs. GWAS results are used to determine which
                                  of the two alleles for a SNP is positively associated with the trait, called the ‘increasing allele’. For each SNP, a genotypic
                                  score is created by adding the number of increasing alleles. A GPS sums the number of increasing alleles across SNPs,
                                  which is why this is called an additive model. In this example, the individual’s GPS is 9. Because there are 10 SNPs, the
                                  possible range of the GPS is from 0 to 20.
                                    A more predictive GPS can be constructed by weighting each genotypic score by the effect size of the SNP (β for
                                  quantitative traits, odds ratio for qualitative traits) as gleaned from GWAS results (see table). For instance, for SNP 1, the
                                  correlation with the trait is five times greater than for SNP 10. Multiplying the genotypic score by the correlation gives a
                                  weighted genotypic score (see table, last column). Summing these weighted genotypic scores gives this individual a
                                  GPS of 0.023 for intelligence. Other ways to improve the predictive power of GPSs include taking into account expected
                                  SNP effect sizes, the genetic architecture of the trait and specifically modelling linkage disequilibrium87.
                                  Programmes including LDpred88 and PRSice89 provide pipelines for the construction of GPSs.
                                    How many SNPs should be included in a GPS? The goal is to maximize predictive power in samples independent from
                                  the GWAS samples. The use of only genome-wide significant hits does not predict nearly as well as the use of tens of
                                  thousands of SNPs. LDpred uses all SNPs, imputed as well as measured, although most SNPs are given near-zero weights.
                                    Once a GPS for intelligence is created for each individual in a sample, it can be used like any other variable in analyses.
                                  For example, it can be used to investigate the extent to which this genetic index of intelligence mediates or moderates
                                  effects on variables of primary interest to the researcher.

                                   SNP                   Increasing      Allele 1         Allele 2         Genotypic        Correlation     Weighted
                                                         allele                                            score            with trait      genotypic score
                                   SNP 1                 T               A                T                1                0.005           0.005
                                   SNP 2                 C               G                G                0                0.004           0.000
                                   SNP 3                 A               A                A                2                0.003           0.006
                                   SNP 4                 G               C                G                1                0.003           0.003
Effect sizes
                                   SNP 5                 G               C                C                0                0.003           0.000
Proportions of variance of
traits in the study population     SNP 6                 T               A                T                1                0.002           0.002
accounted for by a particular
factor such as a genome-wide
                                   SNP 7                 C               C                G                1                0.002           0.002
polygenic score.                   SNP 8                 A               A                A                2                0.002           0.004
Single-nucleotide                  SNP 9                 A               T                T                0                0.001           0.000
polymorphisms                      SNP 10                C               C                G                1                0.001           0.001
(SNPs). Single base pair
differences in inherited DNA       Polygenic score                                                         9                                0.023
sequence between individuals.

NATURE REVIEWS | GENETICS                                                                                                   ADVANCE ONLINE PUBLICATION | 3
                                             ©
                                             2
                                             0
                                             1
                                             8
                                             M
                                             a
                                             c
                                             m
                                             i
                                             l
                                             l
                                             a
                                             n
                                             P
                                             u
                                             b
                                             l
                                             i
                                             s
                                             h
                                             e
                                             r
                                             s
                                             L
                                             i
                                             m
                                             i
                                             t
                                             e
                                             d
                                             ,
                                             p
                                             a
                                             r
                                             t
                                             o
                                             f
                                             S
                                             p
                                             r
                                             i
                                             n
                                             g
                                             e
                                             r
                                             N
                                             a
                                             t
                                             u
                                             r
                                             e
                                             .
                                             A
                                             l
                                             l
                                             r
                                             i
                                             g
                                             h
                                             t
                                             s
                                             r
                                             e
                                             s
                                             e
                                             r
                                             v
                                             e
                                             d
                                             .
REVIEWS

                                                                      Large-scale genome-wide association studies of intelli-      preliminary analyses of the latest meta-analytic GWAS
                                                                      gence. In 2017, the largest GWAS meta-analysis of intel­     (EA3) with a sample size of more than 1 million31 (P. D.
                                                                      ligence, which included ‘only’ 78,000 individuals, yielded   Koellinger, personal communication). We can expect a
                                                                      18 genome-wide significant regions33. A GPS (IQ2)            similar jump in the predictive power of the IQ GPS when
                                                                      derived from these GWAS results finally broke the 1%         the sample size for GWAS meta-analyses of intelligence
                                                                      barrier of previous GWAS of intelligence by predicting       exceeds 1 million. However, it is more difficult to obtain
                                                                      3% of the variance of intelligence in independent sam­       very large sample sizes for intelligence, which has to be
                                                                      ples. However, IQ2 still has less predictive power than      tested, than for years of education, which can be assessed
                                                                      the 4% of the variance explained by the EA2 GPS.             with a single self-reported item.
                                                                          A follow‑up GWAS meta-analysis reached a sample
                                                                      size of 280,000 with the inclusion of cognitive data from    Missing heritability. It is possible to use multiple GPSs
                                                                      the UK Biobank. This GWAS analysis increased the             to boost the power to predict intelligence by aggre­
                                                                      number of identified genome-wide significant regions         gating GPSs in a way analogous to aggregating SNPs to
                                                                      from 18 to 206 (REF. 34). A GPS derived from these           produce GPSs (BOX 3). Including the EA2 GPS, IQ2 GPS
                                                                      GWAS analyses, IQ3, predicts about 4% of the variance        and other GPSs in this multivariate way can already
                                                                      of intelligence in independent samples34. Other meta-­       predict up to 7% of the variance in intelligence36,37.
                                                                      analytic GWAS using the UK Biobank data, which were          Multivariate GPS analyses that incorporate multiple
                                                                      released in June 2017 and are publicly available, yield      GPSs in addition to the EA2 GPS and IQ2 GPS will
                                                                      similar results35.                                           explain substantially more than 10% of the variance
                                                                          These IQ and EA GPS results are summarized in            in intelligence, which is more than 20% of the 50%
                                                                      FIG. 1. It might seem disappointing that the increase        heritability of intelligence.
                                                                      of the intelligence GWAS sample sizes from 78,000 to             Nonetheless, 10% is a long way from the heritability
                                                                      280,000 boosted the predictive power of the IQ GPS           estimate of 50% obtained from twin studies of intel­
                                                                      only from 3% to 4%. However, this result is parallel to      ligence14. This gap is known as ‘missing heritability’,
                                                                      GWAS results for years of education: after increasing        which is a key genetic issue for all complex traits in the
                                                                      sample sizes from 125,000 to 294,000, the variance in        life sciences38 (BOX 4). The current limit for the variance
                                                                      years of education predicted by the EA GPS grew only         that can be predicted by GPSs is SNP heritability, which
                                                                      from 2% to 3%. Note that the predictive power of the         estimates the extent to which phenotypic variance for a
                                                                      EA GPS jumped to more than 10% of the variance in            trait can be explained by SNPs across the genome with­
                                                                                                                                   out identifying specific SNP associations. For intelligence,
                                                                                                                                   SNP heritability is about 25%34,39. It is safe to assume
                                        12                                                                                         that GPSs for intelligence using current SNP chips can
                                        11                                                                                         approach the SNP heritability limit of 25% by amassing
                                                                                                                            EA3    ever-larger GWAS samples and by using multitrait GWAS
Percentage of variance explained (r2)

                                        10
                                                                                                                                   that include traits related to intelligence, such as years of
                                         9
                                                                                                                                   education. However, breaking through this ceiling of 25%
                                         8                                                                                         SNP heritability to the 50% heritability estimated from
                                         7                                                                                         twin studies — assuming that twin studies yield accurate
                                                                                                                                   estimates of the total variance explained by inherited DNA
                                         6
                                                                                                                                   differences — will require different technologies, such as
                                         5                                                                                         whole-genome sequencing data that include rare variants,
                                                               IQ3
                                         4                                                                                         not just the common SNPs used on current SNP chips.
                                             IQ2
                                         3
                                                                EA2                                                                GPSs in intelligence research
                                         2
                                                   EA1                                                                 IQ          A bottom‑up approach to intelligence focused on
                                         1                                                                             EA
                                             IQ1                                                                                   specific genes will be difficult for three reasons. First,
                                         0                                                                                         genetic effects are extremely pleiotropic. Second, many
                                              100        200    300      400     500     600     700     800     900    1,000
                                                                                                                                   hits are in intergenic regions, which means that there
                                                                          GWAS sample size (×1,000)
                                                                                                                                   are no ‘genes’ to trace through the brain to behaviour.
   Figure 1 | Variance explained by IQ GPSs and by EA GPSs in their target traits as                                               Third, the biggest hits have minuscule effects — less than
                                                                        Nature Reviews | Genetics
   a function of GWAS sample size. Genome-wide polygenic score (GPS) prediction                                                    0.05% of the variance — which means that hundreds of
   of intelligence (IQ) and educational attainment (EA) increased linearly with sample                                             thousands of SNP associations are needed to account
   size. The predictive power of GPSs derived from genome-wide association studies                                                 for the 50% heritability estimated by twin studies. A sys­
   (GWAS) of intelligence has increased in the past 2 years from 1% to 4%. The latest EA                                           tems biology approach to molecular studies of the brain
   GPS, EA3, predicts more than 10% of the variance in intelligence (P. D. Koellinger,                                             is needed that is compatible with this extreme pleiotropy
   personal communication) — more than twice as much as the latest IQ3 GPS.
                                                                                                                                   and polygenicity 40.
   Extrapolating from the results of EA3 with a sample size of more than 1 million, we
   predict that more than 10% of the variance in intelligence will be predicted from IQ
                                                                                                                                       By contrast, the top-down approach of GPSs that
   GPSs derived from a GWAS of intelligence with a sample size of 1 million. IQ1                                                   aggregate thousands of these tiny effects is already
   (REF. 22): n = 54,000, r2 = 0.01. IQ2 (REF. 33): n = 78,000, r2 = 0.03. IQ3 (REF. 34):                                          transforming research on intelligence41. Unlike quanti­
   n = 280,000, r2 = 0.04. EA1 (REF. 28): n = 125,000, r2 = 0.02. EA2 (REF. 30): n = 294,000,                                      tative genetic studies that require special samples, such
   r2 = 0.03. EA3 (REF. 31): n = 1,100,000, r2 >0.10.                                                                              as twins, or GWAS that require very large samples in

   4 | ADVANCE ONLINE PUBLICATION                                                                                                                                         www.nature.com/nrg
                                                                                 ©
                                                                                 2
                                                                                 0
                                                                                 1
                                                                                 8
                                                                                 M
                                                                                 a
                                                                                 c
                                                                                 m
                                                                                 i
                                                                                 l
                                                                                 l
                                                                                 a
                                                                                 n
                                                                                 P
                                                                                 u
                                                                                 b
                                                                                 l
                                                                                 i
                                                                                 s
                                                                                 h
                                                                                 e
                                                                                 r
                                                                                 s
                                                                                 L
                                                                                 i
                                                                                 m
                                                                                 i
                                                                                 t
                                                                                 e
                                                                                 d
                                                                                 ,
                                                                                 p
                                                                                 a
                                                                                 r
                                                                                 t
                                                                                 o
                                                                                 f
                                                                                 S
                                                                                 p
                                                                                 r
                                                                                 i
                                                                                 n
                                                                                 g
                                                                                 e
                                                                                 r
                                                                                 N
                                                                                 a
                                                                                 t
                                                                                 u
                                                                                 r
                                                                                 e
                                                                                 .
                                                                                 A
                                                                                 l
                                                                                 l
                                                                                 r
                                                                                 i
                                                                                 g
                                                                                 h
                                                                                 t
                                                                                 s
                                                                                 r
                                                                                 e
                                                                                 s
                                                                                 e
                                                                                 r
                                                                                 v
                                                                                 e
                                                                                 d
                                                                                 .
REVIEWS

 Box 3 | The use of multiple genome-wide polygenic scores to predict a trait                       GPSs are unbiased in the sense that they are not sub­
                                                                                               ject to training, faking or anxiety. They are also inexpen­
 Aggregating thousands of single-nucleotide polymorphism (SNP) associations in                 sive, costing less than US$100 per person. This expense
 genome-wide polygenic scores (GPSs) has been key to predicting individual differences         would not be incurred specifically to predict intelligence;
 in complex traits such as intelligence. In an analogous manner, it is possible to             the same SNP chip genotype information used in GWAS
 aggregate many GPSs to exploit their joint predictive power. For example, multiple
                                                                                               can be used to create GPSs for hundreds of disorders and
 GPSs were used to predict intelligence in a sample of 6,710 unrelated 12‑year-old
 children36. This approach is a multiple regression prediction model that accommodates         traits, one of which is intelligence.
 multiple correlated predictors while preventing overfitting on the basis of training in           GPSs for intelligence will open new avenues for
 one sample and testing in another sample in a repeated cross-validation design. This          research into the causes and consequences of intelli­
 approach predicted 4.8% of the variance in intelligence. Although the EA2 GPS alone           gence. Three examples are developmental change and
 accounted for most of the variance, other GPSs added significantly to the prediction of       continuity, multivariate links between traits and gene–
 intelligence, especially GPSs derived from genome-wide association studies (GWAS) of          environment (GE) interplay. A critical requirement
 high‑IQ individuals57, childhood IQ19 and household income90. More than 7% of the             for capitalizing on these opportunities is to make the
 variance in intelligence was predicted37 through the use of another approach called           ingredients for GPSs publicly available — that is, GWAS
 multitrait analysis of GWAS (MTAG)91, which performs a meta-analysis from summary             summary-level statistics (BOX 5).
 statistics for a few correlated GPSs and produces new summary statistics that can be
 used to create a multivariate GPS.
   The success of GWAS comes from their atheoretical approach that analyses all SNPs           Developmental research. One of the most interesting
 in the genome rather than selecting candidate genes. In the same way, an atheoretical         developmental findings about intelligence is that its
 approach can be used in analyses of multiple GPSs by incorporating as many GPSs as            heritability as estimated in twin studies increases dra­
 possible rather than selecting a few candidate GPSs. For example, the first study of this     matically from infancy (20%) to childhood (40%) to
 sort, mentioned above36, included a total of 81 GPSs from well-powered GWAS of                adulthood (60%), whereas age‑to‑age genetic corre­
 cognitive, medical and anthropometric traits available in LD Hub92 that together              lations are consistently high43,44. What could account
 predicted 4.8% of the variance in intelligence. Although EA2, IQ and income GPSs              for this increasing heritability despite unchanging
 drove most of the predictive power of this multiple-GPS analysis, significant                 age‑to‑age genetic correlations? Twin studies suggest
 independent contributions to the prediction of intelligence were also found for major         that genetic effects are amplified through GE corre­lation
 depressive disorder GPSs and autism spectrum disorder GPSs. These latter associations
                                                                                               as time goes by 45. That is, the same large set of DNA
 were in the direction expected on the basis of the negative genetic correlation
 between intelligence and depression and the surprising positive genetic                       variants affects intelligence from childhood to adult­
 correlation between intelligence and autism (see Multivariate genetic research).              hood, resulting in high age‑to‑age genetic correlations,
                                                                                               but these DNA variants increasingly have an impact on
                                                                                               intelligence as individuals select environments corre­
                              the hundreds of thousands, GPSs can be used to add a             lated with their genetic propensities, leading to greater
                              genetic dimension to any research with modest sample             heritability of intelligence.
                              size. For example, a GPS for intelligence that predicts              Developmental hypotheses about high age‑to‑age
                              10% of the variance needs a sample size of only 60 to            genetic correlations and increasing heritability can be
                              detect its effect with 80% power (P = 0.05, one-tailed).         tested more rigorously and can be extended through the
                                  GPSs are unique predictors in the behavioural                use of GPSs. Does the variance explained by GPSs for
                              sciences. They are an exception to the rule that corre­          intelligence increase from childhood to adolescence to
                              lations do not imply causation in the sense that there           adulthood? Are the correlations between GPSs at these
                              can be no backward causation when GPSs are correlated            ages consistently high?
                              with traits. That is, nothing in our brains, behaviour or            High age‑to‑age genetic correlations for intel­
                              environment changes inherited differences in our DNA             ligence imply that GWAS of adults should predict
                              sequence. A related advantage of GPSs as predictors is           intelligence in childhood. The EA2 GPS30, currently the
                              that they are exceptionally stable throughout the lifespan       best genetic predictor of intelligence until the EA3 GPS
                              because they index inherited differences in our DNA              becomes available, was derived from a GWAS meta-­
                              sequence. Although mutations accrue in the salivary and          analysis of years of education in adults who had completed
                              blood cells used to collect DNA, these mutations would           their education. Nonetheless, the EA2 GPS predicts 2%
                              not be expected to systematically change the thousands           of the variance in intelligence at age 7 years, 3% at age
                              of inherited SNPs that contribute to a GPS.                      12 years and 4% at age 16 years in a longitudinal study 46.
                                  In other words, GPSs derived from GWAS of any trait
                              at any age would be expected to have a corre­lation near         Multivariate genetic research. Multivariate genetic
                              1.0 when GPSs are constructed from DNA obtained at               research focuses on the genetic covariance between
                              birth and in adulthood for the same individual, although         traits rather than the variance of each trait. A specific
                              we are not aware of any empirical evidence relevant to           multivariate question for intelligence research is why
                              this prediction. If GPSs for individuals do not change           EA GPSs predict twice as much variance in intelli­
                              during the lifespan, a GPS derived from GWAS of intel­           gence as do GPSs for intelligence itself. This question
                              ligence in adulthood will predict adult intelligence just as     raises interesting methodological and conceptual
                              well from DNA obtained at conception or birth as from            issues (BOX 6).
                              DNA obtained in adulthood. By contrast, intelligence                Multivariate genetic research is especially important
                              tests at birth cannot predict intelligence at age 18 years.      for intelligence because genetic effects in the cognitive
                              At 2 years of age, infant intelligence tests predict less than   domain have been shown in twin studies to be general.
                              5% of the variance of intelligence in late adolescence32,42.     That is, genetic effects correlate highly across most

NATURE REVIEWS | GENETICS                                                                                            ADVANCE ONLINE PUBLICATION | 5
                                           ©
                                           2
                                           0
                                           1
                                           8
                                           M
                                           a
                                           c
                                           m
                                           i
                                           l
                                           l
                                           a
                                           n
                                           P
                                           u
                                           b
                                           l
                                           i
                                           s
                                           h
                                           e
                                           r
                                           s
                                           L
                                           i
                                           m
                                           i
                                           t
                                           e
                                           d
                                           ,
                                           p
                                           a
                                           r
                                           t
                                           o
                                           f
                                           S
                                           p
                                           r
                                           i
                                           n
                                           g
                                           e
                                           r
                                           N
                                           a
                                           t
                                           u
                                           r
                                           e
                                           .
                                           A
                                           l
                                           l
                                           r
                                           i
                                           g
                                           h
                                           t
                                           s
                                           r
                                           e
                                           s
                                           e
                                           r
                                           v
                                           e
                                           d
                                           .
REVIEWS

                                 Box 4 | Twin, single-nucleotide polymorphism and genome-wide polygenic score heritabilities
                                 Heritability is the proportion of observed (phenotypic) differences among individuals that can be attributed to genetic
                                 differences in a particular population. Broad heritability involves all additive and nonadditive sources of genetic variance,
                                 whereas narrow heritability is limited to additive genetic variance. Additive genetic variance refers to the independent
                                 effects of alleles or loci that ‘add up’. Nonadditive genetic variance involves effects of alleles or loci that interact.
                                   Twin heritability compares the resemblance of identical and fraternal twins to estimate genetic and environmental
                                 components of variance. For intelligence, twin estimates of broad heritability are 50% on average14. Adoption studies of
                                 first-degree relatives yield similar estimates of narrow heritability of intelligence, suggesting that most genetic influence
                                 on intelligence is additive.
                                   Single-nucleotide polymorphism (SNP) heritability is estimated directly from SNP differences between individuals. It does
                                 not specify which SNPs are associated with a trait. Instead, it uses chance genomic similarities across hundreds of thousands
                                 of SNPs genotyped on an SNP chip for thousands of unrelated individuals to estimate the extent to which genomic
                                 covariance accounts for phenotypic covariance in these individuals. For intelligence, SNP heritability is about 25%22,34,39.
                                   Genome-wide polygenic score (GPS) heritability is the proportion of variance that can be predicted by the GPS.
                                 For intelligence, GPS heritability is currently about 10%31 (P. D. Koellinger, personal communication).
                                   These three types of heritability denote two types of ‘missing heritability’, as shown in the figure. SNP heritability is the
                                 ceiling for genome-wide association study (GWAS) and for GPS heritability because all three rely on the additive effects of
                                 SNPs genotyped on SNP chips93. The missing heritability gap between GPS heritability (10%) and SNP heritability (25%) can
                                 be narrowed by increasing GWAS sample size. Narrowing the missing heritability gap between SNP heritability (25%) and
                                 twin heritability (50%) will require different technologies that consider, for example, rare variants, gene–gene interactions
                                 and gene–environment interactions.

                                                                                                                                          Total variance 100%
                                                                               Twin heritability 50%
                                                SNP heritability 25%
                                  GPS
                                  heritability 10%

                                                Missing GPS                Missing SNP
                                                heritability               heritability
                                                                                                                                    Nature Reviews | Genetics

                                cognitive abilities, such as verbal and spatial abilities,           Despite this evidence for ability-general genetic
                                as well as most educational skills, such as reading and          effects, genetic correlations across cognitive abilities
                                mathematics47. A recent multivariate finding is that the         and educational skills are not 1.0, which implies that
                                EA2 GPS predicts 5% of the variance in comprehension             there are ability-specific SNP associations. An impor­
                                and efficiency of reading 48. This is by far the most pow­       tant direction for research is to identify ability-­specific
                                erful GPS predictor of reading ability because there have        GPSs derived from large GWAS analyses focused on
                                as yet been no large GWAS of reading with replicable             specific cognitive abilities independent of general
                                results49. EA GPSs are also likely to predict other edu­         intelligence. Preliminary analyses of this sort would be
                                cational skills, such as mathematics, and other cognitive        possible using existing GWAS of intelligence because
                                abilities, such as spatial ability.                              most of these studies assessed multiple measures of
                                    EA GPSs are correlated genetically with a wider              specific cognitive abilities, which were combined to
                                range of variables than any other GPS 50 . This                  index intelligence. These data could be reanalysed in
                                pervasive genetic influence of EA GPSs extends to                meta-analytic GWAS that focus on specific abilities
                                a negative genetic correlation with schizophrenia                included in multiple studies. However, what is needed
                                and positive genetic correlations with height 51, with           are large GWAS focused on well-measured specific
                                myopia52 and, surprisingly, with autism53. Linkage dis­          cognitive abilities, such as verbal, spatial and memory
                                equilibrium (LD) score regression analysis54, which uses         abilities and specific cognitive skills taught in schools,
                                summary GWAS statistics rather than GPSs for indi­               for example reading, mathematics and language. The
                                viduals, finds a similar pattern of results for intelligence     pay-off from these studies will be GPSs that predict spe­
                                using the IQ2 GWAS: the negative genetic correlation             cific abilities independent of general intelligence. These
                                with schizophrenia (−0.20) and the positive genetic              ability-specific GPSs could be used to create profiles of
                                correlations with height (0.10) and autism (0.21)33. The         genetic strengths and weaknesses for individuals who
                                same LD score regression analysis33 found that intel­            could be targets for personalized prediction, prevention
Linkage disequilibrium (LD)
score regression analysis       ligence significantly correlated genetically with many           and intervention.
Analysis that, for each         other traits, including Alzheimer disease (−0.36),                   In addition to investigating links between different
single-nucleotide               smoking cessation (−0.32), intracranial volume (0.29),           traits, multivariate genetic research can examine genetic
polymorphism in a               head circumference in infancy (0.28), depressive symp­           links between dimensional and diagnostic measures of
genome-wide association
study (GWAS), regresses χ2
                                toms (−0.27), attention-­deficit–hyperactivity disorder          the ‘same’ domain. For example, the EA2 GPS predicts
statistics from GWAS summary    (−0.27), having ever smoked (−0.23), longevity (0.22)            reading disability just as much as reading ability, from
statistics against LD scores.   and, of course, years of education (0.70).                       slow readers to speed readers48. Because GPSs are always

6 | ADVANCE ONLINE PUBLICATION                                                                                                            www.nature.com/nrg
                                            ©
                                            2
                                            0
                                            1
                                            8
                                            M
                                            a
                                            c
                                            m
                                            i
                                            l
                                            l
                                            a
                                            n
                                            P
                                            u
                                            b
                                            l
                                            i
                                            s
                                            h
                                            e
                                            r
                                            s
                                            L
                                            i
                                            m
                                            i
                                            t
                                            e
                                            d
                                            ,
                                            p
                                            a
                                            r
                                            t
                                            o
                                            f
                                            S
                                            p
                                            r
                                            i
                                            n
                                            g
                                            e
                                            r
                                            N
                                            a
                                            t
                                            u
                                            r
                                            e
                                            .
                                            A
                                            l
                                            l
                                            r
                                            i
                                            g
                                            h
                                            t
                                            s
                                            r
                                            e
                                            s
                                            e
                                            r
                                            v
                                            e
                                            d
                                            .
REVIEWS

                            Box 5 | Make genome-wide association study summary-level statistics publicly available
                            It is essential for continued rapid scientific advances using genome-wide polygenic scores (GPSs) that summary-level
                            statistics from genome-wide association studies (GWAS) be made publicly available for all single-nucleotide
                            polymorphisms (SNPs) following publication. The reason why public access to summary statistics is important is that the
                            construction of GPSs requires an effect size indicator and P value for each SNP in the GWAS. GWAS summary-level
                            statistics are also necessary for other analyses, most notably linkage disequilibrium (LD) score regression, which is used to
                            estimate genetic correlations among traits54.
                               Until 2017, GWAS summary-level data were stored in different databases using different formats, which made it
                            difficult to use the data to investigate traits across studies. This problem has been solved with LD Hub, a centralized
                            database and web interface that provides an automated pipeline for entering and using GWAS summary-level data92.
                               However, only about 10% of published GWAS results are publicly available on LD Hub. Some GWAS consortia are
                            exemplars for making GWAS summary-level data available immediately upon publication, or even before publication,
                            such as the Psychiatric Genomics Consortium94. In intelligence research, a paragon is the Social Science Genetic
                            Association Consortium27, which is responsible for five of the six GWAS for which summary statistics are publicly available
                            in the intelligence section of LD Hub, although three of the five GWAS were for years of education rather than for
                            intelligence itself.
                               By contrast, some authors apply conditions for the use of the summary statistics from their published GWAS paper.
                            Others refuse to share these statistics altogether. A worrying trend is that several commercial organizations do not allow
                            summary GWAS statistics from their samples to be used in open-access summary-level statistics for all SNPs when their
                            samples are included in meta-analytic GWAS. Concerns about privacy have been put forth as an explanation, but these
                            fears should be allayed as it is not possible to reconstruct individual-level data from summary-level GWAS statistics in
                            large heterogenous samples95.
                               Such asymmetrical data-sharing policies between industry and academia will hold back research in the field. If a group
                            does not want its summary-level GWAS statistics to be freely available for a published meta-analytic GWAS, its data
                            should not be used in ‘publication’, true to its Latin origin publicare, which means ‘to make public’.

                        normally distributed, they will show that there are no                  The importance of both genetics and environ­
                        aetiologically distinct common disorders, only contin­              ment for cognitive development is a recommendation
                        uous dimensions55. This is also true for very low and for           for investigating the interplay between them. GPSs for
                        very high intelligence46. Even extremely high intelligence          intelligence will greatly facilitate this research because
                        is only quantitatively, not qualitatively, different genetic­       they offer, for the first time, the possibility of directly
                        ally from the normal distribution56,57. The exception is            assessing genetic propensities of individuals to inves­
                        severe intellectual disability, which is genetically dis­           tigate their interplay with aspects of the environment.
                        tinct from the rest of the distribution of intelligence58           GE interplay refers to two different concepts — GE
                        and affected by rare, often de novo mutations with large            interaction and GE correlation.
                        effects59.                                                              GE interaction denotes a conditional relationship
                                                                                            in which the effects of genes on intelligence depend on
                        Research on gene–environment interplay. The high                    the environment. For example, some twin research sug­
                        heritability of intelligence should not obscure the                 gests that the heritability of intelligence is lower in low-­
                        fact that heritability is considerably less than 100%.              socio-economic-status family environments and higher
                        Research using genetically sensitive designs has led                in high-socio-economic-status family environments61.
                        to one of the most important findings about environ­                This hypothesis predicts that GPSs for intelligence will
                        mental influence on intelligence. Intelligence has                  correlate less with intelligence in environments of low
                        always been known to run in families, but it was                    socio-economic status than in those of high socio-­
                        assumed that this family resemblance was due to nur­                economic status. The first test of this hypo­thesis using
                        ture, called ‘shared family environmental influence’.               the EA2 GPS found no evidence for such an inter­
                        That is, siblings were thought to be similar in intel­              action46. That is, the EA2 GPS were correlated with
                        ligence because they grew up in the same family and                 intelligence in low-socio-economic-status just as much
                        attended the same schools. Twin and adoption studies                as in high-socio-economic-status family environments.
                        consistently support this assumption, but only until                GPSs provide a particularly powerful approach to test
                        adolescence. After adolescence, the effect of shared                for GE interaction compared with twin studies62.
                        family environmental influence on intelligence is neg­                  In contrast to GE interaction, GE correlation
                        ligible, which means that family environments have lit­             refers to the correlation between genetic propensities
                        tle effect on individual differences in the long run45,60.          and experiences. GE correlation is the reason why
                        Family resemblance for intelligence is due to nature                most environmental measures used in the behav­
                        rather than nurture, although it should be emphasized               ioural sciences show genetic influence in twin stud­
                        that we are referring to the normal range of environ­               ies63. Associations between environmental measures
                        mental influence, not the extremes such as neglect                  and behavioural traits such as intelligence are also
                        or abuse. However, little is known about the specific               mediated in part by genetic differences. Research
                        environ­mental factors that make children growing up                using GPSs is beginning to confirm these twin study
                        in the same family different 14.                                    findings about the ‘nature of nurture’ by showing, for

NATURE REVIEWS | GENETICS                                                                                           ADVANCE ONLINE PUBLICATION | 7
                                       ©
                                       2
                                       0
                                       1
                                       8
                                       M
                                       a
                                       c
                                       m
                                       i
                                       l
                                       l
                                       a
                                       n
                                       P
                                       u
                                       b
                                       l
                                       i
                                       s
                                       h
                                       e
                                       r
                                       s
                                       L
                                       i
                                       m
                                       i
                                       t
                                       e
                                       d
                                       ,
                                       p
                                       a
                                       r
                                       t
                                       o
                                       f
                                       S
                                       p
                                       r
                                       i
                                       n
                                       g
                                       e
                                       r
                                       N
                                       a
                                       t
                                       u
                                       r
                                       e
                                       .
                                       A
                                       l
                                       l
                                       r
                                       i
                                       g
                                       h
                                       t
                                       s
                                       r
                                       e
                                       s
                                       e
                                       r
                                       v
                                       e
                                       d
                                       .
REVIEWS

                        example, that EA GPSs correlate with social mobil­                  routinely available from direct-to‑consumer companies
                        ity 64 and capture covariation between environmental                along with hundreds of other medical and psycho­
                        exposures and children’s behaviour problems and                     logical GPSs that can be extracted from genome-wide
                        educational achievement 65. GE correlation provides a               geno­typing on SNP chips. The use of GPSs to predict
                        general model for how genotypes become phenotypes                   individuals’ genetic propensities requires clear warnings
                        — how children select, modify and create environ­                   about the probabilistic nature of these predictions and
                        ments correlated with their genetic propensities.                   the limitations of their effect sizes (BOX 7).
                        GPSs will greatly advance research on GE correlation                    Although simple curiosity will drive consumers’
                        by providing an individual-specific index of the ‘G’                interests, GPSs for intelligence are more than idle
                        of GE interplay. GPSs will also make it possible to                 fortune telling. Because intelligence is one of the best
                        assess environmental influences on intelligence while               predictors of educational and occupational outcomes,
                        controlling for genetic influences.                                 IQ GPSs will be used for prediction from early in life
                                                                                            before intelligence or educational achievement can be
                        Implications for society                                            assessed. In the school years, IQ GPSs could be used
                        The most exciting aspect of GPSs is their potential for             to assess discrepancies between GPSs and educational
                        addressing novel, socially important questions, which we            achievement (that is, GPS-based overachievement and
                        will illustrate with three recent examples from our own             underachievement). The reliability, stability and lack
                        research. First, children in public and private schools             of bias of GPSs make them ideal for prediction, which
                        differ in their EA2 GPSs because private schools select             is essential for the prevention of problems before they
                        pupils on the basis of genetic differences in intelligence66.       occur. A ‘precision education’ based on GPSs could be
                        Second, intergenerational educational mobility reflects             used to customize education, analogous to ‘precision
                        EA2 GPS differences67. Finally, the EA2 GPS predicts                medicine’.
                        twice as much variance in educational attainment and                    A novel, socially important direction for research
                        occupational status in the post-Soviet era as in the Soviet         using IQ GPSs is to understand differences within
                        era in Estonia, a finding compatible with the hypothesis            families. First-degree relatives are on average only 50%
                        that heritability is an index of equality of opportunity            genetically similar, which means they are on average
                        and meritocracy 68.                                                 50% genetically different. A major impact of GPSs
                                                                                            will be to recognize and respect these large genetic
                        Understanding ourselves. IQ GPSs will be used to pre­               differences within families.
                        dict individuals’ genetic propensity to learn, reason and               For scores on an intelligence test standardized to have
                        solve problems, not only in research but also in society,           a mean of 100 and a standard deviation of 15, the average
                        as direct-to‑consumer genomic services provide GPS                  difference between pairs of individuals who are selected
                        information that goes beyond single-gene and ances­                 randomly from the general population is 17 IQ points.
                        try information. We predict that IQ GPSs will become                The average difference between parents and offspring

                         Box 6 | Educational attainment genome-wide polygenic scores and intelligence
                         Educational attainment (EA) genomic-wide polygenic scores (GPSs) predict intelligence because the genetic correlation
                         between years of education and intelligence is greater than 0.50 in twin studies96 and linkage disequilibrium score
                         regression studies97. The genetic correlation of 0.50 also sets a limit on the extent to which EA GPSs can predict
                         intelligence.
                           However, why do EA GPSs predict intelligence to a greater extent than they predict educational attainment itself?
                         That is, the EA2 GPS predicts 3% of the variance in years of education30, but it predicts 4% of the variance in
                         intelligence46. Moreover, EA GPSs predict intelligence much better than IQ GPSs predict intelligence themselves. The
                         IQ3 GPS from the most recent genome-wide association study (GWAS) of intelligence predicts 4% of the variance of
                         intelligence34, but the EA3 GPS predicts more than 10% of the variance in intelligence31 (P. D. Koellinger, personal
                         communication).
                           There are two likely reasons why EA GPSs currently predict intelligence to a greater extent than EA GPSs predict years of
                         education itself. First, intelligence is more heritable (60% in adults) than years of education (40%), as shown in twin studies98.
                         Second, years of education is a coarse measure, primarily indicating whether an individual completed university. Years of
                         education is largely bimodal, with a peak at the end of secondary school and another peak for individuals who attended
                         university. By contrast, intelligence is a more refined measure than years of education that captures the commonalities
                         among diverse tests of cognitive abilities and is normally distributed. That is, educational achievement is not just a proxy for
                         intelligence. It is also predicted by personality traits, such as conscientiousness and well-being, and having fewer mental
                         health problems, such as depression. Together, these nonability traits account for as much of the heritability of educational
                         achievement as intelligence99. The educational attainment GWAS incorporates SNPs associated with any of these traits, not
                         just with intelligence14.
                           Of note, the current GWAS sample sizes for educational attainment are three times larger than for intelligence. The
                         GPS effect sizes for intelligence are similar to those for EA GPSs for comparable effect sizes (that is, IQ2 as compared to
                         EA1 and IQ3 as compared to EA2; see FIG. 1). For this reason, we predict that an IQ GPS derived from a GWAS of
                         intelligence with a sample size of 1 million, such as EA3, will predict at least as much variance in intelligence as does the
                         current EA3 GPS. In other words, intelligence is not actually predicted to a greater extent by EA GPSs than by intelligence
                         GPSs when the powers of the discovery GWAS are similar.

8 | ADVANCE ONLINE PUBLICATION                                                                                                       www.nature.com/nrg
                                    ©
                                    2
                                    0
                                    1
                                    8
                                    M
                                    a
                                    c
                                    m
                                    i
                                    l
                                    l
                                    a
                                    n
                                    P
                                    u
                                    b
                                    l
                                    i
                                    s
                                    h
                                    e
                                    r
                                    s
                                    L
                                    i
                                    m
                                    i
                                    t
                                    e
                                    d
                                    ,
                                    p
                                    a
                                    r
                                    t
                                    o
                                    f
                                    S
                                    p
                                    r
                                    i
                                    n
                                    g
                                    e
                                    r
                                    N
                                    a
                                    t
                                    u
                                    r
                                    e
                                    .
                                    A
                                    l
                                    l
                                    r
                                    i
                                    g
                                    h
                                    t
                                    s
                                    r
                                    e
                                    s
                                    e
                                    r
                                    v
                                    e
                                    d
                                    .
REVIEWS

                              and between siblings is 13 IQ points69. IQ GPSs might                                  Ethical implications. Genomic research and studies
                              help parents understand why their children differ in                                   of intelligence face four principal ethical concerns: the
                              school achievement. Because GPSs are probabilistic,                                    notion of biological determinism; the potential for dis­
                              a low-IQ GPS does not mean that a child is destined                                    crimination and stigmatization; the question of own­
                              to go no further in education than secondary school.                                   ership of information; and the emotional impact of
                              However, it does mean that the child is more likely to                                 knowledge of one’s personal genomics and intelligence.
                              find academic learning more difficult and less rewarding                               These and other ethical issues are explored in detail by the
                              than a sibling with a high-IQ GPS.                                                     Ethical, Legal and Social Implications (ELSI) Research

 Box 7 | The use of genome-wide polygenic scores to predict outcomes in individuals
 Genome-wide polygenic scores (GPSs) must be used with caution when                                    correlation indicates that the EA2 GPS predicts 9% of the variance
 predicting outcomes in individuals. We illustrate the probabilistic nature                            in GCSE scores. Although higher EA2 GPSs can be seen to predict higher
 of GPS predictions using data on EA2 GPSs and school achievement from                                 GCSE scores on average, there is great variability between individuals.
 the Twins Early Development Study100. School achievement was assessed                                 For example, the individual with the second-highest EA2 GPS has a GCSE
 by scores from a UK‑wide examination, the General Certificate of                                      score only slightly above the average. Conversely, an individual with the
 Secondary Education (GCSE), administered at the end of compulsory                                     eighth-lowest EA2 GPS has a GCSE score above the 75th percentile.
 education at age 16 years. GCSE scores were age-regressed and                                           Despite this variability, powerful predictions can be made at the
 gender-regressed, and EA2 GPSs were constructed as described                                          extremes. For example, when the sample was divided into ten equal-sized
 elsewhere46. We used the EA2 GPS prediction of GCSE scores as an                                      groups (deciles) on the basis of their EA2 GPS, a strong relationship
 example because the effect size of this association is currently the                                  between average EA2 GPS and average GCSE scores emerged that was
 strongest in the behavioural sciences, accounting for 9% of the variance46.                           most evident at the extremes (see the figure, part c). Specifically, the
 It will soon be possible to explain a similar amount of variance in                                   average school achievement of individuals in the lowest EA2 GPS decile is
 intelligence, and with that, GPSs will become available to predict                                    at the 28th percentile. For the highest EA2 GPS decile, the average school
 intelligence for individuals.                                                                         achievement is at the 68th percentile.
    The starting point for prediction is the distribution of individual                                  Nonetheless, individuals within the lowest and highest EA2 GPS deciles
 differences (see the figure, part a top). The EA2 GPS is normally                                     vary widely in school achievement (see the figure, part d). The overlap in
 distributed, as GPSs always are, as is the measure of school achievement                              the two distributions is 61%. These issues of variability in prediction are
 (see the figure, part a bottom). GPS prediction of individual differences is                          the same for any predictor that accounts for 9% of the variance in the
 based on its covariance with the target trait (school achievement in this                             target trait. As bigger and better GPSs emerge, the predictive power will
 example). The scatterplot between EA2 GPSs and GCSE scores (see the                                   increase.
 figure, part b) indicates the difficulty of predicting individual outcomes                              In summary, GPSs are useful for individual prediction as long as the
 when the correlation is modest (0.30 in this example). Squaring this                                  probabilistic nature of the prediction is kept in mind.

 a                                                      b                                                                            d
                                                                             99.9%
                                                    GCSE score percentiles

                                                                             ~98%

                                                                             ~75%

                                                                              50%

                                                                             ~15%

                                                                              ~2%

                                                                              0.1%

     –4       –2        0         2         4                                            0.1% ~2% ~15% 50% ~75% ~98% 99.9%                0.1% ~2% ~15% 50% ~75% ~98% 99.9%
              EA2 polygenic scores                                                         EA2 polygenic score percentiles                       GCSE score percentiles
                                                        c
                                                                             ~65%
                                                    GCSE score percentiles

                                                                             ~60%

                                                                              50%

                                                                             ~40%

                                                                             ~35%

                                                                             ~25%
     –4       –2        0         2         4                                        1     2   3   4   5   6    7   8   9    10
                   GCSE scores                                                            Deciles for EA2 polygenic scores
                                                                                                                                                      Nature Reviews | Genetics

NATURE REVIEWS | GENETICS                                                                                                                    ADVANCE ONLINE PUBLICATION | 9
                                           ©
                                           2
                                           0
                                           1
                                           8
                                           M
                                           a
                                           c
                                           m
                                           i
                                           l
                                           l
                                           a
                                           n
                                           P
                                           u
                                           b
                                           l
                                           i
                                           s
                                           h
                                           e
                                           r
                                           s
                                           L
                                           i
                                           m
                                           i
                                           t
                                           e
                                           d
                                           ,
                                           p
                                           a
                                           r
                                           t
                                           o
                                           f
                                           S
                                           p
                                           r
                                           i
                                           n
                                           g
                                           e
                                           r
                                           N
                                           a
                                           t
                                           u
                                           r
                                           e
                                           .
                                           A
                                           l
                                           l
                                           r
                                           i
                                           g
                                           h
                                           t
                                           s
                                           r
                                           e
                                           s
                                           e
                                           r
                                           v
                                           e
                                           d
                                           .
REVIEWS

                                      Programme, which is an integral part of the Human                               beyond the scope of this paper to elucidate these issues in
                                      Genome Project 70. In addition, recent books discuss eth­                       the depth that they deserve, but we expect that the discus­
                                      ical as well as scientific issues about personal genomics,                      sions of ethical issues that surround personal genomics
                                      specifically in relation to education71 and occupation72.                       will consolidate the DNA revolution.
                                      Many of these ethical discussions focus on single-gene
                                      disorders, for example, Huntington disease, which has                           Conclusions
                                      100% penetrance. By contrast, GPSs are ‘less dangerous’                         Genetic association studies have confirmed a century
                                      because they are intrinsically probabilistic, not hard-                         of quantitative genetic research showing that inherited
                                      wired and deterministic like single-gene disorders. It is                       DNA differences are responsible for substantial indi­
                                      important to recall here that although all complex traits                       vidual differences in intelligence test scores. A reach­
                                      are heritable, none is 100% heritable. A similar logic can                      able objective shared with all complex traits in the life
                                      be applied to IQ scores: although they have great predic­                       sciences is to close the gap between the 10% variance
                                      tive validity for key life outcomes1–6, IQ is not determin­                     in intelligence scores explained by GPSs and the SNP
                                      istic but probabilistic. In short, an individual is always                      herit­ability of intelligence of about 25%. A more daunt­
                                      more than the sum of their genes or their IQ scores.                            ing challenge is to break through the ceiling of 25% SNP
                                          Issues of discrimination and stigmatization have                            heritability to reach the 50% heritability estimated by
                                      accompanied research into genetics and intelligence                             twin studies.
                                      from the beginning, typically because findings from                                 Until 2016, GPSs could predict only 1% of the var­
                                      both fields of study were applied to justify policies that                      iance in intelligence. Progress has been rapid since
                                      served sociopolitical ideologies. For example, IQ testing                       then, reaching our current ability to predict 10% of
                                      was infamously used to differentiate European immi­                             the variance in intelligence from DNA alone. GPSs
                                      grants to the United States of America who arrived at                           will soon be available that can predict more than 10%
                                      Ellis Island in the early 1900s, as well as to guide eugenic                    of the variance in intelligence (that is, more than 20% of
                                      ideas about sterilization in Britain and the United States                      the 50% heritability of intelligence estimated from twin
                                      of America throughout the 20th century 11. It is impor­                         studies) and more than 40% of the 25% SNP heritability
                                      tant to acknowledge the risk of discrimination that                             of intelligence. This is an important milestone for the
                                      occurs on the back of scientific findings about indi­                           new genetics of intelligence because effect sizes of this
                                      vidual differences. However, it is equally important to                         magnitude are large enough to be “perceptible to the
                                      realize that research does not lead directly to any policy                      naked eye of a reasonably sensitive observer” (REF. 73).
                                      recommendations. We must be careful not to blame the                            With these advances in the past few years, intelligence
                                      scientists or entire disciplines when their findings are                        steps out of the shadows and takes the lead in genomic
                                      used wrongly 9.                                                                 research.
                                          Who ‘owns’ our genetic information? And who should                              In addition to investigating traditional issues about
                                      decide who can access it? The question of ownership of                          development, multivariate links among traits and GE
                                      personal data has become pivotal but also increasingly                          interplay, IQ GPSs will open new avenues for research
                                      complex in our current age of information. At the same                          into the causes and consequences of intelligence. The
                                      time, understanding and managing the emotional impact                           new genetics of IQ GPSs will bring the omnipotent vari­
                                      that stems from knowledge of our genomics and intelli­                          able of intelligence to all areas of the life sciences without
                                      gence have emerged as new societal responsibilities. It is                      the need to assess intelligence.

1.   Gottfredson, L. S. Why g matters: The complexity of                underwrite significant variation in intelligence           20. Butcher, L. M., Davis, O. S., Craig, I. W. & Plomin, R.
     everyday life. Intelligence 24, 79–132 (1997).                     between people.”                                               Genome-wide quantitative trait locus association scan
2.   Deary, I. J. et al. Genetic contributions to stability and   9.    Pinker, S. The Blank Slate: The Modern Denial of               of general cognitive ability using pooled DNA and
     change in intelligence from childhood to old age.                  Human Nature (Penguin, 2003).                                  500K single nucleotide polymorphism microarrays.
     Nature 482, 212–214 (2012).                                  10.   Block, N. J. & Dworkin, G. E. The IQ Controversy:              Genes Brain Behav. 7, 435–446 (2008).
3.   Deary, I. J., Strand, S., Smith, P. & Fernandes, C.                Critical Readings (Pantheon, 1976).                        21. Davies, G. et al. Genome-wide association studies
     Intelligence and educational achievement. Intelligence       11.   Gould, S. J. The Mismeasure of Man (W.W. Norton,               establish that human intelligence is highly heritable
     35, 13–21 (2007).                                                  1982).                                                         and polygenic. Mol. Psychiatry 16, 996–1005
4.   Schmidt, F. L. & Hunter, J. General mental ability in        12.   Kamin, L. J. The Science and Politics of IQ (Routledge,        (2011).
     the world of work: occupational attainment and job                 1974).                                                     22. Davies, G. et al. Genetic contributions to variation
     performance. J. Pers. Soc. Psychol. 86, 162–173              13.   Bouchard, T. J. & McGue, M. Familial studies of                in general cognitive function: a meta-analysis of
     (2004).                                                            intelligence: a review. Science 212, 1055–1059                 genome-wide association studies in the CHARGE
5.   Strenze, T. Intelligence and socioeconomic success: a              (1981).                                                        consortium (N = 53 949). Mol. Psychiatry 20,
     meta-analytic review of longitudinal research.               14.   Knopik, V. S., Neiderheiser, J., DeFries, J. C. &              183–192 (2015).
     Intelligence 35, 401–426 (2007).                                   Plomin, R. Behavioral Genetics. 7th edn (Worth,            23. Davies, G. et al. Genome-wide association study of
6.   Calvin, C. M. et al. Childhood intelligence in relation            2017).                                                         cognitive functions and educational attainment in UK
     to major causes of death in 68 year follow‑up:               15.   Haier, R. J. The Neuroscience of Intelligence                  Biobank (N = 112 151). Mol. Psychiatry 21,
     prospective population study. Brit. Med. J. 357,                   (Cambridge Univ. Press, 2016).                                 758–767 (2016).
     2708 (2017).                                                 16.   Hare, B. Survival of the friendliest: Homo sapiens         24. Plomin, R. et al. A genome-wide scan of 1842 DNA
7.   Deary, I. J., Pattie, A. & Starr, J. M. The stability of           evolved via selection for prosociality. Annu. Rev.             markers for allelic associations with general cognitive
     intelligence from age 11 to age 90 years: the Lothian              Psychol. 68, 155–186 (2017).                                   ability: a five-stage design using DNA pooling and
     birth cohort of 1921. Psychol. Sci. 24, 2361–2368            17.   Sternberg, R. J. & Kaufman, J. C. The Evolution of             extreme selected groups. Behav. Genet. 31, 497–509
     (2013).                                                            Intelligence (Psychology Press, 2013).                         (2001).
8.   [No authors listed] Intelligence research should not be      18.   Chabris, C. F. et al. Most reported genetic associations   25. Trampush, J. et al. GWAS meta-analysis reveals novel
     held back by its past. Nature 545, 385–386 (2017).                 with general intelligence are probably false positives.        loci and genetic correlates for general cognitive
     This editorial is a landmark in the acceptance of                  Psychol. Sci. 23, 1314–1323 (2012).                            function: a report from the COGENT consortium. Mol.
     genetic influence on intelligence, concluding, “it’s         19.   Benyamin, B. et al. Childhood intelligence is heritable,       Psychiatry 22, 336 (2017).
     well established and uncontroversial among                         highly polygenic and associated with FNBP1L. Mol.          26. Cesarini, D. & Visscher, P. M. Genetics and educational
     geneticists that together, differences in genetics                 Psychiatry 19, 253–258 (2014).                                 attainment. Sci. Learn. 2, 1–7 (2017).

10 | ADVANCE ONLINE PUBLICATION                                                                                                                                     www.nature.com/nrg
                                                       ©
                                                       2
                                                       0
                                                       1
                                                       8
                                                       M
                                                       a
                                                       c
                                                       m
                                                       i
                                                       l
                                                       l
                                                       a
                                                       n
                                                       P
                                                       u
                                                       b
                                                       l
                                                       i
                                                       s
                                                       h
                                                       e
                                                       r
                                                       s
                                                       L
                                                       i
                                                       m
                                                       i
                                                       t
                                                       e
                                                       d
                                                       ,
                                                       p
                                                       a
                                                       r
                                                       t
                                                       o
                                                       f
                                                       S
                                                       p
                                                       r
                                                       i
                                                       n
                                                       g
                                                       e
                                                       r
                                                       N
                                                       a
                                                       t
                                                       u
                                                       r
                                                       e
                                                       .
                                                       A
                                                       l
                                                       l
                                                       r
                                                       i
                                                       g
                                                       h
                                                       t
                                                       s
                                                       r
                                                       e
                                                       s
                                                       e
                                                       r
                                                       v
                                                       e
                                                       d
                                                       .
You can also read