The Parieto-Frontal Integration Theory (P-FIT) of intelligence: Converging neuroimaging evidence
←
→
Page content transcription
If your browser does not render page correctly, please read the page content below
BEHAVIORAL AND BRAIN SCIENCES (2007) 30, 135 –187
Printed in the United States of America
DOI: 10.1017/S0140525X07001185

The Parieto-Frontal Integration
Theory (P-FIT) of intelligence:
Converging neuroimaging evidence
                                                                      Rex E. Jung
                                                                      Departments of Neurology and Psychology, University of New Mexico, and
                                                                      The MIND Research Network, Albuquerque, NM 87106
                                                                      rjung@themindinstitute.org     www.themindinstitute.org
                                                                      www.positiveneuroscience.com

                                                                      Richard J. Haier
                                                                      School of Medicine, Med Sc I; C237, University of California, Irvine, CA
                                                                      92697-4475
                                                                      rjhaier@uci.edu      http://www.ucihs.uci.edu/pediatrics/faculty/
                                                                      neurology/haier/haier.html

Abstract: “Is there a biology of intelligence which is characteristic of the normal human nervous system?” Here we review 37 modern
neuroimaging studies in an attempt to address this question posed by Halstead (1947) as he and other icons of the last century
endeavored to understand how brain and behavior are linked through the expression of intelligence and reason. Reviewing studies
from functional (i.e., functional magnetic resonance imaging, positron emission tomography) and structural (i.e., magnetic
resonance spectroscopy, diffusion tensor imaging, voxel-based morphometry) neuroimaging paradigms, we report a striking
consensus suggesting that variations in a distributed network predict individual differences found on intelligence and reasoning
tasks. We describe this network as the Parieto-Frontal Integration Theory (P-FIT). The P-FIT model includes, by Brodmann areas
(BAs): the dorsolateral prefrontal cortex (BAs 6, 9, 10, 45, 46, 47), the inferior (BAs 39, 40) and superior (BA 7) parietal lobule, the
anterior cingulate (BA 32), and regions within the temporal (BAs 21, 37) and occipital (BAs 18, 19) lobes. White matter regions
(i.e., arcuate fasciculus) are also implicated. The P-FIT is examined in light of findings from human lesion studies, including missile
wounds, frontal lobotomy/leukotomy, temporal lobectomy, and lesions resulting in damage to the language network (e.g., aphasia),
as well as findings from imaging research identifying brain regions under significant genetic control. Overall, we conclude that
modern neuroimaging techniques are beginning to articulate a biology of intelligence. We propose that the P-FIT provides a
parsimonious account for many of the empirical observations, to date, which relate individual differences in intelligence test scores
to variations in brain structure and function. Moreover, the model provides a framework for testing new hypotheses in future
experimental designs.

Keywords: diffusion tensor imaging (DTI); functional magnetic resonance imaging (fMRI); g; genomics; intelligence; IQ; magnetic
resonance spectroscopy (MRS); positron emission tomography (PET); reasoning; structural magnetic resonance imaging (sMRI);
voxel-based morphometry (VBM)

  Is there a biology of intelligence which is characteristic of the   to eloquent studies of particular brain –behavior relation-
  normal human nervous system wherever it is found? Does it           ships characterized by the observations of Broca (1861)
  contribute to man’s survival as an organism? Is it different in     and Wernicke (1874), and the unfortunate case of
  degree, in kind, or in both from that possessed by members          Phineas Gage (Harlow 1848; 1868), to name a few iconic
  of other surviving species? Is it unitary or comprised of mul-
                                                                      examples. Subsequently, two richly articulated schools of
  tiple factors? More practically, can convenient indices be
  found which, like blood pressure, accurately reflect the            thought emerged regarding localization of higher cognitive
  normal and pathological range of variance for the individual?       function, including intelligence, within the brain: one
  Is there a pathology of biological intelligence which is of sig-    implying that the brain works in harmony as a single
  nificance to psychiatry and to our understanding of normal          entity (Flourens 1824; Jackson 1932; Lashley 1929), the
  behavior?                                                           other articulating discrete cortical regions underlying
               — Ward Halstead (1947), Brain and Intelligence         higher cognitive functions (Broca 1861; Gall 1825; Kleist
                                                                      1934). Pavlov (1949) synthesized these previously discor-
                                                                      dant viewpoints, summarizing brain function as compris-
1. Introduction                                                       ing distributed interactions between cortical regions
                                                                      united to perform a common cognitive task, a conceptual-
“Where in the brain is intelligence?” This question has               ization that persists to the present day (Detterman 2000).
vexed researchers for at least the last two centuries, as                This iterative interplay of reductionism and a systems
phrenological inquiries (Gall 1825) gradually gave way                approach provides the conceptual framework that is the

# 2007 Cambridge University Press         0140-525x/07 $40.00                                                                                    135
Jung & Haier: Converging neuroimaging evidence
basis for most modern neuroimaging studies of intelli- (Tramo & Gazzaniga 1999) have found positive corre-
gence and reasoning. Moreover, this approach expands lations between magnetic resonance imaging (MRI)
on earlier studies of whole brain size, which have estab- measures of brain volume and intelligence. Indeed, a
lished the robust, if statistically modest, observation that recent meta-analysis of some 37 neuroimaging studies
larger brain size is related to higher intelligence (Jensen (McDaniel 2005) demonstrates a small, yet consistent
1998). Most of our review is focused on fine-tuning this relationship between whole brain volume and psycho-
general observation by identifying the discrete brain metric measures of intelligence (r ¼ .33). Moreover, the
regions that are particularly related to individual differ- relationship between brain size and IQ appears to be
ences on measures of intelligence and reasoning within rather equally distributed across tissue types, with
the human brain. First, however, we wish to provide a unweighted mean correlation values of .31 for white
larger context by summarizing the evidence that bigger matter volume and .27 for gray matter volume (Gignac
brains provide some species-general cognitive advantage. et al. 2003).
This relationship between total brain volume and intel-
ligence is compelling in light of the evolutionary record.
2. Larger brains are “smarter” across Two candidate genes have been identified that appear to
species and across evolutionary time be important in the regulation of brain size, microcephalin
and ASPM (Evans et al. 2005; Mekel-Bobrov et al. 2005).
Archeological and anthropological evidence has supported Microcephalin mutation, causing primary microcephaly
the notion that, within the genus Homo, evolutionary con- (severe reduction in brain size, mental retardation,
straints have generally selected for larger brain size although preserved lobar structure), is found prominently
relative to body size over time (although see Homo within the germinal matrix of the developing forebrain
floresiensis). Indeed, Charles Darwin writes in The (Jackson et al. 2002), the expression of which results in
Descent of Man that, brain size comparable to early hominids (Wood &
As the various mental faculties gradually developed themselves Collard 1999). A particular haplotype of the microcephalin
the brain would almost certainly become larger. No one, I locus (i.e., G37995C) was noticed to have a much higher
presume, doubts that the large proportion which the size of frequency, the age of emergence estimated as being
man’s brain bears to his body, compared to the same pro- !37,000 years ago (Evans et al. 2005). A homozygous
portion in the gorilla or orang, is closely connected with his null mutation of ASPM (i.e., A44871G and C45126A)
higher mental powers. (Darwin 1871, p. 37) hypothesized to regulate neural stem cell proliferation/
Researchers have long attempted to study brain physiology differentiation also is associated with microcephaly; it
and determine specific correlates of intelligence using was estimated by the same group of researchers to have
technology available during their times. Earliest endeavors emerged merely 5,800 years ago (Mekel-Bobrov et al.
(Galton 1869) focused on brain size, crudely approximated 2005). Thus, there exists tentative support linking discrete
by measures of head size. All modern studies but one candidate genes, brain size, and the temporal develop-
ment of cognitive skills associated with relatively modern
(i.e., !5,800 –37,000 years ago) human endeavors over
the course of evolutionary history.
Although humans classically have been considered to
REX E. JUNG is an Assistant Professor of Neurology and be the most intelligent species within the scala
Psychology at the University of New Mexico, a
Research Scientist at the Mental Illness and Neuro-
naturae, they do not possess the largest brain (e.g.,
science Discovery (MIND) Institute, and a Neuro- sperm whale) or cortical volume (e.g., elephants,
science Consultant to the Advanced Concepts Group whales). What is unique to human brain structure is
(ACG) at Sandia National Laboratories in Albuquer- the relatively large number of cortical neurons
que, New Mexico. He received his Ph.D. in Psychology (!11,000 million), and relatively high conduction vel-
from the University of New Mexico in 2001. His ocity between those neurons (Roth & Dicke 2006).
research is designed to relate behavioral measures Hence, the general notion that “bigger is better” will
including intelligence, personality, and creativity, to certainly benefit from a more fine-grained regional
brain function and structure in healthy, neurological, analysis of brain – behavior relationships, as reviewed
and psychiatric subjects. He is a clinical neuropsychol- herein. Moreover, whole brain observations also over-
ogist, with specialty practice serving patients diagnosed
with white matter diseases.
look significant connectivity (Schmithorst et al. 2005)
and biochemical (Rae et al. 1996) contributions within
RICHARD J. HAIER is a Professor of Psychology at the cerebral white matter that may critically constrain the
University of California, Irvine School of Medicine. development of intelligence across species and across
He received a Ph.D. in Psychology from Johns evolutionary time. Furthermore, the prevailing lore is
Hopkins University in 1975 and has published more strongly prejudiced toward the relatively massive (when
than 120 research articles and book chapters. Based compared with other species) human frontal lobes as
on data collected using positron emission tomography causally related to intelligence. Whereas early research-
in 1988, he and colleagues proposed a hypothesis ers found relatively larger frontal cortices in humans
linking good performance on an intelligence test to effi- compared with other primates (Brodmann 1912), more
cient brain function. For the last 20 years, his primary
research focus has used functional and structural brain
contemporary research finds little evidence of pro-
imaging technologies to study the neural underpin- portional differences among primates when great apes
nings of individual differences in human intelligence are included in the sample (Semendeferi et al. 2002),
and to test the efficiency hypothesis. except for Brodmann area (BA) 10, which is relatively
larger in humans (Semendeferi et al. 2001). This same
136 BEHAVIORAL AND BRAIN SCIENCES (2007) 30:2Jung & Haier: Converging neuroimaging evidence
group has found that gyral white matter (white matter Intelligence Quotient (FSIQ) scores obtained from the
immediately underlying cortical gray matter) was larger Wechsler Intelligence Scales.
than expected in humans in the frontal and temporal There is a theoretically informative distinction, relevant
lobes (Schenker et al. 2005), potentially allowing for to the current review, between intelligence in general
increased intracortical connectivity within these brain (e.g., FSIQ) and a general intelligence factor (g). As
regions. noted by Jensen, the g-factor should be conceived as a
Another research group, while focusing on the relatively “distillate of the common source of individual differences
larger frontal white matter in humans compared to other in all mental tests, completely stripped of their distinctive
species, notes the importance of connecting frontal with features of information content, skill, strategy, and the
posterior brain regions to facilitate the evolution of like” (Jensen 1998), p. 74). As noted by Colom et al.
language skill disproportionately evident within the (2006), whereas the scientific construct of g relies upon
human species (Schoenemann et al. 2005). Finally, cortical the correlations among test scores, intelligence in
thickness and white matter microstructure vary substan- general is merely a summation of standardized mental
tially across species, with cetaceans (e.g., dolphins and test scores. However, the simple sum of various test
whales) having thinner cortices (Haug 1987) and lower scores cannot be considered the optimal measure of g,
levels of myelin thickness (Zhang & Sejnowski 2000) but rather considered a measure of intelligence in
than primates, in spite of the relatively high level of ence- general. Intelligence in general means g plus several
phalization (1.8 – 5.3), total brain size (1,350 –9,000 g), and more specific cognitive abilities and skills. Typical IQ
overall number of cortical neurons (5,800 –11,000 million) scores comprise a complex mixture of those abilities and
in cetaceans. Thus, the cognitive capacities shared among skills (Colom et al. 2002). Although IQ scores have high
cetaceans, nonhuman primates, and humans – including g-factor loadings, IQ scores only approximate g.
self-recognition, symbol-based communication, abstrac- Most previous reviews concerned with the neural basis
tion, and complex social structures (Marino 2002) – are of intelligence have not focused on such distinctions.
associated with markedly different brain features than Rather, they have addressed the biological correlates of
mere size alone. intelligence and reasoning from several different perspec-
tives: For example, (1) positron emission tomography
(PET) studies of cerebral glucose metabolic rate (Haier
1993b); (2) the speed and efficiency of brain functioning
3. Definitions and perspectives from previous inferred from reaction time (Jensen 1998) or assessed by
reviews electrical propagation of nerve impulses through the
brain (Deary & Caryl 1997); (3) the commonality of
The study of intelligence has labored under various chal- frontal lobe recruitment across a wide range of cognitive
lenges of definition, from “that which intelligence tests demands (Duncan & Seitz 2000), including intelligence
measure” (Thorndike 1921), to finite aspects of cognition (Duncan 2005; Duncan et al. 1995; Kane & Engle 2002);
consisting of numerous facets or independent abilities (4) genetic bases underlying the neurobiology of intelli-
(Gardner 1993a; Sternberg 2000). Others advocate that gence (Gray & Thompson 2004; Toga & Thompson
intelligence is synonymous with working memory 2005); (5) common fronto-parietal integration underlying
(Colom et al. 2004; Kyllonen & Christal 1990), whereas a vast array of cognitive demands (Naghavi & Nyberg
a recent review makes the case for a distinction between 2005); and most recently, (6) an attempt to reconcile
working memory/executive functioning and general intel- concepts of cognitive processing efficiency and general
ligence (Blair 2006). A consensus panel of the American intelligence (Chabris 2006).
Psychological Association (APA) defined intelligence in Summarizing these reviews is well beyond the scope of
this way: “Individuals differ from one another in their this paper: Suffice it to say that each of these other reviews
ability to understand complex ideas, to adapt effectively has posited discrete brain regions as being associated with
to the environment, to learn from experience, to engage intelligence as inferred from the use of noninvasive neu-
in various forms of reasoning, to overcome obstacles by roimaging paradigms, adding incrementally to our under-
taking thought” (Neisser et al. 1996). This view of standing of where in the brain intelligence might reside.
general intelligence has widespread appeal. In addition, Our task here is to articulate, for the first time, common-
the empirical evidence overwhelmingly supports the alities across the wide array of neuroimaging studies to
concept of a general factor (g) of intelligence, first date which use a range of measures of intelligence and
defined by Spearman (1904), underlying performance on reasoning, and myriad techniques amenable to structural
most (if not all) measures of higher cognitive functioning localization, including structural magnetic resonance
(Jensen 1998). “General intelligence” more aptly refers imaging (sMRI) and its recent application of voxel-based
to intelligence in general, and it is not the same as g. morphometry (VBM), activation studies of cerebral
The neural basis of general intelligence has been the blood flow and glucose metabolism using positron
focus of most early neuroimaging/intelligence research; emission tomography (PET) and functional magnetic
however, as we understand more fully the importance of resonance imaging (fMRI), chemical inquiries using
individual differences across a wide range of cognitive magnetic resonance spectroscopy (MRS), and measures
tasks, the neural basis of g has become a more recent of water movement using diffusion tensor imaging (DTI).
focus. Although some neuroimaging studies have specifi- Due to space limitations, we specifically exclude
cally tried to assess g (Colom et al. 2006a; 2006b; measures of electroencephalography (EEG) and magne-
Duncan et al. 2000), most studies use single or composite toencephalography (MEG), both of which provide
indices of intelligence in general derived from tests such as excellent temporal resolution but, due to the inverse
the Raven’s Progressive Matrices Test or Full Scale problem (Balish & Muratore 1990), provide relatively
BEHAVIORAL AND BRAIN SCIENCES (2007) 30:2 137Jung & Haier: Converging neuroimaging evidence
low spatial resolution as compared to other neuroimaging intelligence and reasoning reviewed here and guided
modalities. conceptually by the recent and extensive review by
Cabeza & Nyberg (2000) of cognitive neuroimaging
research summarizing the functional correlates of brain
4. A discrete parieto-frontal network underlies activity, by lobe, at the level of Brodmann areas.
human intelligence The importance of the P-FIT model to intelligence and
reasoning can be summarized as follows: (1) We begin
Following the 100th anniversary of development of the with the assumption that humans gather and process
first psychometric test of intelligence by Alfred Binet cognitively salient information predominantly through
(see Binet 1905), we appear poised to answer the question auditory and/or visual means (usually in combination) –
of where individual differences in intelligence might arise therefore, particular brain regions within the temporal
in the human brain. This progress is due to the steady and occipital lobes are critical to early processing of
increase, starting in the latter part of the twentieth sensory information: the extrastriate cortex (BAs 18, 19)
century, in neuroimaging research designed to correlate and fusiform gyrus (BA 37) involving recognition and sub-
measures of higher cognitive functioning with both struc- sequent imagery and/or elaboration of visual input, and
tural and functional attributes of discrete brain regions. Wernicke’s area (BA 22) involving analysis and/or elabor-
Indeed, in December 2003, a symposium brought ation of syntax of auditory information. (2) We assume this
together for the first time many researchers engaged in basic sensory/perceptual processing is then fed forward to
neuroimaging of intelligence (Haier et al. 2003a). That the parietal cortex, predominantly the supramarginal (BA
meeting was the genesis of this paper; when the two of 40), superior parietal (BA 7), and angular (BA 39) gyri,
us, Jung and Haier, found ourselves independently pre- wherein structural symbolism, abstraction, and elabor-
senting parallel reviews and hypotheses tentatively locat- ation emerge. (3) We further assume the parietal cortex
ing individual differences in intelligence within a interacts with frontal regions (i.e., BAs 6, 9, 10, 45 – 47),
network including both frontal and posterior brain which serve to hypothesis test various solutions to a
regions. Our comprehensive review here of 37 neuroima- given problem. (4) Once the best solution is arrived
ging studies – which include measures of both fluid and upon, the anterior cingulate (BA 32) is engaged to con-
crystallized intelligence, measures of reasoning, measures strain response selection, as well as inhibit other compet-
of g, and measures of games of reason (i.e., chess and ing responses. (5) Finally, we propose that this process is
GO) – identifies several discrete brain regions, distributed dependent upon the fidelity of underlying white matter
across the entire brain, and articulates a surprising com- necessary to facilitate rapid and error-free transmission
monality of these areas across studies and methods. of data from posterior to frontal brain regions.
We propose a model – the Parieto-Frontal Integration Following our review of the neuroimaging evidence
Theory, or P-FIT – that elucidates the critical interaction upon which the P-FIT model is based, we will review sup-
between association cortices within parietal and frontal porting evidence from brain lesion and genetic imaging
brain regions which, when effectively linked by white studies.
matter structures (i.e., arcuate fasciculus, superior
longitudinal fasciculus), underpins individual differences
in reasoning competence in humans, and perhaps in 5. Review of neuroimaging literature
other mammalian species as well (see Fig. 1). We arrive
at this model based on the 37 neuroimaging studies of 5.1. Voxel-based morphometry: Beyond “bigger is
better”
Beyond the observation that total brain size weakly corre-
lates with intelligence (Van Valen 1974), major progress on
particular structure-function relationships relied heavily
upon lesion analysis (Halstead 1947; Luria 1973), and
upon groundbreaking work regarding lateral asymmetry
(Geschwind & Levitsky 1968) and cortical disconnection
syndromes (Geschwind 1965). This approach changed
dramatically with the introduction of MRI to clinical neu-
rology and psychiatry, offering the possibility of imaging
brain structures in both disease and health in living
human subjects. In the first study designed to assess the
relationship between brain size and intelligence in vivo
(Willerman et al. 1991), total brain volume in 40 college
students (mean age + SD ¼ 18.9 + 0.6) was measured
with MRI and correlated to performance on four
subtests of the Wechsler Adult Intelligence Scale-
Revised (WAIS-R). These researchers found a pooled
(across sex) correlation of .51 between IQ scores and
Figure 1. Brain regions by Brodmann area (BA) associated with
better performance on measures of intelligence and reasoning brain size, although they did note that selection of
that define the P-FIT model. Numbers ¼ BAs; dark circles ¼ extreme IQ groups for their sample likely amplified the
predominant left hemisphere associations; light circles ¼ degree of correlation (estimated r ¼ .35 for a more
predominant bilateral associations; white arrow ¼ arcuate representative sample). Following Willerman et al.,
fasciculus. This figure is derived from data presented in Figure 5. the first so-called in vivo autopsy was conducted to
138 BEHAVIORAL AND BRAIN SCIENCES (2007) 30:2Jung & Haier: Converging neuroimaging evidence
determine brain-intelligence correlates in 67 healthy indi- 9, 10, 46), temporal (BAs 21, 22, 37, 42), parietal (BAs 3,
viduals (mean age + SD ¼ 38 + 16) without a history of 43), and occipital (BA 19) regions, with significant white
medical, neurological, or psychiatric disease. Subjects matter –IQ correlations observed near BA 39 (Haier
completed the WAIS-R (mean IQ + SD ¼ 116 + 14) et al. 2004). Moreover, these areas differed in young and
and a standard MRI scan, the results of which indicated old adults and also between men and women (Haier
modest positive correlations (i.e., .32 to .46) between et al. 2005). A third study (Frangou et al. 2004) of 40
FSIQ and the volume of specific brain structures including young subjects (mean age + SD ¼ 14.9 + 2.6) of
the temporal lobes, hippocampus, cerebellum, and total average intelligence found correlations with gray matter
gray matter (Andreasen et al. 1993). A subsequent study volume within the cingulate (BAs 24, 31, 32), frontal
(Flashman et al. 1997), in which lobar volumes (i.e.., (BAs 9, 10, 11, 47), and parietal (BAs 5, 7) cortices. Lee
frontal, temporal, parietal, occipital, cerebellum) were et al. (2005) studied 30 older subjects (mean
correlated with IQ measures in 90 normal subjects age + SD ¼ 61.1 + 5.18) and found regional correlations
(mean age + SD ¼ 27 + 10), found that volumes of between performance IQ and brain volume limited to the
frontal (r ¼ .24), temporal (r ¼ .28), and parietal posterior lobe of the right cerebellum. A fifth study (Gong
(r ¼ .24) cortices were predominantly correlated with et al. 2005) of 55 adults (mean age + SD ¼ 40 + 12) of
measures of nonverbal reasoning (i.e., performance IQ). above average intelligence (mean FSIQ + SD ¼ 117 +
These authors hypothesized that the remaining variance 11) found gray matter volume correlates with IQ limited
between IQ and brain structure would likely reside in to the anterior cingulate (BAs 24, 32) and medial frontal
the “quality” rather than “quantity” of brain tissue as (BAs 8, 9, 10) regions. We have since reanalyzed our
found in such variables as circuit complexity, dendritic VBM data using the method of correlated vectors (i.e.,
arbor, myelin thickness, and other neurotransmitter/ correlating the rank of g-loadings for each test in a group
neurochemical factors. of tests to the rank of the same test correlation to any exter-
In spite of the important differences in regional cellular nal variable such as age or brain size; Jensen 1998). We
organization reported by Brodmann (1912), the brain is found that g accounted for many of the FSIQ correlations
not easily segmented into readily identifiable cortical with gray matter in the anterior cingulate (BA 24), frontal
regions. The measurement of discrete cortical and subcor- (BAs 8, 10, 11, 46, 47), parietal (BAs 7, 40), temporal (BAs
tical neuronal-axonal populations required an advance in 13, 20, 21, 37, 41), and occipital (BAs 17, 18, 19) cortices
image analysis, recently realized with voxel-based morpho- (Colom et al. 2006b). Moreover, in a separate analysis,
metry (VBM), a method by which standard images may be we found a nearly perfect linear relationship between g-
automatically segmented into tissue compartments (i.e., loading of each subtest of the WAIS and the amount of
gray, white, cerebrospinal fluid) using measures of voxel gray matter correlated to each subtest score (Colom
intensity at the millimeter level of resolution (Ashburner et al. 2006a).
& Friston 1997). Images from individual subjects are Finally, a newly published study of cortical thickness
imported into a freely available analysis program (i.e., Stat- demonstrates that we are entering the next phase of neu-
istical Parametric Mapping, or SPM), spatially normalized roimaging research on intelligence: longitudinal studies of
in stereotactic space (i.e., Montreal Neurological Insti- brain and cognitive development with a large sample size
tute), segmented and smoothed, and subjected to voxel- (Shaw et al. 2006). In this study, 307 normally developing
wise statistical comparisons with either a comparison children (mean age at first scan +SD ¼ 13 + 4.5) were
group or an external variable (Ashburner & Friston scanned on multiple occasions to determine correlates
2000). This development has resulted in a veritable between measures of cortical thickness and performance
explosion of clinical VBM studies designed to assess volu- on standardized measures of IQ. The strongest and most
metric consequences of various neurological and psychia- consistent correlations between cortical thickness and IQ
tric diseases, with more than 200 peer-reviewed research were obtained during late childhood (age range ¼ 8.6 –
reports containing “voxel-based morphometry” within 11.7 years), with regions throughout the brain showing
their abstracts between the years 2000 and 2006. Of positive correlations. Using the supplementary Table 1
note, this methodology is not without controversy (Allen of their report, we have converted the regional areas ident-
et al. 2005; Ashburner & Friston 2001; Bookstein 2001; ified to Brodmann areas, resulting in distributed brain
Davatzikos 2004), although several recent studies have regions association with intellectual performance in late
compared VBM to traditional region-of-interest (ROI) childhood across frontal (BAs 4, 6, 8, 10, 11, 44 –46), par-
tracing techniques in the same subjects and determined ietal (BAs 1– 3, 5, 39, 40), temporal (BAs 21, 37), and occi-
generally good correspondence between methods pital (BAs 17, 18, 19) cortices. These authors note a
(Giuliani et al. 2005; Good et al. 2002; Testa et al. 2004). striking difference in trajectory of high-IQ subjects com-
To date, seven studies have appeared in the literature pared to their more average counterparts, with “an initial
designed to assess the volumetric correlates of intelligence accelerated and prolonged phase of cortical increase,
in the normal human brain (see Table 1). The first study which yields to equally vigorous cortical thinning by
(Wilke et al. 2003) was of 146 children (mean early adolescence” (Shaw et al. 2006). Cortical thickness
age + SD ¼ 11.7 + 3.5) of above average intellectual was correlated with IQ, but there was a clear developmen-
attainment as measured with the Wechsler Intelligence tal sequence showing a dynamic relationship between
Scales (mean IQ + SD ¼ 113.8 + 13.8). Significant cor- regional brain structure and intelligence as the brain
relations (r ¼ .30) were found between measures of matures through childhood and adolescence. This
FSIQ and gray matter within the cingulate (BA 32). Our finding corresponds to our own data showing different,
study of 47 adults (age range ¼ 18 –84) of high average but overlapping brain regions associated with intelligence
intelligence (mean IQ + SD ¼ 116 + 14.4) found corre- across young and older adults (Haier et al. 2004). Similarly,
lations between gray matter volume within frontal (BAs the cortical thinning finding is consistent with some of
BEHAVIORAL AND BRAIN SCIENCES (2007) 30:2 139Jung & Haier: Converging neuroimaging evidence
Table 1. Structural neuroimaging studies demonstrating relationships between discrete Brodmann areas (BAs) and
measures of intelligence and reasoning
Reasoning
N Age of cohort AC/PC Frontal Parietal Temporal Occipital measure
Morphometry
Wilke et al. (2003) 146 11.7 + 3.5 B32 WAIS/WISC
Frangou et al. 40 12 –21 B24, 31, 32 B9, 11, 47 B5, 7 WISC/WAIS
(2004) L10
Haier et al. (2004) 47 43.5 + 20.3 L8, 10, 45, 46 L39, 40 L21, 22, 37, 42 L19 WAIS
R9 R3, 43 R21
Lee et al. (2005) 30 61.1 + 5.18 RCb WAIS
Gong et al. (2005) 55 40 + 12 B24, 32 B8, 9, 10 CCFT
Colom et al. 47 43.5 + 20.3 L24 B10 B40 L20, 21, 37, 41 B18, 19 R17 g
(2006a) L11, 46, 47 L7 R13
R8
Shaw et al. (2006) 307 13 + 4.5 B11, 44 – 46 B5, 39, 40 L21, 37 B18 L17, 19 WPPSI/ WISC
L10 R1-3 /WAIS
R4, 6, 8
1
H-MRS
Jung et al. (1999)! 26 22 + 4.6 L39/40 WAIS
Pfleiderer et al. 62 20 –75 L24/32 L10/46 WAIS Vocabulary
(2004)! þþ
Jung et al. (2005)! 27 24.8 + 5/9 L39/40 WAIS
DTI
Schmithorst et al. 47 11.0 + 3.3 R31 B9 R3 L13, 39/40 L30 WISC
(2005)!
Note: AC/PC ¼ anterior cingulate/posterior cingulate; B ¼ bilateral; L ¼ left lateralized; R ¼ right lateralized; WAIS ¼ Wechsler Adult Intel-
ligence Scale; WISC ¼ Wechsler Intelligence Scale for Children; RCb ¼ right cerebellum; CCFT ¼ Cattell Culture Fair Test; g ¼ general
intelligence factor; WPPSI ¼ Wechsler Preschool and Primary Scale of Intelligence; ! white matter regions with closest approximate BAs ident-
ified; þþwomen only.
our earlier observations regarding brain efficiency as concordant linear decreases in myelination initiated
evidenced by inverse correlations between brain activity around the fourth decade (Bartzokis et al. 2003). Indeed,
and psychometric intelligence scores (Haier 1993b; reviews of the research literature have found that nearly
Haier et al. 1988; see also Neubauer & Fink 2003; the entire decline in intellectual functioning observed
Neubauer et al. 2002; 2004). among the elderly may be accounted for by reductions
in processing speed (Lindenberger et al. 1993; Salthouse
& Coon 1993).
5.2. White matter studies and intelligence
One technique particularly amenable to the interrog-
The relative contribution of white matter to higher cogni- ation of white matter neurochemical integrity is magnetic
tive functioning has remained relatively understudied resonance spectroscopy (MRS). This technique predates
compared to gray matter research linking particular corti- MRI, although its use in brain research only began in
cal regions to performance. However, several lines of earnest in the latter part of the twentieth century in paral-
inquiry would suggest that the integrity of myelinated lel with the broad application of conventional brain MRI
axons plays a critical role in intellectual attainment (Bottomley et al. 1985). Two major MRS modalities exist –
(Miller 1994). For example, myelin thickness is correlated proton and phosphorous spectroscopy (1H and 31P,
to axonal size (Bishop & Smith 1964; Friede & Samorajski respectively), which comprise the vast majority of clinical
1967; Mathews 1968), and larger axonal diameter is associ- and normal human studies in the research literature.
ated with increased nerve conduction speed (Aboitiz N-acetylaspartate (NAA), the main metabolite visible
1992). The simultaneous increases in myelination and within the 1H-MRS spectrum, is found only within
axonal diameter have been hypothesized to play a critical neurons and mature oligodendrocytes (Urenjak et al.
role in cognitive development. For example, one group 1993) and has been established as a marker of neuronal
has found significant age-related increases in white density and/or viability in numerous disease states
matter density within the bilateral internal capsule and (Barker 2001). In the first study linking brain chemistry
the posterior aspects of the left arcuate fasciculus (which to intellectual performance in normal subjects using 31P-
links anterior and posterior language cortices) in a young MRS, Rae et al. (1996) studied 42 boys (age range ¼
(age range ¼ 4– 17 years) normal cohort (Paus et al. 7.4– 13.2 years), comparing measures of pH and perform-
1999). At the other end of the developmental continuum, ance on the Wechsler Intelligence Scale for Children – 3rd
age-related cognitive decline has been linked to general Edition (WISC-III). They found a significant positive cor-
slowing of brain processes (Hale et al. 1987), with relation between pH in a large volume spanning the
140 BEHAVIORAL AND BRAIN SCIENCES (2007) 30:2Jung & Haier: Converging neuroimaging evidence
fronto-parietal cortex and IQ (r ¼ .52, p ¼ .0008), the a stronger correlation between measures of FA and
association of which was subsequently determined to be verbal intellectual ability (r ¼ .57) as compared to nonver-
specific to children (Rae et al. 2003b). It should be bal ability (r ¼ .33). Thus, the integrity of white matter
noted that the MRS technique used to date allows only connecting Broca’s area (BA 44) to Wernicke’s area (BA
for placement of a single voxel within predominantly 22) appears to be sensitive to individual differences in
white matter regions, and that other brain regions have intellectual attainment in this young cohort (Schmithorst
not been adequately assessed for NAA –IQ relationships. et al. 2005). We have since used the Talairach coordinates,
This is a major limitation of this imaging technique, obtained from Schmithorst et al. (2005), to determine the
although several groups are implementing spectroscopic nearest gray matter regions overlying the white matter
imaging techniques that will allow for multi-voxel acqui- DTI-intelligence regions, which include left hemisphere
sition across a slab of tissue (Gasparovic et al. 2006), and BAs 13 and 30, right hemisphere BAs 3 and 31, and bilat-
eventually we may expect full coverage across the entire eral BAs 9, 39, and 40 (see Table 1), underlying frontal,
brain parenchyma. parietal, and temporal cortices. Although DTI is an excit-
Using 1H-MRS, our group first studied 26 healthy ing new technique to assess white matter orientation and
college students (mean age + SD ¼ 22.0 + 4.6), compar- integrity over the entire brain, the reliability of this
ing brain metabolites with performance on the Wechsler technique has yet to be established within discrete white
Adult Intelligence Scale –3rd Edition (WAIS-3). We matter tracts (e.g., arcuate fasciculus). That being said,
obtained measures of NAA from a voxel placed within DTI studies potentially may result in substantial
the left occipito-parietal white matter, a region underlying contributions linking higher cortical functioning, including
the angular and supramarginal gyri (BAs 39, 40). In this intelligence, to white matter fidelity.
neurologically and psychiatrically normal cohort, we
found a significant, positive relationship between NAA
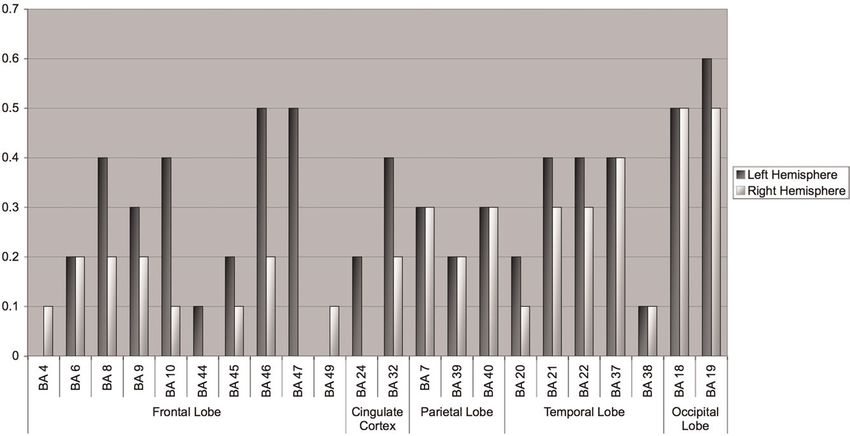
5.3. Summary of structural correlates of intelligence
and IQ (r ¼ .52), equally predictive of verbal (r ¼ .48)
and nonverbal (r ¼ .45) measures of intellectual perform- As shown in Table 1 and Figure 2, several commonalities
ance (Jung et al. 1999). We have since replicated and are apparent when assessing structural (i.e., VBM, MRS,
extended these findings in a new normal cohort of DTI) characteristics of the brain that have been associated
27 college students (mean age + SD ¼ 24.8 + 5.9), with intelligence. For example, of the 11 studies reviewed,
showing specificity of the NAA – IQ relationship to left more than 40% implicate left BA 10 (frontal), 39, and 40
occipito-parietal white matter (when compared to bilateral (parietal); specifically, the tissue density and white
samples of frontal white matter), as well as stronger NAA – matter integrity within these regions correlate substan-
IQ relationships in women compared to men (Jung et al. tially to performance on the Wechsler Intelligence
2005). A second group (Pfleiderer et al. 2004) studied Scales both in young cohorts (Schmithorst et al. 2005)
the relationship between NAA within bilateral dorsolateral and within adult samples ranging in age from 18 to 84
prefrontal and left anterior cingulate cortices and the (Haier et al. 2004). Similarly, tissue density and chemical
Vocabulary subtest of the WAIS-R (high g-loading) in 62 composition for left hemisphere BAs 24 and 32 (cingulate)
healthy adults (age range ¼ 20 –75). They found signifi- and 46 (frontal) and right hemisphere BA 9 (frontal) were
cant correlations between NAA in voxels underlying left correlated to FSIQ in more than 30% of the studies.
BAs 10 and 46 (r ¼ .53) and 24 and 32 (r ¼ .56) and the Overall, the structural studies did not tend to implicate
Vocabulary subtest scores for women, but not for men. common temporal or occipital lobe regions as being corre-
Other groups have since confirmed broader NAA – lated to intellectual performance. This may be due to the
cognition relationships across a wide array of cognitive static nature of structural imaging – participants are not
tasks in both younger (Yeo et al. 2000) and older performing tasks while being scanned; rather, their intel-
(Ferguson et al. 2002; Valenzuela et al. 2000) experimental lectual capacity is assessed and they are scanned on separ-
cohorts, as well as across myriad neurological and psychia- ate occasions. Therefore, it is possible that temporal and
tric patient samples (Ross & Sachdev 2004). occipital lobe relationships to intelligence may be func-
A second major modality by which the white matter tional and “task dependent” upon the sensory modality
integrity is measured is diffusion tensor imaging (DTI), (auditory or visual, respectively) employed, as discussed
an imaging technique that measures the coherence of in the next section. However, these structural studies do
water movement through the white matter of the brain support frontal (BAs 9, 10, 46), parietal (BAs 39, 40),
and that can facilitate in vivo white matter fiber tracking. and anterior cingulate (BAs 24, 32) aspects of the P-FIT
A single, recent study (Schmithorst et al. 2005) attempts model as important to individual differences in perform-
to link measures of white matter status to measures of ance on standardized intelligence tests such as the
intelligence in a normal pediatric cohort. This study WAIS. The combined use of DTI, VBM, and MRS
included 47 children between the ages of 5 and 18 who across the entire brain in future studies would allow for
underwent MRI with DTI and whose intelligence was simultaneous assessment of water diffusion, tissue
assessed with the WISC-III. Measures of fractional density, and chemical composition on a voxel-by-voxel
anisotropy (FA), defined as a measure of white matter basis, and their simultaneous application would substan-
fiber “coherence” (i.e., directional organization), were tially improve our understanding of the structural corre-
calculated within white matter across all brain regions lates of intelligence.
(frontal, temporal, parietal, and occipital). Results
indicated a positive correlation between measures of FA,
5.4. Functional imaging studies using PET
bilaterally, within frontal and occipito-parietal white
matter, a region that the authors concluded to be William James (1890, p. 99) first remarked that “blood very
representative of the arcuate fasciculus. They also noted likely may rush to each region of the cortex according as it
BEHAVIORAL AND BRAIN SCIENCES (2007) 30:2 141Jung & Haier: Converging neuroimaging evidence
Figure 2. Graphical representation of the proportion (Y-axis) of structural neuroimaging studies describing relationships between
intelligence and/or reasoning and discrete Brodmann areas by lobe (X-axis).
is most active,” a supposition that remained empirically 22/42, 21/22, and 37/19. A subsequent re-analysis of
elusive until the introduction of relatively sensitive and these data (Haier 1993b) used a more anatomically
accurate measures of regional cerebral blood flow refined three-dimensional method of anatomical localiz-
(rCBF) (Lassen et al. 1963a; 1963b). Early research ation which used all nine axial slices instead of only
(Ingvar & Risberg 1967; Risberg et al. 1968) demonstrated three individual ones (still primitive by today’s standards).
that performance of cognitive tasks was accompanied by Of 32 possible correlations (four areas within each of
increases in regional circulation, hypothesized to corre- four lobes, left and right hemisphere), 12 were significant
spond to changes in gray matter neuronal activity. One (all negative) – six of these were in temporal and parietal
of the earliest imaging techniques had subjects breathe lobes (approximate BAs 21, 22, 37, 38, 39), four in the
oxygen labeled with the short half-life radioactive isotope occipital lobe (BAs 18, 19), and two in the frontal cortex
133
Xenon, the decay of which could be recorded from (BAs 9, 10) (Haier 1993b). At the time, the inverse corre-
detectors surrounding the head. Positron emission tom- lations were surprising, even as the exact anatomical
ography (PET) evolved from these early rCBF studies, localization of the most significant areas was unsatis-
allowing for greater sensitivity and spatial localization of factory. A similar PET study of 16 normal volunteers
neuronal uptake through labeling of glucose utilization performing a high g-loaded verbal fluency test, however,
or blood flow (Sokoloff 1981). also showed significant inverse correlations in frontal,
The first PET study, designed to formally assess brain – temporal, and parietal lobes (Parks et al. 1988). These
intelligence links in normal subjects in the entire brain, authors also interpreted the inverse correlations as an
was undertaken in eight young men (mean age + SD ¼ indication of brain efficiency. Hypothesizing that mental
22.4 + 2.3) by utilizing 18fluoro-2-deoxyglucose (FDG) retardation may be associated with increased brain ineffi-
uptake during performance on a high g-loaded test of ciency and greater brain activity, Haier et al. (1995)
nonverbal abstract reasoning, the Raven’s Advanced reported higher glucose metabolism throughout the
Progressive Matrices (RAPM), over a period of 32 brain in a small group of subjects with IQs between 50
minutes, while subjects worked at their own pace (Haier and 75. The regional results of these studies are difficult
et al. 1988). The most notable finding from this study to convert to BAs; they are discussed in more detail else-
was widespread inverse correlations between regional where (Haier 2003).
glucose metabolic rate (GMR) and performance on the Although inverse correlations between brain function
RAPM. Thus, high scores on the RAPM were related to and cognitive performance also have been reported in
lower GMR, a finding thought possibly to reflect increased EEG studies (Neubauer & Fink 2003), most functional
“neuronal efficiency” in subjects with better performance imaging studies of cognition compare a task and a
(Haier 1993b; Haier et al. 1988). This study used a first- control condition and do not examine individual differ-
generation PET scanner that imaged only nine axial ences in the performance of the task as a variable. In
brain slices, one slice at a time, with relatively poor fact, most tasks used in cognitive imaging studies are
spatial resolution. (Modern PET scanners image the chosen to minimize performance differences among
entire brain simultaneously, with considerably higher subjects. Such cognitive tasks are not tests of intelligence
spatial resolution.) In this first RAPM study, regional per se, but several other studies have linked performance
GMR was assessed in only three of the nine axial slices of various “reasoning” tasks to brain activation utilizing
using a stereotactic method, quite primitive by today’s PET. One such study (Ghatan et al. 1995) using the
standards. In approximate BA terms, the most significant perceptual maze task (PMT), a measure of frontal lobe
inverse correlations were bilateral in BAs 9/46, 39/40, function and visuo-spatial reasoning, was performed by
142 BEHAVIORAL AND BRAIN SCIENCES (2007) 30:2Jung & Haier: Converging neuroimaging evidence
eight middle-aged volunteers (mean age ¼ 49.1; age et al. 1982; 1987; 1988; Risberg et al. 1975). However,
range ¼ 41 – 59 years) during [15O] butanol PET. When spatial localization was quite primitive when compared
compared with a motor control “sham” condition, per- to modern PET and fMRI techniques. In the only PET
formance of the PMT resulted in increased uptake visual analogical reasoning study to date (Wharton et al.
within bilateral anterior cingulate (BA 32), medial (BAs 2000), researchers studied 12 young adult subjects
6, 8) and right frontal (BAs 4, 49), superior and inferior (mean age ¼ 26 years) while they observed a source
parietal (BAs 7, 40), inferior temporal (BA 37), and picture comprised of nameable geometric objects (e.g., tri-
superior occipital (BAs 18, 19) cortices. angle) and decided whether it was an analog of a target
Haier and Benbow (1995) used FDG PET to study display of geometric objects. When comparing analogical
mathematical reasoning in college men (N ¼ 22) and reasoning to literal conditions (i.e., target matches source
women (N ¼ 22). Half of each group were selected for exactly), Wharton et al. found activations within the left
high or average mathematical ability on the basis of middle frontal (BAs 6, 8) and inferior frontal (BAs 10,
college entrance SAT-Math scores (SAT-M scores more 44, 45, 46, 47) gyri, the anterior insula, and inferior parie-
than 700 for the high groups; between 410 and 540 for tal cortex (BA 40). These authors concluded that “analogi-
the average groups). During the PET procedure, each cal mapping is produced by an integrated network formed
subject completed a new SAT-M test during the 32- from the left parietal and frontal cortices. Further, it may
minute FDG uptake period. In men, there were significant be that the left parietal and frontal cortices mediate auto-
correlations between the math score and glucose metab- matic and controlled aspects of mapping respectively”
olism in the temporal lobes bilaterally (middle, inferior, (Wharton et al. 2000).
and posterior; analogous to BAs 20, 21, 22). There were In a widely cited study, Duncan et al. (2000) reported
no correlations in the women, showing a clear sex differ- [15O] butanol PET activations associated with reasoning
ence. In a separate PET study of eight normal males, performance in 13 young adult subjects (mean age ¼ 26
Haier et al. (1992a) assessed functional brain changes years). Their protocol used high g-correlated and low g-
after the learning of a complex visuo-spatial task (i.e., correlated items sampling both verbal and visuo-spatial
Tetris), and reported decreased cerebral metabolism domains. They focused the interpretation of their results
after practice. Of interest here, the decreases in several on the predominantly frontal commonality of activation
brain areas were larger in the subjects with higher scores seen in both the verbal and spatial reasoning conditions
on the Raven’s Advanced Progressive Matrices (Haier (BAs 46, 47). However, their “high” g task resulted in acti-
et al. 1992b). The regions of decreased metabolism over vations spread across frontal (BAs 6, 8, 10, 45, 46, 47),
time were based on a stereotactic method and are not parietal (BAs 7, 40), and occipital (BAs 18, 19) cortices.
amenable to BA conversion. Nonetheless, Duncan et al. concluded that g was almost
Verbal and nonverbal reasoning have also been studied exclusively related to the frontal lobe, a view at odds
using PET. For example, one group of researchers con- with most prior and subsequent neuroimaging studies.
ducted two studies assessing deductive/inductive reasoning Recently, Duncan has modified his view (Duncan 2005;
and analysis of verbal syllogisms (Goel et al. 1997; 1998) in also see a critique of this study by Colom et al. 2006a).
samples of 10 (mean age + SD ¼ 28.4 + 4.03) and 12 Finally, Haier et al. (2003b) assessed whether individ-
young adult subjects (mean age + SD ¼ 28.2 + 2.6 uals with higher scores on the high g-loaded test, the
years), respectively, measured with [15O]H2O PET. In the Raven’s Advanced Progressive Matrices Test (RAPM),
first study, compared to baseline, inductive reasoning was process information differently even when no problem
associated with activations in the left frontal (BAs 8, 9, 10, solving is explicitly involved in task performance. For
24, 32, 47), temporal (BA 20), and occipital (BA 19) lobes. this experiment, 22 young adults (mean age + SD ¼
In the second study, the researchers found activations 22.1 + 2.6) were studied with FDG PET as they viewed
inclusive of the left frontal (BAs 45, 46, 47), left temporal two videotapes, including narratives, with content consist-
(BAs 21, 22), and left cingulate (BAs 24, 32) gyri. In a 15O ing of either emotional or no emotional valence. Prior to
PET study of two frontal lobe nonverbal reasoning the PET session, subjects completed the RAPM, with a
tasks – the Wisconsin Card Sorting Test and the Raven’s 40-minute time limit, to assess intellectual functioning.
Progressive Matrices Test – Esposito et al. (1999) studied Interestingly, significant positive correlations (common
41 healthy volunteers. In their young adult cohort (age across both conditions) were found between RAPM
range ¼ 18–42 years), they found converging bilateral acti- scores and glucose uptake in several posterior brain
vations across tasks within the dorsolateral prefrontal (BAs regions, including bilateral parietal (BA 7), temporal
9, 46), inferior parietal (BAs 39, 40), anterior cingulate (BAs 22, 37), and occipital (BAs 18, 19) cortices. Negative
(BA 32), inferior/lateral temporal (BAs 21, 37), and correlations were found in left BA 39 and right BA 7,
occipital cortices (BAs 18, 19), suggestive of a common BA 18, and the left parahippocampus (only positive
neural network underlying diverse problem-solving tasks correlations are included in the Table 2, although the
and matching key components of the P-FIT. interaction of reduced “activation” and function is of
The understanding of analogical reasoning, a high g increasing interest to the cognitive neurosciences). More-
ability, has been of keen interest within the cognitive over, the strongest functional connectivity differentiating
neurosciences for several decades, with at least one high- and low-RAPM subjects was found between BAs
group speculating that the left angular gyrus may be “hard- 19 and 37 and the left anterior cingulate/medial frontal
wired” for analogical reasoning (Gur et al. 1994). Indeed, gyrus. These authors offer several possible hypotheses
several early 133Xenon blood flow studies indicated that for the importance of these posterior areas for intelligence,
verbal analogical reasoning activated predominantly left including that “individual differences in the ability to
hemisphere regions, particularly the left inferior parietal resolve competition among incoming visual stimuli may
cortex and Wernicke’s area (Gur & Reivich 1980; Gur be a component of g” (Haier et al. 2003b).
BEHAVIORAL AND BRAIN SCIENCES (2007) 30:2 143Jung & Haier: Converging neuroimaging evidence
Table 2. Positron Emission Tomography (PET) neuroimaging studies demonstrating relationships between discrete Brodmann areas
(BAs) and measures of intelligence and reasoning
N Age of cohort AC/PC Frontal Parietal Temporal Occipital Reasoning measure
PET
Haier (1988/ 8 22.4 + 2.3 B9, 10 B39 B21, 22, 37, 38 B18, 19 RAPM
1993b)
Ghatan et al. 8 49.1 B32 B6, 8 B7, 40 B37 B18, 19 PMT-sham
(1995) R4, 49
Haier & Benbow 22 20 + 1.7 B20, 21, 22§ Math Reasoning
(1995)
Goel et al. (1997) 10 28.4 + 4.03 L24, 32 L8, 9, 10, 47 L20 L19 Inductive/Deductive
Reasoning
Goel et al. (1998) 12 28.2 + 2.6 L24, 32 L45, 46, 47 L21, 22 Verbal Syllogisms
Esposito et al. 41 18 –42 B32 B9, 46 B39, 40 B21, 37 B18, 19 WCST/RAPM
(1999)
Wharton et al. 12 26 L6, 8, 10, 44, L40 Analogy Reasoning
(2000) 45, 46, 47
Duncan et al. 13 26 L10, 46, 47 Letter Sets
(2000-V)
Duncan et al. 13 26 B8, 46, B7, R40 B18, 19 CCFT
(2000-V/S) L47
R6, 45
Haier et al. (2003b) 22 22.1 + 2.6 B7 B22, 37 B18, 19 RAPM
Note: AC/PC ¼ anterior cingulate/posterior cingulate; B ¼ bilateral; L ¼ left lateralized; R ¼ right lateralized; RAPM ¼ Raven’s Advanced
Progressive Matrices; PMT ¼ perceptual maze test; V ¼ verbal; V/S ¼ visuo-spatial; WCST ¼ Wisconsin Card Sorting Test; CCFT ¼ Cattell
Culture Fair Test; § ¼ men only.
5.5. Summary of PET correlates of intelligence hemisphere activations within the frontal lobes, apparent
One striking element in the summary of PET studies of in Table 2 and Figure 3. Half of the studies reported bilat-
intelligence is the general gradient of bilateral activations eral activations within BAs 18 and 19 within extrastriate
within posterior brain regions and the predominantly left cortex, as well as predominantly left hemisphere activation
Figure 3. Graphical representation of the proportion (Y-axis) of PET neuroimaging studies describing relationships between
intelligence and/or reasoning and discrete Brodmann areas by lobe (X-axis).
144 BEHAVIORAL AND BRAIN SCIENCES (2007) 30:2Jung & Haier: Converging neuroimaging evidence
within either BAs 46 or 47. Forty percent (40%) of studies adult subjects (age range ¼ 23 – 30 years) perform three
revealed left greater than right activation within frontal types of problems (i.e., match, figural reasoning, analytical
BAs 8 and 10, the anterior cingulate gyrus BA 32, and tem- reasoning) selected from the RAPM while undergoing
poral BAs 21, 22, and 37, comprising the ventral “what” fMRI. Match problems required the subject to merely
stream of visual information processing (Ungerleider & match a figure to an identical exemplar. Figural problems
Mishkin 1982). Interestingly, these activations were not required predominantly visuo-spatial analysis to deter-
limited to strictly visual tasks (see Goel et al. 1997; mine the right answer. Analytical problems required
Wharton et al. 2000). Finally, 30% of studies reported acti- abstraction and reasoning beyond mere perceptual
vations within predominantly the left lateralized frontal analysis. Fluid reasoning (i.e., analytic – figural) resulted
cortex (BA 9) and the bilateral posterior parietal cortex in activations within frontal (BAs 6, 9, 44, 45, 46), parietal
(BAs 7, 40). Overall, these PET studies largely conform (BAs 7, 39, 40), temporal (BAs 21, 37), and occipital (BAs
to the P-FIT model. The relative invasiveness of PET 18, 19) cortices, with only the parietal activation limited to
studies (i.e., exposing subjects to radioactive isotopes), as the left hemisphere. These authors conclude that the
well as the long period of uptake within the brain (i.e., neural network underlying RAPM performance overlaps
ranging from 2 minutes to 32 minutes), would tend to substantially with verbal working memory networks,
limit future research to targeted hypotheses within rela- even during analytical reasoning regarding nonverbal
tively small subject groups designed to elucidate the patterns; therefore, a strong link exists between neural
entirety of brain networks associated with a given reason- systems underlying working memory and reasoning.
ing and/or intelligence task. However, this area of Another group (Kroger et al. 2002) used fMRI to study
research is critically important to future studies, as it neural correlates of visual reasoning during performance
exploits direct precursors limiting the performance of of matrix problems of increasing levels of difficulty by
neuronal work (e.g., oxygen/glucose) as opposed to eight young adults (age range ¼ 19 – 32 years). They
measures hypothesized to be indirectly linked to neuronal found that a measure of “relational complexity,” associated
work (e.g., blood oxygen level dependent [BOLD] with solving matrix problems, resulted in activations within
response). In combination with new labeling agents and the bilateral frontal (BAs 6, 9, 47), left frontal (BAs 44, 46),
other imaging modalities possessing millisecond time bilateral parietal (BA 7), and bilateral anterior cingulate
resolution (e.g., magnetoencephalography), PET studies (BA 32) cortices.
are likely to continue to contribute to understanding the Proficiency in the game of chess has long been equated
neural basis of intelligence and reasoning. with superior intelligence and keen reasoning skill, and
attempts have been successful in creating a computer
that can defeat even the most accomplished human
5.6. Functional imaging studies using fMRI
opponent (i.e., IBM’s Deep Blue). The neural substrates
Functional studies of human cognition required technol- of such games of reason are now under study with neuroi-
ogy unavailable at the beginning of the twentieth maging. One group of researchers studied fMRI acti-
century. However, in perhaps the first report on the vations associated with the games of chess (Atherton
association between blood flow and cognition in humans, et al. 2003) and GO (Chen et al. 2003). In the first exper-
John Fulton, a neurosurgery resident, described a iment, six male novice chess players (age range ¼ 24– 33
patient who presented with decreasing vision due to an years) were scanned as they determined the best move
arteriovenous malformation (AVM) in the occipital for white to make in a middle game position. When this
cortex (Fulton 1928). Surgical removal of the AVM was condition was contrasted with a condition in which chess
attempted but unsuccessful, leaving a bony defect in the pieces were dispersed randomly across the board, signifi-
occipital bone through which a prominent bruit (i.e., cant activations were observed within bilateral regions of
rushing of blood) could be heard at auscultation. In a sub- the parietal (BAs 7, 39, 40), occipital (BA 19), and left
sequent detailed analysis, Fulton found that the amplitude frontal (BAs 6, 8, 9) cortices, as well as the left cerebellum.
of the bruit was well correlated with the patient’s mental In the second study, six amateur GO players were scanned
activity. For example, opening of the eyes would elicit a under realistic and random game positions. When game
moderate increase in blood flow sounds, whereas conditions were compared with random board conditions,
reading corresponded to dramatic increases. This initial significant activations were observed within the left frontal
finding foreshadowed the potential of tools which could (BAs 44, 45), bilateral frontal (BAs 6, 9), posterior cingu-
make such assessments of blood flow – as later demon- late (BAs 30, 31), parietal (BAs 7, 40), temporal (BA 37),
strated by the accumulated work of several Nobel laure- and occipital (BA 19) cortices. Chen et al. noted the rela-
ates (e.g., Felix Bloch and Edward Purcell [Nobel tive “paucity of activation in the frontal lobes” across
Prize – 1952], and Paul Lauterbur and Peter Mansfield studies, as well as lack of hemispheric specialization,
[Nobel Prize – 2003]), and numerous other, less recog- although both games are considered to be strategic and
nized contributors to the nascent field, in developing spatially oriented. They made special note “that the so-
imaging technology that would allow visualization of called ‘g’ areas in the frontal lobe reported and empha-
brain parenchyma in vivo. Out of their collective work sized by Duncan et al. (2000) are not consistently activated
emerged magnetic resonance imaging (MRI), and later in either GO or chess cognition” (Chen et al. 2003).
functional MRI (fMRI), a neuroimaging technique that Several studies have been undertaken to study logical
exploits the increase in blood flow to the local vasculature reasoning with fMRI. For example, Goel and Dolan
that accompanies neural activity in gray matter regions of (2001) used measures of either concrete or abstract “rela-
the brain. tional reasoning” problems (e.g., “the apples are in the
In the first fMRI study of the neural substrates of barrel; the barrel is in the barn; the apples are in the
reasoning, Prabhakaran et al. (1997) had seven young barn,” or A . B; B . C; A . C) to measure brain
BEHAVIORAL AND BRAIN SCIENCES (2007) 30:2 145You can also read