Semi-Automatic Framework for Estimating Intelligence Quotient (IQ) Using MRI
←
→
Page content transcription
If your browser does not render page correctly, please read the page content below
Annals of R.S.C.B., ISSN:1583-6258, Vol. 25, Issue 3, 2021, Pages. 2087 - 2101
Received 16 February 2021; Accepted 08 March 2021.

         Semi-Automatic Framework for Estimating Intelligence Quotient (IQ) Using MRI

                                                          Thilakavathy P1, B Diwan2

           1
               Assistant Professor, Department of Information Technology, St.Joseph’s College of Engineering,
                                                                  Chennai, India.
               2
                   Associate Professor, Department of Computer Science and Engineering, St.Joseph’s College of
                                                         Engineering, Chennai, India.

      Abstract- Central Nervous System is the huge database of information, called a well-organized
      intellectual library. Information storage, retrieval and transfer in neurons is enormouslyfast and feels like
      wide and advanced network placed inside our skull. From literature survey we conclude that only some
      regions of the brain is specifically contributing to intelligence. The central regions are identified and
      measured in various dimensions for statistical analysis. For analyzing IQ score a popular imaging called
      MRI(Magnetic Resonance Imaging)is used. The positively associated regions related to intelligence are
      total brain volume, GM/WM and cortical analysis. This analysis mainly focused in consolidating all the
      brain variables that are correlated with intelligence. Identifying and measuring only the few particular
      variables cannot determine intelligence, this motivated us in considering all the variables at once. Brain
      Morphometric features are measured manually or automatic using volumetric analysis of core regions and
      sub regions. The some of the morphometric analysis are volumetric analysis and quantification of size
      and shape of the brain’s variables. Here in this proposed framework we used subject’s MRI in estimating
      human’s intelligence using MeVisLab and Brainsuite19b. We also presented various graphical network
      framework using itk and vtk packages of MeVisLab. Our results consolidated the vital regions and
      considered its overall volumetric measures in improving the intelligence accuracy.Future advancement of
      this analysis is to define particularly that which region is specifically associated with what intelligence
      types. To check whether the individual will excel in particular field the corresponding associated region
      and its measurementswillbe useful in predicting the intelligence level and also stating whether this
      subject can be suitable or not for the particular field of interest.

      Keywords- Magnetic Resonance Imaging , Intelligence Quotient , Brain Volume, Grey matter and White
      Matter, Cortical measures

     1. INTRODUCTION
        Neuroimaging is the imaging of the human central nervous system. It uses multiple techniques and

       http://annalsofrscb.ro                                                                                 2087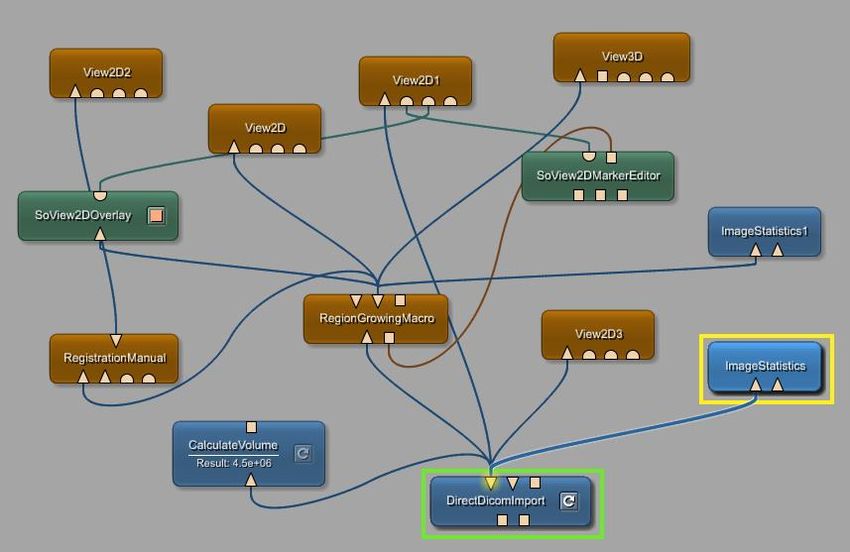
Annals of R.S.C.B., ISSN:1583-6258, Vol. 25, Issue 3, 2021, Pages. 2087 - 2101
Received 16 February 2021; Accepted 08 March 2021.

      methodologies either directly or indirectly to build structure and functions of brain anatomy.
      Neuroimaging studies help us to find various brain related normal and abnormal activities such as disease
      prediction, region failure, intelligence prediction and various other vital functionalities. This studies help
      to identify brain structural abnormalities and safeguard future generation from various diseases. Basically
      all human behaviors directed by brain anatomical structure, whereas this is proven in neuroimaging
      studies as depending upon the anatomical structure of the brain the every individual’s human actions and
      behaviors differs , this how we able to categorize the people capabilities. Intelligence is one of the
      primary parameter behind all abilities. This parameter differs in every individual and the measuring of
      this motivate us to categorize higher or lesser intelligence in individual. It also proven that many central
      regions in neuro system highly contribute to intelligence. The one identified measure of intelligence level
      is Intelligence Quotient(IQ).
               Brain’s intelligence growth starts from childhood and keep increasing till adolescence, after
      certain age the structural variations remain unchanged. Many positive correlations between anatomical
      brain structure and intelligence is proven with subject’s MRI. Brain morphology and its measures
      contribute to Cognitive abilities, verbal , non-verbal reasoning and logical thinking of human capabilities.
      Millions of Neurons are responsible for information transfer and storage, By measuring the Total brain
      volume the overall neurons in the entire brain is estimated.
               IQ level can be predicted by studying the various central regions of the brain and measuring its
      density. To know the brain imaging structure and its functionalities (Magnetic Resonance Imaging),
      MRI is used mostly in neuroimaging systems. It shows the detailed anatomical brain structure. Some of
      the multiple regions identified to show positive correlation with intelligence. This proposed study
      initiated to identify all the influential region related to intelligence and the various methods followed
      tomeasure its proportion or density. To acquire knowledge and greater accuracy in calculating
      individual’s IQ level, the both physical assessment and brain structural study plays essential role. The
      various parts of brain contributes to different cognitive abilities such as logical reasoning, verbal fluency,
      abstract thinking , complex problem solving skill.

     2. LITERATURE SURVEY
              Cortical measurements and brain volume are the parameter reveals the amount and density of
      neurons in the structures. Cortical thickness computation is efficiently compared between surface based
      and two voxel based methods on free surfer, Laplacian and registration based methods by Mathew J.
      Clarkson. The results of this states that FreeSurfer produced reasonable results on same day scan
      compared to other methods [1]. Processing of information relies on the variations of GM/WM structures.
      Stuart J.Ritchie (2015)made clear representation in his framework as beyond total brain the some more
      fine grained measures contribute to intelligence. In his study apart from brain volume the other six of the
      positively correlated variables are white matter structure and hyperintensity load, microbleeds, iron
      deposits and cortical thickness are also have positive associations towards intelligence. The results states
      that brain volume is the most vital parameter responsible for intelligence[3].
              Youngwoo et al (2017)The various Brain structures related to intelligence is associated with
      cognitive abilities and other functions. The studies clearly explained Gray Matter structure network is
      closely related to intelligence. The central region such as cerebelloparetal component and frontol
      component is well associated with cognitive abilities. Gray matter structures in this components are
      identified and measured in this technique .The cerebellum component is associated with visuomotor

       http://annalsofrscb.ro                                                                                  2088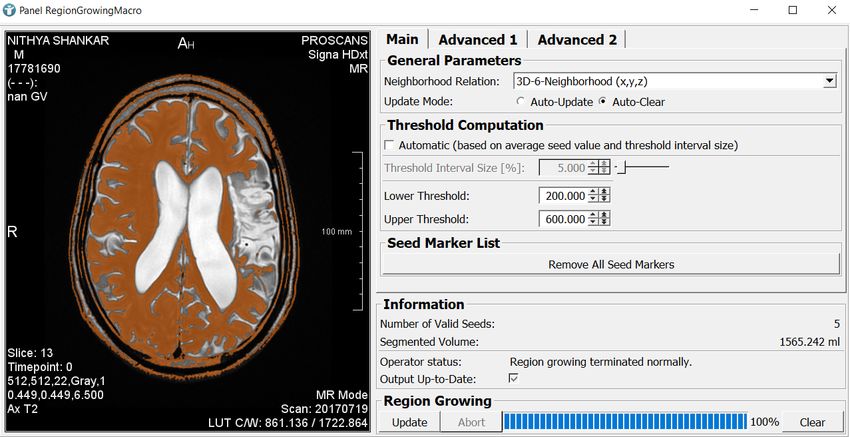
Annals of R.S.C.B., ISSN:1583-6258, Vol. 25, Issue 3, 2021, Pages. 2087 - 2101
Received 16 February 2021; Accepted 08 March 2021.

      ability.The revealed GM structure using multivariate approach proves the intelligence efficiency.
      Pearson’s correlation analysis is used to find the relations between the identified structural connectivity
      and intelligence. The work says that intelligence is associated with two central region cerebelloparetal
      component and frontal component[2].

              Based on the anatomical variations,The subject wise intelligence analysis is made in existing
      studies importantly for mathematical knowledge. The framework defined by Fransisco J. Navas-
      Sanchez (2014) is the measurements related to micro structure of White Matter tracts using diffusion
      tensor imaging. In neuro anatomical connectivity the WM structures are analyzed voxel wise in region of
      interest based on parameter called fractional anisotropy(FA) [5] . Fractional anisotropy parameter proven
      to have positive correlations towards intelligence specifically in corpus callosum area. The results
      showed that the Math gifted adults have increased FA in white matter tracts mainly in the structure and
      tracts connecting basal ganglia frontal lobes and parietal regions.
              The structural and functional brain changes due to aging also contributes to the intelligence
      variation in each individual. This structural changes and its contribution towards intelligence study
      analyzed by C.J.Price(2013). The degree in which IQ variations on teenagers is predicted using cross
      validation procedures ) Leave out one procedure 2) split half approach[6]. The results shown that the
      structural changes are strongly associated only with VIQ (Verbal Intelligence) more than PIQ
      (performance IQ).

              Ehsan Tadayon(2020) examined cortical morphology and its measures related to general and fluid
      intelligence. The cortical measures such as cortical thickness, cortical gyrification and cortical surface
      areais well analyzedin young adults towards intelligence. Results shown that the Thinner cortex is
      positively associated with centralized intelligence and cortical gyrification in the core region is also
      strongly associated overall intelligence. This study stated Average cortical thickness is not associated
      with centralized or fluid intelligence whereas Total cortical surface area and averagegyrificationin the
      parietal,temporal and frontal lobes showed positive association with centralized and fluid intelligence[8].
      Apart from many other variables Glen N.Saxe et al (2018)defined one more parameter as brain entropy
      and its correlation with intelligence[9].
              Existing studies stated clearly positive correlation is strongly associated with Cortical gyrification
      and intelligence. Liye wang(2015)proposed a framework for IQ estimation using extended dirty model(
      new feature selection method). Multikernel support vector regression and singlekernal SVR are compared
      and attained the average correlation co-efficient and average root mean square error for analysis. The new
      feature selection method is used on GM/WM structures for training purpose. The IQ score for the various
      subjects are obtained using GM/WM features. This extended model method shown less root means
      square error and higher correlation co-efficient[4].Kirsten Hilger(2020)investigated dorsal attention
      network regions and its associations with intelligence, proved to have higher cognitivecapability if the
      individual’s network segregation is more stable [10]. Natalia A Goriounova et al (2018). framed theory
      on neuron’s processing and neuron connectivity. The findings of this study conclude IQ level vary with
      cortical thickness using voxel based morphometry. However the dendrites size of multiple neurons in the
      associated region is measured and combined to form total dendritic length. This identified length from
      temporal region is highly correlated with human intelligence [12]. Donald J Hagler et al (2019) presented
      a study on cognitive development in adults. This study framed a pipeline of analyses and processing such

       http://annalsofrscb.ro                                                                                  2089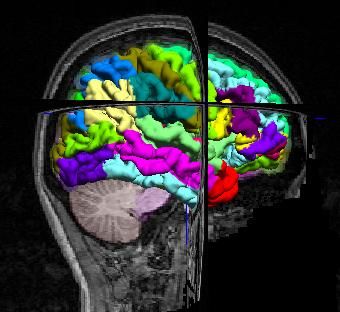
Annals of R.S.C.B., ISSN:1583-6258, Vol. 25, Issue 3, 2021, Pages. 2087 - 2101
Received 16 February 2021; Accepted 08 March 2021.

      as cortical variation, segmentation of central region, connectivity and resting state
      functionalities[11].J.Eric Schmitt et al (2019) studied and proved genetic contribution of cortical
      intelligence in dominating regions such as dorsolateral prefrontal cortex, orbitofrontal cortices, parietal
      lobes, superior temporal gyri and left lingual[14].

              Hugo G Schnak et al (2015)analyzed the relationship between cortical thickness/thinness with
      intelligence. Day by day Cortical thickness gets thicker with higher intelligence and decrease in cortical
      surface area. The technique intended to find cortical measurement in children and adults. Both in
      childhood and adolescence the variations in cortical thickness influence’s IQ level. Cortical thickness
      measured vertex wise using customized CLASP algorithm and series of image processing pipeline is
      followed [7]. Different Cortical thickness found in both the hemisphere around the age of 10 and surface
      area found to decrease in adolescents. The methodology proves that, the childhood with higher IQ has
      thinner cortex and whereas this relationship become contrary in adults , higher IQ with thick cortex.
      Coming to cortical surface area: surface area expands in intelligent children(Age: 10) , and this expansion
      continues and complete at adolescence. The surface area changes greatly in intelligent adult. The study
      defined the cortex development in various stages as : period 1 expansion of cortical surface during child
      hood(10-12, higher IQ).James J. Lee et al (2019)presented framework for within family correlation
      between brain volume and intelligence quotient. Total Brain Volume is used as vital parameter in Full
      Scale IQ , Performance IQ and Verbal IQ analysis[13].

              Heavy neuron accumulation contributes to the wide and variety of information networkstructure
      in brain’s anatomy. This wide network speeds up the information transfer and increase the knowledge
      storage. Bajaj, Sahil et al (2018)provided framework in proving this association using multiple cortical
      parameters such as cortical volume (CV), Cortical gyrification and cortical surface area with same
      subjects[15].Voxel Based Morphometry (VBM)is one of the automated technique for neuroimaging
      analysis.The VBM works on T1 weighted MRI with necessary pre-processing steps based on intensity
      variation [16].HerstonNet to analyze and study about various morphometry features. This is the modern
      optimization network architecture improvising the existing approaches and to address various other
      discrepancies[17].Gignac et al (2017) extended Pietsching (2015) investigations[18] and proved a true
      and positive correlation exist between human brain size and Intelligence Quotient [19].

     3. PROPOSED FRAMEWORK
         Based on all the above surveyit is made clear that, brain’s anatomical variation contribute highly to
      mankind intelligence. In this analysis we proposed a system framework for predicting Intelligence level
      based on following parameters Total Brain Volume (subtracting from ICV) after skull removal, GM and
      WM volume and Cortical volume using semi-automated medical image processing analysis tool called
      MeVisLab integrated with itk and vtkpackages and Brainsuite19b. This volumetric analysis helps us to
      calculate the overall neurons present in brain , which is responsible for information storage, retrieval and
      processing. This framework clearly explains the step by step procedure in using different modules for
      preprocessing and segmentation. After segmentation the statisticson the segmented regions and the total
      volume is retrieved. From previous studies, All identified parameters contribute to intelligence at
      different levels. Approximately Brain volume parameter contribute 12% variations to overall intelligence
      and other variables contribution are lowest towards intelligence variations. The Figure.1 shows us the

       http://annalsofrscb.ro                                                                                2090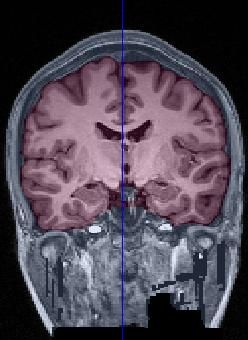
Annals of R.S.C.B., ISSN:1583-6258, Vol. 25, Issue 3, 2021, Pages. 2087 - 2101
Received 16 February 2021; Accepted 08 March 2021.

      general framework for estimating and analyzing the intelligence quotient.

          MRI Acquisition

          Preprocessing                 Vital                              Morphometric Measures
                                        Segmentation
                                        Parameters
       Skull Stripping                                                  Volumetric Analyses          Statistical Analysis
       Denoising                     Intracranial Volume                Thickness
                                                                                                     classify IQ score as
       Homogeneity Correction        Grey Matter & White Matter         Surface Area
       Registration                  Cortical Surface                   Quantifications of shape &
                                     Dendrites                          Size
                                                                        Tracts
                                                                                                     High Normal Low

                                     Figure 1: Block Diagram for estimating Intelligence

      Framework Steps to be Followed:

      Step1: Load structural and functional MRI Scan Images(T1/T2 Weighted).
      Step2: Outer Skull removal using Brain Surface Extractor or Brainsuite19b (OpenSource tools).
             Necessary Preprocessing to improvise segmentation and its accuracy. We followed Brainsuite19b
             preprocessing steps for skull removal and non-brain tissue classification while retrieving cortical
             volume.MeVisLab preprocessing modules also followed in extracting volume of the segmented
             region in voxels.
      Step3 : Segmenting Region Of Interest to measure Intelligence. Below Table 1 highlights the positively
             associated regions towards human’s intelligence.
          Brain Variables         Intelligence Associated Regions

            GM Networks                    cerebelloparetal component and frontal component.

            GM     and     WM transverse temporal gyri, left anterior cingulate gyrus, thalamus, left
            volume              parahippocampal gyrus, right opercular part of inferior frontal gyrus,
                                right amygdala, left lingual gyrus, left superior and right interior parietal
                                lobule, left angular gyrus, left paracentral lobule, left hippocampus and
                                left caudate nucleus.
            Grey Matter Density Verbal IQ - Left Motor Cortex
                                Performance IQ- Anterior Cerebellum
            Brain Volume        Cortical Thickness- Prefrontal Area
                                TBV by subtracting ICV
                                WM tracts - Genu and Splenium of the Corpus
                                Callosum,; Bilateral Rostral Cingulum Bundles; Bilateral Anterior
                                Thalamic Radiations and the Bilateral Arcuate, Uncinate and Inferior
                                Longitudinal Fasciculi.

       http://annalsofrscb.ro                                                                                               2091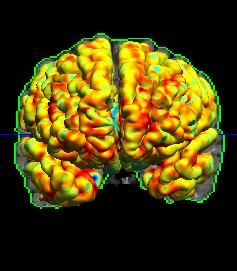
Annals of R.S.C.B., ISSN:1583-6258, Vol. 25, Issue 3, 2021, Pages. 2087 - 2101
Received 16 February 2021; Accepted 08 March 2021.

            Cortical     volume, Whole Hemisphere (GM/WM Interfaces)
            Cortical Thickness Parietal, Temporal and Frontal lobe’s cortical gyrification
            and          Cortical
            Surface area
                      Table 1: Brain Regions positively associated with Intelligence

      Step4 : In MeVisLab, The threshold values adjusted for the MeVisLab networks in segmenting ROI, the
              values are Lower Threshold Value : 200 and Upper Threshold Value : 600 and for
              CSF : Lower Threshold Value : 600 and Upper Threshold Value : 9000
      Step5 :Select initial seed points for segmenting, and the region stops growing when threshold matching
           with seed points are done. Any number of seed points can be selected until our region segments
           effectively.
      Step6 : Add image statistics modules, ROI select modules to display the volumetric status of the
              segmented volume. The table2 shows the no of voxels retrieved for subject’s MRI using
      MeVisLab.
      Step6 : Add Visualizing modules either 2D or 3D.
      Step7 : In Brainsuite19b, The cortical inner area, cortical mid area , cortical pial area, Grey Matter
              volume, White Matter Volume, GM+WM volume and Mean thickness of all parameters are
              retrieved. The volume is displayed for each registered surface of individual’s MRI.
      Step8: In every extraction stage, The various iterations parameters are adjusted in retrieving the cortical
             surface volume. The table3 displays the each surface volume extraction using Brainsuite19b.
      Step9: Based on all the volume information retrieved using tools are analyzed and compared to identify
             the overall greater volume, as the higher in volume is positively associated with Overall higher
             in intelligence.
      Step10: The greater volume contributes to higher intelligence in individual’s MRI.

     4. METHODS AND IMPLEMENTATION

           a) Image Acquisition and Pre-processing Pipeline

              The common pipeline followed in this study for MRI preprocessing is modules load, filtering ,
      denoising, 2D/3D visualization and segmenting region of interest data. MeVisLab is the popular
      prototyping tool for image processing, scripting, visualizing and layout. VTK and ITK are the extended
      version of this tool with advanced visualizing and segmenting algorithm. Wide variety of the modules are
      available in MeVisLab, a virtual Network is created using this modules and scripting can be included by
      using scripting console. Images are acquired using MRI (T1 & T2) and were it needs to be prepared
      before segmenting the core regions. Image Load is the module for loading different slices or head MRI.
      We used straight forward preprocessing pipeline from MeVisLab. Macro modules are wrapped up to
      form network and enhance using GUI. Gaussian smoothing of the loaded noisy image is done along with
      Median Filtering. The detailed preprocessing steps are skipped in this analysis and we directly analyzed
      the segmented region with statisticsparameters.The module called LoadImage and LocalImage are used
      for tiff or bmp format whereas for DICOMM files the DirectDicommImport module is used The
      different slices from individual’s MRIare imported under DICOMM tree tag.In MeVisLab The image can

       http://annalsofrscb.ro                                                                               2092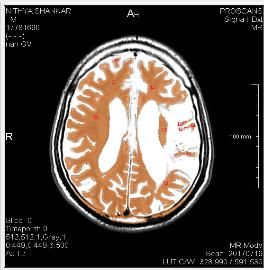
Annals of R.S.C.B., ISSN:1583-6258, Vol. 25, Issue 3, 2021, Pages. 2087 - 2101
Received 16 February 2021; Accepted 08 March 2021.

      be used after skull stripping stage to improve accuracy and efficiency. The Figure 2 & 3 shows the
      modules implemented in MeVisLab.

        DirectDicomImport(used to load                                     Gaussian smoothing->median
        all dcm slices as a single file with                               filtering ->Thresholding
        same tag name)
                                      Figure 2: Initial preprocessing modules

                                    Figure 3: Preprocessing and Visualizing

            b) Segmentation and Visualization

      Total Brain Volume :
              The vital brain variable contributes towards intelligence is the total brain volume. The totality of
      any variable’sanalysis is that we don’t miss the minor variable contribution too. Overall intelligence of an
      individual is measured based on the full volume of the brain.LoadImage or LocalImage module to load
      every slice of an individual. MultiloadFile Module is available to load all slices as single tag. Every
      individual slice volume is computed either by calculatevolume module or Imagestatistics module, where
      it computes the total number of voxels, mean and standard deviation among all the slices. Even the
      perslice view can be analyzed.Visualize MRI either using View2D or View3D modules. The below Figure
      4 shows us the modules included in MeVisLab for creating network.

        LocalImage/LoadImage                       View2D/View3D                        ImageStatistics
        /DirectDicomImport                         (Input Visualization )               (volume, mean     and
                                                                                        variance)

                                          Figure 4: Retrieval of Image statistics
        /                                        /
                                                                                        /
       http://annalsofrscb.ro                                                                                   2093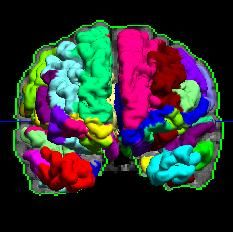
Annals of R.S.C.B., ISSN:1583-6258, Vol. 25, Issue 3, 2021, Pages. 2087 - 2101
Received 16 February 2021; Accepted 08 March 2021.
GM/WM volume:
Firm evidence states that GreyMatter and WhiteMatter volume has positive correlation with
intelligence. Image Segmentation is the process of retrieving the region of interest from image.
Segmented region and its volume is analyzed either per slice view or over all segmented volume from
individual’s MRI is computed. MeVisLabis integrated with various automatic(Thresholding, Contour
based and region growing) and semi-automatic(live wire segmentation)for segmenting and visualizing.
Choosing the initial voxel points will segment the intracranial grey matter and white matter from all
slices, the mean volume show the total GM & WM volume.Volumetric differences between every
induvial highlights the cognitive abilities and disabilities. RegionGrowMacro module used to segment
based on seed point, regions grow automatically and terminate with, when thresholding
mismatches.MarkerEditor used to hit marker points when region segments and View2DOverlay module
to view the segmented region. The volume of the segmented regions can be extracted using
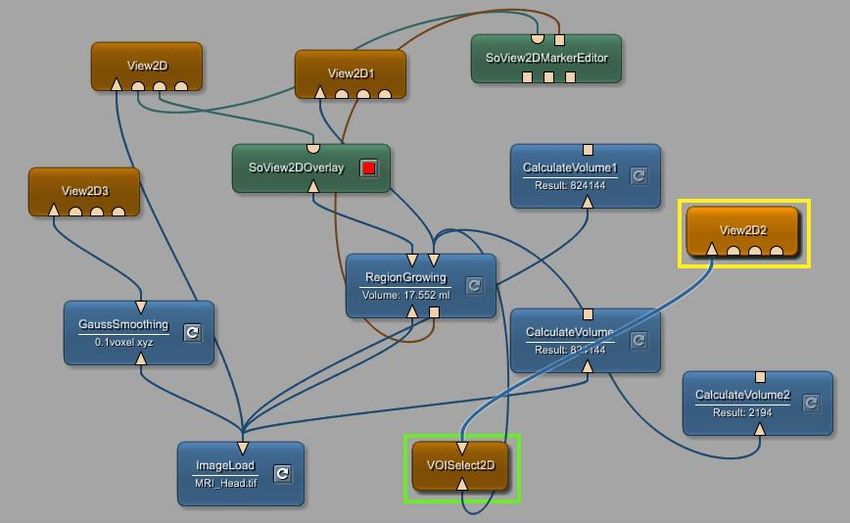
ImageStatistics and CalculateVolumemodules. Figure 5&6 shows the segmentation modules and
networkcreated for visualizing the segmented regions using DICOMM files.
DirectDicomImport RegionGrowing Macro View2D/View3D
SoView2DMarkerEditor ImageStatistics SoView2DOverlay
/ RegionGrowingMacro / /
RegionGrowingMacro
Figure 5: Segmentation Sequence and Visualizing
/
/ /
Figure 6: Segmentation Network
http://annalsofrscb.ro 2094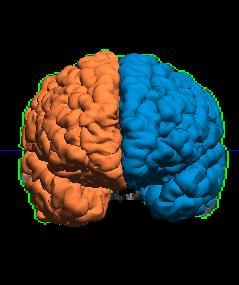
Annals of R.S.C.B., ISSN:1583-6258, Vol. 25, Issue 3, 2021, Pages. 2087 - 2101
Received 16 February 2021; Accepted 08 March 2021.
(a) (b) (c)
(d) (e)
Figure 7: a) Skull Removal b) Pial Surface c) Split Hemisphere d) Surface Registration e) Final 3Dview
after extraction
Cortical Volume Analysis:
It is proved in existing analysis that Cortex is positively associated with intelligence variations.
Cortical volume and surface area keep varying due to our age factor. This cortical volume shows us the
accumulation of overall neurons in the human brain. The larger collection of neurons increases the
knowledge storage and transfer rate. Brainsuite19b is be used along with this framework for analyzing
and extracting cortical surface and its volume ,it is the opensource tool readily available with sequence
for extracting cortical surface. The overall cortical volume of the brain reveals the collective amount of
neurons accumulated. The sequences followed until all the surfaces covered for volume extraction.
The sequence in retrieving cortical volume:
Skull stripping, Non uniformity correction, Tissue Classification.
Cerebrum labelling, Inner cortical mask, topology correction.
Split hemisphere, surface or volume registration, Labelling hemisphere.
Finally to calculate cortical thickness.
This semi-automatic tool gives us the volumetric measurements of the cortex in terms of voxels. The
Figure 7 shows the intermediate stages of brain MRI in retrieving the cortical thickness.
http://annalsofrscb.ro 2095Annals of R.S.C.B., ISSN:1583-6258, Vol. 25, Issue 3, 2021, Pages. 2087 - 2101
Received 16 February 2021; Accepted 08 March 2021.
5. RESULTS AND DISCUSSIONS:
In this proposed framework, the major contributing parameters related to intelligence variation is
analyzed using semi-automatic tools called MeVisLab and Brainsuite19b to extract volumetric
information of an individual’s MRI. The overall volume of the parameters directly relate to the higher
intelligence. The higher GM/WM volume, Total brain volume, Cortical thickness states the higher overall
intelligence. The publicly available datasets are downloaded to retrieve volumetric analysis.
The various measurement such as size, shape volume, characteristics of the brain’s central regions
are associated with intelligence and studied using Magnetic Resonance Imaging(MRI). Morphometry
measures requires many pre-processing and correction mechanisms for showing accuracy and exactness
of the region. Many manual and automated methods have been established so far on the quantification of
different morphometry measures.
Some of the defined morphometric measures are :
Total Brain Volume
Grey Matter and White Matter Region Analysis
Cortex Analysis: Cortical Surface Area, Cortical Thickness , Cortical Gyrification, Cortical
Volume
Above are the features identified related to intelligence quotient.
The below is the sample Table 2 volume extraction from the individual’s MRI using MeVisLab.
By doing the volumetric comparison the intelligence variation can be identified. Each subject’s volume
differs according to the anatomical variation. This framework can be extended to run for huge dataset to
improvise the accuracy and performance. The volume computed based on the number of voxels in region
of interest.The total voxels says the overall brain volume with inner layer and outer layer voxels. GM and
WM are segmented using initial seed points and volume statistics computed for the same. The higher, the
overall volume in different parameters , greater the intelligence variation among every subjects. Figure
8&9 is the screenshot of region growing segmentation with initial seed markers using tumor MRI and
segmentation of GM/WM region.
Figure 8: Slice View and its Segmentation
http://annalsofrscb.ro 2096Annals of R.S.C.B., ISSN:1583-6258, Vol. 25, Issue 3, 2021, Pages. 2087 - 2101
Received 16 February 2021; Accepted 08 March 2021.
(a) (b) (c)
(d) (e) (f) (g)
Figure 9: a) MRI scan (Slice) b) GM/WM segmentation c) Segmented region d) Head MRI
e) Cortical Surface representation f) Sagittal 3D view(MeVisLab Representation) g) CSF
Value(S1) Total Inner Outer
Voxels 5767168 1286192 4480976
Mean 214.72 0.01 276.35
Std. Dev 331.13 0.11 352.26
Volume mm^3 7.56407 1.68694 5.87713
After Segmentation
Segmented 1565.242 ml 4573760 1193408
volume (Voxels) (Voxels)
Mean 85.52 0.01 413.26
Std. Dev 172.56 0.01 100.63
Voxels 825600 2097 823503
Mean 156.89 0.31 157.29
Std. Dev 165.92 0.46 165.95
Volume mm^3 6.6048 16776 6.58802
After Segmentation
Segmented 825600 ml 600883 224717
volume (Voxels) (Voxels)
Mean 94.78 0.01 348.23
Std. Dev 160.34 0.01 78.68
Voxels 4854163 1396185 3457978
http://annalsofrscb.ro 2097Annals of R.S.C.B., ISSN:1583-6258, Vol. 25, Issue 3, 2021, Pages. 2087 - 2101
Received 16 February 2021; Accepted 08 March 2021.
Mean 114.72 0.01 173.47
Std. Dev 231.13 0.10 272.23
Volume mm^3 6.43576 1.48574 4.95002
After Segmentation
Segmented 1463.34 ml 2114874 2739289
volume (Voxels) (Voxels)
Mean 73.73 0.01 448.23
Std. Dev 159.34 0.01 111.23
Table 2: ROI volume in voxels
The human cortex measurements reveals the overall neurons present in the brain. The cortical
analysis takes the several parameters such as cortical thickness, cortical curvature, cortical gyrification
and overall cortical volume. Here is the belowTable 3 has the cortical area and mean thickness of
subject’s MRI. These values are retrieved using Brainsuite19b for cortical analysis. The cortical area is
the mean value of cortical area inner, cortical area mid and cortical area pial. The mean thickness and
area is averaged out to find the individual’s Cortical thickness and area. This same analysis can be
repeated for different dataset to find cortical area and thickness out of which the maximum values are
sorted. The higher cortical area and higher thickness contributes to the maximum neuron accumulation in
brain. Larger neurons in brain positively correlates with increased storage and fast information transfer
rate.
The intelligence quotient (IQ) score is the value from cognitive test conducted on individual’s
from various subjects. This score can vary according to the anatomical variations of the brain. Thus this
anatomical variations includes the volumetric measurements of region of interest. The brain variables are
identified for volumetric measurements . The overall volume is averaged out and compared among
subjects to find individual higher in intelligence. This measurements also helps in identifying the
neurological abnormalities among individual’s and in specific brain regions.
Region Mean CSF GM WM Total Cortical
Of Thickness Volume Volume Volume Volume Area
Interest (mm) (mm^3) (mm^3) (mm^3) (GM+WM) (mm^2)
ID (mm^3)
120 4.803169 14168.52 30340.63 15390.06 45730.69 8432.57
121 5.132599 13348.22 32197.21 16640.05 48837.26 8655.47
130 4.676344 6120.46 15240.03 7475.22 22715.26 4418.99
131 4.730200 5582.81 15085.19 7559.92 22645.10 4430.13
142 4.381907 1553.40 4402.16 2238.57 6640.73 1301.08
143 4.454501 1593.05 4940.17 2900.48 7840.63 1497.03
Table3 : Surface wise Volumetric Measurements
6. CONCLUSION AND FUTURE ENHANCEMENTS.
The intelligence differentiate people from one another, in turn, it proves individuals capability as
well. Previous studies shown that the brain anatomical structures, functionalities and neurons
connectivity reflect knowledge variations and are studied
http://annalsofrscb.ro 2098Annals of R.S.C.B., ISSN:1583-6258, Vol. 25, Issue 3, 2021, Pages. 2087 - 2101
Received 16 February 2021; Accepted 08 March 2021.
using fMRI and sMRI. The anatomical structure varies for every human being, By identifying the various
regions contributing to intelligence helps to quantify the individual’s abilities. The General Intelligence is
approximated by estimating the central regions of the brain. The different intelligence variations
parameters are identified and consolidated in this work to analyze overall intelligence for an individual.
This consolidation on the central regions of the brain explain individual abilities and its area
measurement defines how much the individual vary with other human abilities. This area differs not only
in adults even among children of age above 10 years. The various framework and methodologies
followed by the prior implementations ,created us a clear way of estimating intelligence using MRI.
This framework help’s researcher to view all central parameters connected to intelligence and
generalized methodology or procedure to calculate IQ. This framework identifies the amount of variation
in brain’s structure among subjects using opensource tools called MeVisLab and Brainsuite19bin
concluding the tested subjects intellectual capability. This proven results makes us clear that anatomical
structural changes are positively correlated with intelligence variations. This analysis create a clear idea
for any research scholar to know the key areas of intelligence quotient to be measured and analyzed. The
various methodologies and framework are too highlighted to identify the basic steps in proceeding with
intelligence.
Identifying the unique talent with specific region is the future enhancement of this study. This
Enhancement will clearly shows that in what specific field the individual can be excelled. According to
multiple intelligence theory the person is intelligent only in specific area and based on that assumption, it
is concluded that the particular brain region specific to that field also shows brain structural variations. In
turn, this variations measurement will conclude the capabilities of that individual acquired. The
intelligence is classified into many types so far they are.
General Intelligence: General Intelligence defines the complete knowledge of an individual. The
collective intelligence factor of both fluid and crystalized knowledge.
Fluid Intelligence: It is the type of knowledge deal with creativity and innovation. The individual with
this type of intelligence adapt to any current scenario by identifying patterns. It states, how the individual
reacts and responds in particular situation. The capabilities of this intelligence are problem solving,
analytical, reasoning, puzzles and pattern identification. High in fluid intelligence can handle Situation’s
efficiently Without any existing knowledge or training from past. Fluid intelligence keep declining after
adolescence. Initial intelligence used by any individual to learn new subject is fluid intelligence.
Logical-Mathematical: It is the ability to quantify, solve, calculate , analyze, pattern relationships and
connections, reasoning to carry out mathematical operations.
Linguistic: Intelligence related to reading , writing and word usage in the proper context.
Interpersonal skills: Good at understanding and interacting with other people.
Intrapersonal Intelligence: Individual knows to self-motivate themselves, balance their own emotions
and feelings.
Visual-Spatial Intelligence: Individual strong in visualizing things such as good with directions, maps,
charts, videos, and pictures.
Bodily-Kinesthetic Intelligence: Peoples with skills such as body movement, performing actions, and
physical control.
Naturalistic & Musical Intelligence: According to gardner’s theory this intelligence is highly interested
in environment, species, natural events and adapt to its changes. Excellent knowledge on sounds, rhythm
http://annalsofrscb.ro 2099Annals of R.S.C.B., ISSN:1583-6258, Vol. 25, Issue 3, 2021, Pages. 2087 - 2101
Received 16 February 2021; Accepted 08 March 2021.
to recognize its tone and pitch.
Crystalized Intelligence: Crystalized intelligence is based on past experience. Our past knowledge and
learning help to handle and solve problem. Improving Vocabulary knowledge by memorizing new
phrases ,words and use appropriately. This type of intelligence is more stable and increasing compared to
fluid Intelligence.
Human being survival rate depends highly on strong physical and mental ability. The strong
individual adapt easily to various environmental factors and challenging situations. Physical and logical
abilities differ in all the individuals, and which defines the outstanding nature of them. The human
intelligence is the capabilities of individual in solving challenges. The common measure of intelligence is
based on IQ test score. This framework can be extended further more for mentally challengingindividuals
to identify in what area they specifically lacking and how exactly the improvisations can be made.
REFERENCES
1. Clarkson, Matthew J., M. Jorge Cardoso, Gerard R. Ridgway, Marc Modat, Kelvin K. Leung,
Jonathan D. Rohrer, Nick C. Fox, and Sébastien Ourselin. "A comparison of voxel and surface
based cortical thickness estimation methods." Neuroimage 57, no. 3 (2011): 856-865.
2. Yoon, Youngwoo Bryan, Won-Gyo Shin, Tae Young Lee, Ji-Won Hur, Kang Ik K. Cho, William
Seunghyun Sohn, Seung-Goo Kim, Kwang-Hyuk Lee, and Jun Soo Kwon. "Brain structural
networks associated with intelligence and visuomotor ability." Scientific reports 7, no. 1 (2017):
1-9.
3. Ritchie, Stuart J., Tom Booth, Maria del C. Valdés Hernández, Janie Corley, Susana Muñoz
Maniega, Alan J. Gow, Natalie A. Royle et al. "Beyond a bigger brain: Multivariable structural
brain imaging and intelligence." Intelligence 51 (2015): 47-56.
4. Wang, Liye, Chong-Yaw Wee, Heung-Il Suk, Xiaoying Tang, and Dinggang Shen. "MRI-based
intelligence quotient (IQ) estimation with sparse learning." PloS one 10, no. 3 (2015): e0117295.
5. Navas‐Sánchez, Francisco J., Yasser Alemán‐Gómez, Javier Sánchez‐Gonzalez, Juan A.
Guzmán‐De‐Villoria, Carolina Franco, Olalla Robles, Celso Arango, and Manuel Desco. "White
matter microstructure correlates of mathematical giftedness and intelligence quotient." Human
brain mapping 35, no. 6 (2014): 2619-2631.
6. Price, C. J., S. Ramsden, T. M. H. Hope, K. J. Friston, and M. L. Seghier. "Predicting IQ change
from brain structure: a cross-validation study." Developmental cognitive neuroscience 5 (2013):
172-184.
7. Schnack, Hugo G., Neeltje EM Van Haren, Rachel M. Brouwer, Alan Evans, Sarah Durston,
Dorret I. Boomsma, René S. Kahn, and Hilleke E. Hulshoff Pol. "Changes in thickness and
surface area of the human cortex and their relationship with intelligence." Cerebral cortex 25, no.
6 (2015): 1608-1617.
8. Tadayon, Ehsan, Alvaro Pascual-Leone, and Emiliano Santarnecchi. "Differential contribution of
cortical thickness, surface area, and gyrification to fluid and crystallized intelligence." Cerebral
Cortex 30, no. 1 (2020): 215-225.
9. Saxe, Glenn N., Daniel Calderone, and Leah J. Morales. "Brain entropy and human intelligence:
A resting-state fMRI study." PloS one 13, no. 2 (2018): e0191582.
10. Hilger, Kirsten, Makoto Fukushima, Olaf Sporns, and Christian J. Fiebach. "Temporal stability of
functional brain modules associated with human intelligence." Human Brain Mapping 41, no. 2
http://annalsofrscb.ro 2100Annals of R.S.C.B., ISSN:1583-6258, Vol. 25, Issue 3, 2021, Pages. 2087 - 2101
Received 16 February 2021; Accepted 08 March 2021.
(2020): 362-372.
11. Hagler Jr, Donald J., SeanN Hatton, M. Daniela Cornejo, Carolina Makowski, Damien A. Fair,
Anthony Steven Dick, Matthew T. Sutherland et al. "Image processing and analysis methods for
the Adolescent Brain Cognitive Development Study." Neuroimage 202 (2019): 116091.
12. Goriounova, N.A., Heyer, D.B., Wilbers, R., Verhoog, M.B., Giugliano, M., Verbist, C.,
Obermayer, J., Kerkhofs, A., Smeding, H., Verberne, M. and Idema, S., 2018. Large and fast
human pyramidal neurons associate with intelligence. Elife, 7, p.e41714.
13. Lee, J.J., McGue, M., Iacono, W.G., Michael, A.M. and Chabris, C.F., 2019. The causal influence
of brain size on human intelligence: Evidence from within-family phenotypic associations and
GWAS modeling. Intelligence, 75, pp.48-58.
14. Schmitt, J. Eric, Armin Raznahan, Liv S. Clasen, Greg L. Wallace, Joshua N. Pritikin, Nancy
Raitano Lee, Jay N. Giedd, and Michael C. Neale. "The dynamic associations between cortical
thickness and general intelligence are genetically mediated." Cerebral Cortex 29, no. 11 (2019):
4743-4752.
15. Bajaj, Sahil, Adam Raikes, Ryan Smith, Natalie S. Dailey, Anna Alkozei, John R. Vanuk, and
William DS Killgore. "The relationship between general intelligence and cortical structure in
healthy individuals." Neuroscience 388 (2018): 36-44.
16. Scarpazza, Cristina, and Maria Stefania De Simone. "Voxel-based morphometry: current
perspectives." Neuroscience and Neuroeconomics 5 (2016): 19-35.
17. Cruz, Rodrigo Santa, Léo Lebrat, PierrickBourgeat, Vincent Doré, Jason Dowling, Jurgen Fripp,
Clinton Fookes, and Olivier Salvado. "Going deeper with brain morphometry using neural
networks." arXiv preprint arXiv:2009.03303 (2020).
18. Pietschnig, Jakob, Lars Penke, Jelte M. Wicherts, Michael Zeiler, and Martin Voracek. "Meta-
analysis of associations between human brain volume and intelligence differences: How strong
are they and what do they mean?." Neuroscience & Biobehavioral Reviews 57 (2015): 411-432.
19. Gignac, Gilles E., and Timothy C. Bates. "Brain volume and intelligence: The moderating role of
intelligence measurement quality." Intelligence 64 (2017): 18-29.
http://annalsofrscb.ro 2101You can also read