The Role of Corporate Tax in Ireland's Foreign Direct Investment Growth Model Samuel Brazys Aidan Regan* - Ciaran Cuffe
←
→
Page content transcription
If your browser does not render page correctly, please read the page content below
The Role of Corporate Tax in Ireland’s Foreign
Direct Investment Growth Model

Samuel Brazys
Aidan Regan*

Research report prepared for Irish delegation to the Greens/EFA group.

Please cite this publication as: Brazys, S & Regan, A (2021). The Role of Corporate Tax in
Ireland’s Foreign Direct Investment Growth Model. Greens/EFA. Brussels.

* Samuel Brazys and Aidan Regan are both Associate Professors of Political Economy at the School
of Politics and International Relations, University College Dublin (UCD).
Contact email: aidan.regan@ucd.ie
1. Executive Summary

● The Irish state has developed an export-led growth model through attracting foreign
  direct investment from global multinational life science and technology firms. The role
  of corporate tax as a strategic tool in developing this FDI-led growth model is path
  dependent with deep historical roots, dating to the late 1950’s.

● The Irish corporate tax regime has evolved over time in response to European
  regulatory changes. There are two dimensions to the corporate tax regime that need to
  be distinguished: the headline 12.5 percent corporate tax rate on trading income, and
  the targeted tax incentives that reduce the taxable income of MNEs through a variety
  of capital allowances. It is the latter that is associated with BEPS strategies.

● We develop a typology of FDI firms - phantom, hybrid, and real. We find that there is
  significant heterogeneity in the tax strategies pursued by individual MNEs, and that
  large MNEs are likely to pursue bespoke tax strategies aimed at reducing their taxable
  income. This varies year on year, depending on their expenses and capital allowances.

● We develop a new Volatility Index aimed at measuring the extent of volatility in MNE
  financial accounts and tax strategies. While there is a lot of tangible FDI in Ireland,
  leading to real job creation and predictable taxable income, most FDI is a hybrid of real
  and phantom-like activity. This hybridity is an outcome of the massive onshoring of
  IP into Ireland post-2015, which we estimate at €300 billion - excluding Apple.

● Based on the blurred lines between real and phantom FDI, we estimate that up to 50
  percent of Ireland’s corporate tax take (€6 billion) is volatile, and at potential risk from
  global corporate tax reforms aimed at tackling MNE BEPS strategies. This estimate,
  however, is highly uncertain, given the absence of clear and transparent tax data
  published at country-level by the subsidiaries of global MNE’s in Ireland.

                                                                                            1
2. Abbreviations
● BEPS Base Erosion and Profit Shifting
● CAIA Capital Allowance for Intangible Assets
● CCCTB Common Consolidated Corporate Tax Base
● CRO Company Registration Office
● CSO Central Statistics Office
● EU European Union
● FDI Foriegn Direct Investment
● GNI Gross National Income
● GDP Gross Domestic Product
● GUO Global Ultimate Owner
● ICT Information Communications Technology
● IDA Industrial Development Authority
● IP Intellectual Property
● IFRS International Financial Reporting Standards
● IFSC International Financial Services Centre
● MNE Multinational Enterprise
● OECD Organisation for Economic Cooperation and Development
● SPV Special Purpose Vehicle
● TCJA Tax Cuts and Jobs Act
● US United States
23. Introduction
Corporate tax avoidance by global multinational enterprises (MNE’s) has become a highly
salient political issue. It is central to the OECD’s inclusive framework to tackle the Base
Erosion and Profit Shifting (BEPS) strategies of MNEs, and the EU’s anti-tax avoidance
directive. Both the EU and the OECD have signalled their intention to end aggressive BEPS
strategies by MNEs, and to move toward some variant of a consolidated corporate tax base, in
addition to implementing a minimum effective tax rate. Ireland is at the centre of these debates
because it is home to multiple US subsidiaries and parent groups of the world's largest life
science and technology corporations (OECD 2020; Damgaard et al 2020).
This report contributes to these policy and scientific debates by analysing the relative
importance of corporate tax in Ireland’s Foreign Direct Investment (FDI) growth model. It
highlights the growing importance of intellectual property (IP) in attracting FDI in the life
sciences and technology sectors, identifies a growing gap between real economic activity that
takes place in Ireland and that which is recorded in the financials of Irish-registered firms but
takes place outside of Ireland - what we deem “phantom activity”. We estimate that up to 50%
of Irish corporate tax receipts may be attributable to the latter type of activity, and are thus at
risk from global tax reforms. However, these estimates are highly uncertain due to the extreme
volatility, concentration and heterogeneous nature of the economic activity of these foreign
subsidiary and inverted firms (see also Davies et al 2018; Cobham and Janský 2018).
The core takeaway from the report is that policy makers need to clearly distinguish between
real and phantom economic activity within the subsidiaries or inversions of multinational
groups operating in Ireland. This is not an easy task, however, because these firms are
increasingly interconnected through the intellectual property tax regime. This regime has
evolved over time to attract key components of FDI in the value-added sectors of the global
economy, which is now dominated by big tech and big pharma groups. Some of these firms
have a real presence in Ireland, others appear to be pure phantom or shell companies, perhaps
for tax purposes, while still others appear to be a “hybrid” of real and phantom-like activity1.
Corporate tax incentives are clearly built into Ireland’s growth strategy of attracting foreign
MNEs. Historically, this strategy has been aimed at generating the conditions for export-led
growth, and to take advantage of the EU’s single market. Ireland’s strategy has been to insert
itself into the global value and wealth chains of high-tech US multinationals, and to act as a
platform for these companies to sell into the European market. The exports from these MNEs
are increasingly the product of digital marketing and sales, which are difficult to reliably
measure in the national accounts (O’Mahony and Barry 2019; Setser 2019; Setser 2018).
1
See Daamgard et al 2020 or a global estimate of phantom FDI. They find that almost 40 percent of
what gets counted as global FDI is phantom -i.e. investment for aggressive tax planning purposes.
3The report is one of the first attempts to unpack real and phantom FDI in Ireland’s growth
model. We do this by combining data from two key sources. First, we use a time series dataset
called ‘FAME’ , which contains financial information on all Irish and UK registered companies
compiled by analytics company Bureau Van Dijk. It is an incomplete dataset because not all
companies registered in Ireland pay tax in Ireland, and not all the subsidiaries of MNEs in
Ireland have to provide country-level financial reports.2 Only the Office of the Irish Revenue
Commissioners has access to actual tax returns. Second, we use data from the Financial Times
fDi Markets database for information on real FDI flows, particularly those that lead to job
creation, and real greenfield site investments and expansions.
The rest of the report is structured as follows. First, we provide a framework for understanding
Ireland’s FDI-led growth model. Second, we explain the role of corporate tax in this model,
paying particular attention to the role of intellectual property. Third, we develop a typology for
Irish-based foriegn subsidiary and inverted firms, distinguishing between what’s real and
what’s phantom, and estimate how much corporate tax in Ireland is at risk from global tax
reforms. The final section summarises the findings.
4. Export-led growth in the European single market
Notwithstanding all of the environmental problems with our outdated concept and measure of
economic growth, it remains the core policy target of every EU government. The reason for
this is the causal relationship between economic growth and job creation. Economic growth
increases aggregate demand. This means more money is being spent in the economy. In turn,
more demand increases employment levels. However, just because an economy is growing, it
does not mean that there are more high paying, high-skilled jobs being created in society. This
depends on the type of firms and sectors that underpin productivity growth.
To generate the conditions for high-paying, high-skilled jobs, governments rely upon the value-
added of high-productivity firms (Iversen and Soskice 2020). These are firms that are typically
producing goods and services that are in demand across society, and who are selling into large
open markets, such as the EU’s single market. The simplest way to assess the value-added of
a firm is to look at its profitability and market capitalisation - which is the price it would be
sold for in an open market. There are two sectors that dominate global turnover and profits in
international markets today - technology and bio-pharmaceuticals. These are the two sectors
that dominate the exports of foreign owned firms in Ireland.
All productivity growth must eventually get distributed as income - wages, profits, and taxes.
Ireland’s domestic market is too small to generate the conditions for the productivity growth
2
For example, only one of Apple’s eight subsidiaries provides public information to Ireland’s Company
Registration Office (CRO). In cases like Apple, where the data is very opaque, we have to make
inferences based on the consolidated global financial statement of the ultimate parent company.
4that is necessary to increase national income. This is why small countries, like Ireland, typically
have a preference for the liberalisation of international trade. The core objective is to expand
the market for their domestic exporting firms. Bigger and more liberal markets means more
consumers, increased revenue, higher profit, and more jobs. For the government, it also means
more taxable income to expand the provision of public services.
The European single market is designed to encourage export-led growth across member-states
and to reward businesses that sell into the markets of other countries. The EU’s treaties are
constructed around encouraging and promoting liberal market competition. There is a large
body of research showing that this has not benefited everyone equally, and that it has clear
distributive effects - tending to reward internationally mobile workers and capital in large
transnational companies (see Dancygier and Walter 2015; Johnson and Regan 2018; Gräbner
et al 2020). But in terms of aggregate welfare, it has largely been a success, turning the
European single market into the world’s largest trading bloc (Sapir et al 2004).
Export-led growth has always been the EU’s policy recommendation for member-states to
grow their national income. But not every country can be export-led. Some small countries,
like Ireland, have only been able to develop their export model through attracting foreign
investment (Brazys and Regan 2018). Unlike most Northern European member-states, Ireland
is almost entirely dependent upon foreign-owned or inverted MNEs to generate its export sales
and grow national income. Foreign owned firms account for almost 90 percent of Ireland’s
exports, 60 percent of value added, 80 percent of all corporate taxes, and a quarter of all jobs
in the economy3 (see Irish revenue report from McCarthy 2019, and OECD 2020).
It is useful to compare the role of export-growth in Ireland to other small Northern European
economies, to get a sense of just how important exports are to the growth strategy. In Denmark,
since 2010, exports as a percentage of national income have increased from 47 to 58 percent.
In Finland, they’ve increased from 36 to 40 percent, in the Netherlands 62 to 83 percent and,
in Switzerland, from 57 to 66 percent. In Ireland, exports as a percent of national income have
increased from around 80 to over 150 percent.4 A large part of these exports, however, are not
actually produced on the island. They are simply booked as a sale in Ireland.
We will unpack the global tax strategies of MNEs in these accounting sales arrangements in
the next section. For the moment, all that is important to note is that Ireland has adopted the
EU’s preference for export-led growth through FDI. Ireland is qualitatively unique within the
EU because US MNEs in two key sectors - information and communications technology5 and
bio-pharmaceuticals - completely dominate its export strategy (see Byrne & O’Brien for how
3
IDA sponsored firms (as opposed to all foreign firms) employ approximately 260,000.
4
All of these figures come from Eurostat, with author calculations modified for Irish GNI*
5
It is not easy to classify the changing nature of digital technologies in the online world of platform
capitalism. Alphabet is an information search provider, an advertiser, a telecommunications company,
a creator of artificial intelligence, amongst other things. All of which are built around intangible data.
5Ireland’s exports have changed over time). But if the objective of the EU’s single market is to
incentivise member-states to expand their exports as a growth strategy then it has been
successful. In 1995, modified Gross National Income was equal to €50.1 billion. Today, it is
almost €215 billion (CSO 2020). That’s a 300 percent increase in less than a generation.
However, whereas modified GNI is equal to €215 billion, GDP is equal to €360 billion. This
difference can be explained by global multinationals shifting their intangible capital assets to
Ireland in response to the OECD’s BEPS process. These assets get counted in the national
accounts, even though they have little or no impact on the actual domestic economy. 6 The
extent to which the profitable income that flows from these assets is taxed in Ireland - or
elsewhere - is one of the most important questions facing European policymakers today.
5. The role of corporate tax in shaping Ireland’s FDI growth strategy
Ireland’s FDI-led growth model is the outcome of a state-led development strategy to
incentivise foreign owned MNEs to use Ireland as a platform to sell into the European market.
For decades, policymakers centred around IDA Ireland - an autonomous state agency - have
developed an arsenal of policy tools aimed at encouraging investment from foreign owned
firms. Central to this strategy is the corporate tax regime, which has evolved over time in
response to regulatory changes in the European and global policymaking environment.
The history of the low corporate tax regime is well documented, and most scholars identify its
origins in the Export Relief Act passed in 1956 (see O’Mahoney and Barry 2017, and Barry
2019a, for a comprehensive economic history of this period). Up to this point, successive Irish
governments maintained a protectionist policy on international trade, and legislated for foreign-
ownership restrictions. The objective was to reduce and restrict the British ownership of Irish
businesses and assets. But as the US replaced Britain as the global source of FDI, Irish
politicians and policymakers began to adopt a more liberal position.
From the 1960’s onwards, the Irish state commissioned several reports from US consultancy
firms, created the IDA, and gave the latter more and more influence over government policy.
In 1956 the inter-party government passed the Export Profits Relief Act, and introduced a
nationwide industrial grants scheme. In 1958, the tax relief on profit from export sales was
expanded. A 100 percent tax exemption was granted for up to ten years for firms exporting
from Ireland. Soon afterwards, the Irish government established the Shannon free zone, which
gave foreign owned manufacturers tax free status to trade from Ireland (Barry 2016; Devlin
and Barry 2019). The end goal was to eventually enter the European market.
6
It was this onshoring of intangible capital assets in response to a change in Ireland’s intellectual
property tax regime that gave rise to the moniker - Leprechaun economics. Apple is perhaps the most
well known case of this. But as we will show in section 6 - it was a far wider phenomenon.
6From the late 1950’s to the 1980’s, the Irish state basically offered any company wanting to
establish their export operations in Ireland a zero effective corporate tax rate. But when Ireland
entered the European Economic Community (EEC) in 1973, this was considered a form of state
aid, and Ireland was required to end it. However, the cut-off date to remove the preferential tax
scheme was 1980. From 1981, the tax rate would be increased to 10 percent for all FDI
exporting manufacturers. This meant that any foreign-owned company that set up in Ireland
between 1973-1980 would receive the 0 percent export tax relief until 1990.
It was this ten-year “tax holiday,” that enabled the IDA to convince Apple in 1980 to establish
their first non-US manufacturing plant in Ireland. In 1985, they were followed by Microsoft,
in 1989 by Intel, and in 1991 by Dell. Ireland quickly became the location for new and emerging
US multinational technology firms to locate their European operations (See Brazys and Regan
2017, and Bohle and Regan 2021 for more detail). Central to this was the 10 percent effective
corporate tax rate on all manufacturers exporting from the island. The outcome was a business
cluster in electronics and computer software - leading to what is now colloquially referred to
as the Celtic Tiger period of export growth (see O’Riain 2004).
At the same time, particularly from the early 1990’s, Ireland also began to attract US
pharmaceutical companies. And in 1987, as part of the creation of Ireland’s Financial Services
Centre (IFSC), the preferential 10 percent corporate tax rate was extended to financial service
firms. These three business clusters - computer software, pharmaceuticals and financial
services - created the conditions for Ireland to build an export-capital base. The core reason
why these firms established themselves in Ireland was the incentive to reduce their taxable
income, and to accumulate more net profit on their foreign-based earnings.
Intellectual property
In the mid 1990’s, some European member-states were growing increasingly sceptical of the
Irish growth model. In 1995, the EU found that the 10 percent corporate tax rate for
manufacturers was state aid, which undermined the rules of the single market. In response, the
Irish government introduced a flat 12.5 percent tax rate on all trading income for all businesses.
The headline 12.5 percent corporate tax rate on taxable profit in Ireland remains the central and
most important marketing tool of the IDA in seeking foreign investment.
However, beneath this headline rate are a series of targeted tax incentives that enable MNEs to
reduce their ‘taxable income’ through various capital allowances. 7 This is what’s most
7
Another strategy is the use of debt-based tools through special purpose vehicles (SPVs), which
underpins the Irish shadow banking sector (see Stewart and Doyle 2017 for a detailed analysis). We
don’t have space to discuss this here. This strategy has less of an impact on our study because these
funds and vehicles do not pay tax in Ireland, and do not affect the tax revenues of the state (other than
through the income taxes of those who work in financial services). It is based around funnelling wealth-
debt-assets through SPVs via the IFSC and into “sink” locations such as Luxembourg.
7controversial about the Irish corporate tax regime - the ability of MNEs to maximise net profit
by aggressively reducing taxable income. The OECD and EU’s critique of Ireland’s corporate
tax regime is not focused on the 12.5 percent headline rate. What is in question are the targeted
tax incentives that erode the tax base of other countries (Dharmapala 2014).
Central to this is reducing the taxable income that accrues from intellectual property. Since the
1990’s, MNEs in the technology and life science sectors have pursued legal BEPS strategies
that shift the profits from their IP-derived income out of high-tax jurisdictions into zero and
low-tax jurisdictions. They can do this because whilst the global corporate structure of MNEs
is transnational, the taxes that they pay are based on national laws. This allows MNEs to engage
in tax arbitrage - locating their taxable profits where they house their IP.
One of the most successful IP-based BEPS tools ever instituted was the Double-Irish tax
scheme (Zucman 2014; Ní Chasaide 2021). This originated in the 1990s, and was based around
a discrepancy between Irish and US tax law. Until 2015, and under Irish tax law, a company
could be registered in Ireland but remain tax-resident in another country if it was “effectively
managed” from there. This allowed multiple US-based MNEs to register a company in Ireland,
which for all purposes was tax resident in a country with whom Ireland has no bilateral tax
treaty, such as the Bermudas and Cayman Islands - tax havens with zero corporate tax rates8
(Clausing et al 2020; Torslov et al 2018; Wright and Zucman 2018).
This structure was particularly attractive to MNEs that generate most of their value-added and
profitable income from intangible assets - patents, brands, algorithms, ingredients, and
trademarks. An Irish-based company would basically rent and pay royalties to use the
intellectual property of the company that was tax resident in the Bermudas. Under US law, they
are one company. In Irish law, they are two companies. Most of the profits would be transferred
to the Bermudas, and remain tax free until they were repatriated back to the USA.
Some MNEs used a variant of this scheme that also avoided withholding taxes by creating an
additional subsidiary in the Netherlands. It is not clear how many MNEs used this BEPS
scheme in Ireland, or how much tax MNEs saved from the scheme. But most macroeconomic
analyses suggest that it reduced the annual effective corporate tax rate on the foreign earnings
of US-based companies based in Ireland to between 2-6 percent (Saez and Zucman 2019;
Clausing 2020a). For example, using Apple Inc’s annual 10-k statements from 2010-2017, we
estimate that their average effective corporate tax rate on foreign earnings was 3.5 percent.
Under US tax law prior to the US Tax Cuts and Jobs Act (TCJA) 20179 the Irish registered
firm was tax resident in Ireland, whereas under Irish tax law, they were tax resident in the
8
The extent to which a country can be classified as a tax haven is a matter of degree. It is a broad
spectrum with zero percent corporate tax regimes at one end, and transparent low tax jurisdictions at
the other end (Ireland, Netherlands, Luxembourg, Switzerland).
9
See Clausing 2020b for an analysis of profit shifting before and after the Tax Cuts and Jobs Act.
8offshore British territory where they located their IP assets. On the one hand, this meant that
the company was effectively tax resident nowhere. But on the other hand, US MNEs are
obliged to pay tax on their foreign earnings if and when they are repatriated back to the US.
This ambiguity meant that legally speaking, they were not avoiding their tax obligations. 10 It
just meant that US MNEs could accumulate hundreds of billions tax free for a period of time.
Another strategy that US MNEs have pursued to reduce their US-based tax obligations -
particularly MNEs in the bio-pharmaceutical sector - is corporate inversions (see Cooper and
Nguyen 2020 for a detailed explanation). Under the Double-Irish scheme, the parent company
remains in the US. But in a corporate inversion, the legal status is inverted. US MNEs shift the
incorporation of their Global Ultimate Owner (GUO) to Ireland. US companies become
subsidiaries. Inverted parent firms typically have little to no real presence in Ireland. They
simply use their Irish-company status to hold and direct investments in other countries. As we
will show in the next section - it’s difficult to know what taxes they pay.
Capital allowances for intangible assets
In 2015, Ireland shut down the double-Irish scheme in response to growing pressure from the
EU and the OECD. This pressure emerged after the US Senate explicitly identified Apple’s tax
arrangements in Ireland as a form of tax avoidance. This then led to the now infamous Apple
tax case by the European Commission. 11 But whilst the double-Irish scheme was closed in
2015, MNEs that had been using the structure were given until 2020 to restructure their tax
affairs. As shown in Figures 1 and 2, these five years have upended Irish FDI data.
In the same year, the Irish Department of Finance changed the intellectual property tax regime
in Ireland. This was aimed at encouraging US MNEs to onshore their intangible assets to
Ireland by increasing the capital allowance for expenditures on intra-group purchases of
intellectual property to 100 percent.12 In addition, MNEs could issue their own debt to purchase
their own assets. Combined, this meant that an Irish-based US MNE could issue an intra-group
loan to purchase their own IP and move it out of a blacklisted tax haven to Ireland, without
incurring any additional taxes in the process (Clancy & Christensen 2018).
From 2015 onwards, rather than rent and pay royalties to use the IP located in the Bermudas
and elsewhere, the Irish government gave US MNEs an incentive to locate it directly in Ireland
10
See Thomas Hubert 2020, for a series of excellent articles on US multinational tax strategies.
11
Apple used a variant of the double-Irish scheme except the two subsidiary companies that enabled
the profit shifting were based within Ireland, and not in an offshore British territory (see Coffey 2018
for more detail) This structure led the Commission to declare that what was occurring in Ireland was a
form of illegal state aid. The ECJ found against the Commission, who are appealing the case.
12
It is important to note that in 2009, the definition of what is included in the legal definition of
intangible assets was significantly widened to include various different forms of “know-how” and “good
will”. This is broad enough to cover almost everything that cannot be seen or touched.
9- not least in preparation for the OECD’s clampdown on BEPS. The taxable income that would
flow from this IP would be significantly reduced because they could be written off against the
cost of purchasing the IP. This is known as the capital allowance for expenditure on intangible
assets (CAIA). As we will show in the next section, this incentive worked. From 2014 to 2019
our estimates show that Irish-registered firms, even when excluding Apple, recorded increases
of over €300 billion worth of intangible assets holdings.
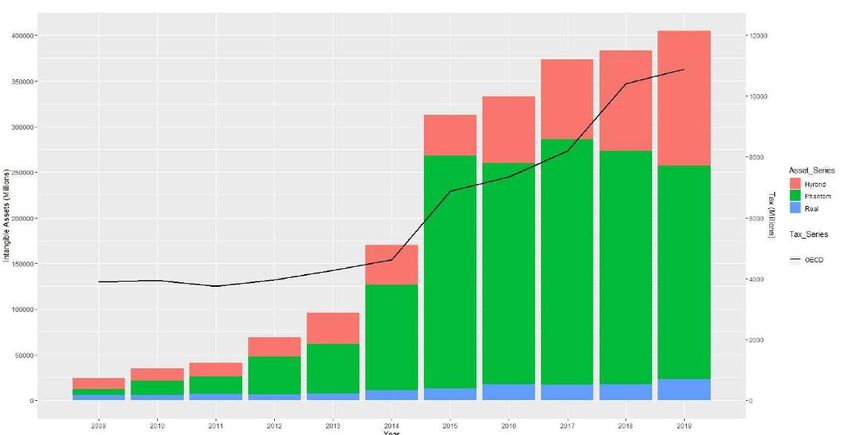
Apple is the most cited case of how the onshoring of intangible assets post-2015 has distorted
the Irish national accounts - a distortion that is directly observable in the sharp increase in the
stock of FDI in figure 2. It’s well documented that Apple is likely to have moved the license to
use its intellectual property to Ireland - and that the vast majority of its European and global
sales are booked in their Irish-based subsidiaries. We don’t have financial data on each of these
subsidiaries, as it is not publicly available, and therefore Apple is not in our FAME data.
However, our analysis suggests that Apple is only part of the intangible story.
To get a picture of Apple’s role in Irish corporate tax, we collected all of their 10-K globally
consolidated financial statements from 2010-2020. This data shows very clearly that Apple’s
tax structure changed post 2015. From 2010-2015, they paid an average effective corporate tax
rate of 3.3% on their foreign earnings. But from 2015-2020, this increases to 10.2%. In 2020,
they had global revenue of €274 billion, gross profit of €105 billion, and net profit of €57
billion. In the same year, they specify that €6.5 billion in taxes will be paid on their foreign
earnings. Given that Apple’s Irish-registered subsidiaries are central to their global sales
network, European accounting activities, and IP-derived income, some of this €6.5 billion is
clearly paid to the Irish state. If only 15 percent of it was paid to the Irish government, it would
amount to €900 million - more than the entire Foreign Affairs budget.
In 2018, and in response to a corporate tax report written by Seamus Coffey (2017), the
government acknowledged that the CAIA-BEPS tool incentivised aggressive tax planning.
They reduced the capital allowance back to 80 percent of trading income. This means that not
all of the taxable income accruing from the IP can be reduced. At least 20 percent of the income
has to be taxed in Ireland. There is no public data on how much of Ireland’s corporate tax
receipts since 2015 are directly attributable to this IP-derived income. We also don’t know how
much of the MNE profit that is declared in Ireland is associated with this onshoring of IP. But
we do know that taxing IP-derived profitable income is highly lucrative.
What we know from publicly available revenue data is that Irish corporate tax receipts have
increased from 6 billion in 2015 to 12.5 billion in 2020. This amounts to over 20 percent of
the total tax take of the Irish state, and almost equal to the entire Irish education budget. As we
will show in the next section, this increase in corporate tax is a function of increases in both
real and phantom-like economic activity. It has not been mirrored by any significant increase
in new job-creating FDI. In particular, there is a strong correlation with the sharp increase in
the onshoring of intangible assets from phantom and hybrid MNEs (see figure 3).
10Figure 1: FDI Stock as % of GDP 2019. Source: OECD. https://data.oecd.org/fdi/fdi-stocks.htm
11Figure 2: FDI Stock as % of GDP 2009-2019. Source: OECD. https://data.oecd.org/fdi/fdi-stocks.htm
12Figure 3: Intangible Assets by Firm Category and OECD Corporate Tax.
Sources: http://www.oecd.org/tax/tax-policy/corporate-tax-statistics-database.htm,https://fame.bvdinfo.com/, Authors’ Calculations
13Figure 4: Real FDI flows by Sector and Year
Source: https://www.fdimarkets.com/, Authors’ Calculations
146. Classifying real and phantom FDI in Ireland
In order to disentangle real and phantom economic activity, in this section we develop a
typology of foreign firms that operate in Ireland. To do so, we draw on two primary data
sources: the Financial Times fDi Markets database 13 and the Bureau Van Dijk FAME database
on UK and Irish Financial Company Information. 14 These sources provide information on new
and greenfield FDI projects and the financial statements of Irish registered companies,
respectively. Within the FAME database, we consider both Irish-registered firms with a foreign
GUO, and Irish-registered firms that are GUOs and tax-domiciled in Ireland but whose
substantial corporate presence resides outside Ireland, i.e. inverted firms (for a detailed analysis
of different types of FDI profiles in Europe, and where Ireland fits in a comparative perspective,
see Reurink & Garcia-Bernardo 2020).
We use this data in an attempt to identify the extent to which foreign or foreign-inverted firms
undertake real economic activity in Ireland or are, instead, merely phantom-like corporate
structures that may be taking advantage of the various CAIA-related tax incentive schemes
described in the section above. As discussed, the primary driver behind those tax structures
relates to the accounting and tax practices of IP-derived income and other intangible assets. 15
The financial data in the FAME database is compiled from the annual International Financial
Reporting Standards (IFRS) statements of Irish registered companies. This data includes
information on assets, financials (revenue, tax, profit) and employment, amongst other
variables. While this information may pertain to these flows inside Ireland, it does not
necessarily indicate as such. In other words, what is reported in the financial statements of these
firms may not be indicative of activity that is taking place within Ireland (see also Stewart 2018
on the variation in MNE tax strategies in Ireland). We identify 14,464 registered companies in
the FAME database with annual turnover of €1 million euros or more in any year in the data
(2002-2019). From these firms, we identify 5,320 unique GUOs.
In order to classify firms, we use these financial statements to look for volatility in key metrics
to construct a Volatility Index. Our core assumption is that a high-degree of volatility in the
financial statements of Irish-registered firms is indicative of increased shifts in assets, profits,
13,
www.fdimarkets.com
14
https://fame.bvdinfo.com/
15
Where the International Accounting Standards define intangible assets as: “an identifiable non-monetary asset
without physical substance. An asset is a resource that is controlled by the entity as a result of past events (for
example, purchase or self-creation) and from which future economic benefits (inflows of cash or other assets) are
expected. [IAS 38.8]”. Examples include: patented technology, computer software, databases and trade secrets
trademarks, trade dress, newspaper mastheads, internet domains, video and audiovisual material (e.g. motion
pictures, television programmes), customer lists, mortgage servicing rights, licensing, royalty and standstill
agreements, import quotas, franchise agreements, customer and supplier relationships (including customer lists),
marketing rights https://www.iasplus.com/en/standards/ias/ias38 accessed 09-02-21
15and employees that are solely occurring on paper, i.e. “phantom” practice. This Index is
constructed from identifying volatility at the GUO level in three key variable measures in the
annual financial statements: reported tax, reported employment, and reported intangible assets.
We choose these series as we are ultimately interested in firm-level estimates of tax.
Post 2015, we assume that phantom-like economic activity is largely occurring through the
reporting of intangible assets. We consider employment figures as data where a high-degree of
volatility is both indicative of phantom practice but is also often easily verifiable on a firm-by-
firm basis. This is because large increases (or decreases) in employment are likely to be
externally reported upon. The higher the volatility of these variables, the higher the phantom-
like economic activity in the index. While the full methodology for constructing this index is
available in the Technical Appendix, we note that the index is formulated in such a way that
larger firms will, by construction, have higher scores. This is by design as ultimately we are
interested in those larger MNEs that account for an overwhelming share of corporate tax paid
in Ireland. As noted by McCarty (2019) and others, MNEs in the Large Corporate Division
(LCD) of Revenue paid 80 percent of all net corporate tax receipts.
Table 1 presents the MNEs which score the highest on the Volatility Index, while Table 2
presents a selection of other major firms with lower Volatility Index scores16. In order to create
a typology of firms, alongside this information, we combine information from the fDi Markets
database on reported FDI project flows. The fDi Markets data uses open source information to
compile a project-based list of real tangible investments. While the data primarily relies on
project announcements, the data is updated to reflect announcements which may not have come
to fruition. The data also includes information on actual investment amounts, and the number
of jobs created. Where those data are missing, fDi Markets estimates values. In Tables 2 and 3
we present the total count of FDI projects, the total (estimated) value of those projects and the
total (estimated) number of jobs created by those projects. We use this data as our primary
metric for assessing real FDI activity in Ireland - as it is most reliably associated with real
employment, and real job creation.
A number of suggestive descriptive statistics can be gleaned from these fDi Markets data, to
get a sense of the real FDI in Ireland. First, from 2002-2020 1,544 of the projects (45 per cent),
estimated at some $70 billion (55 per cent), come from US firms. The next closest source
market is the United Kingdom with 845 projects worth $25.5 billion. Collectively, inward FDI
from countries in the European Single Market accounts for only 15 per cent (504) of projects.
Ireland’s FDI growth model is clearly dependent upon inward investment from the USA. As
discussed earlier, these MNEs use Ireland as a platform to export goods and services to the
500+ million European Single Market, and further afield.
16
Note again that Apple is not in this FAME data because seven out of eight of is Irish-based
subsidiaries do not provide company-level data to Ireland’s CRO. The reason behind this is that the
parent company - Apple Inc - guarantees all their liabilities, and publishes consolidated accounts.
16Turning to the sectoral breakdown of these inflows, it is evident that they are dominated by
high-tech goods and services. Figure 4 shows that software and IT services have been the single
largest sector in terms of FDI projects (worth $36.7 billion). However, beyond ICT, the top
ten-10 sectors for inward investment are also dominated by high-tech services in health,
business and financial services. For the health and life science sector, this includes $22.7 billion
in pharmaceuticals, biotechnology, and medical devices.
17Table 1: Foreign and Inverted Firms “Volatility Index” (Monetary amounts in Thousands)
Global Ultimate Owner Volatility Max Tax (Euro) Category FDI # FDI Amt. (USD) FDI Emp
ABBVIE INC. 100 183,696 H, C 2 183,696 150
ACCENTURE PUBLIC LIMITED COMPANY 67.97 1,472,037 I, H, C 3 54,100 350
MEDTRONIC 59.95 2,322,395 I, H, C 3 107,400 235
JOHNSON CONTROLS INTERNATIONAL PUBLIC LIMITED 33.82 1,466,606 I, H, C NA NA NA
COMPANY
LINDE PUBLIC LIMITED COMPANY 30.41 866,063 I, H, C 1 7,200 78
DANONE 23.81 842,000 H, C 3 123,590 135
ADIENT PUBLIC LIMITED COMPANY 22.33 1,507,900 I, C, P NA NA NA
EATON CORPORATION PUBLIC LIMITED COMPANY 20.49 358,792 I, C, P NA NA NA
MALLINCKRODT PUBLIC LIMITED COMPANY 18.55 69,244 I, H, C 1 11,160 40
TRANE TECHNOLOGIES PUBLIC LIMITED COMPANY 16.41 458,931 I, C, P NA NA NA
ENDO INTERNATIONAL PUBLIC LIMITED COMPANY 16.03 770,442 I, C, P NA NA NA
SEAGATE TECHNOLOGY PUBLIC LIMITED COMPANY 12.50 214,817 I, C, P NA NA NA
UNITEDHEALTH GROUP INC. 11.70 542,047 H, C 1 10,400 200
WEATHERFORD INTERNATIONAL PUBLIC LIMITED COMPANY 11.70 435,214 I, C, P NA NA NA
PERRIGO COMPANY PUBLIC LIMITED COMPANY 11.59 144,026 I, C, P NA NA NA
WILLIS TOWERS WATSON PUBLIC LIMITED COMPANY 11.45 142,033 I, H, C 1 17,600 40
PEPSICO INC 8.70 30,106 H, C 10 168,500 359
ALPHABET INC. 7.31 562,581 H, C 15 1,833,597 4,114
PENTAIR PUBLIC LIMITED COMPANY 7.26 163,689 I, C, P NA NA NA
GILEAD SCIENCES INC 6.71 457,241 H, C 7 173,230 491
ANALOG DEVICES INC 6.63 13,056 H, C 2 100,440 158
MICROSOFT CORPORATION 5.76 473,960 H, C 18 2,531,820 3,124
REGENERON PHARMACEUTICALS INC 5.41 5,518 H, C 5 1,439,000 1,177
Source: fDi Markets; FAME; Authors’ calculations.
C=CAIA, H=Hybrid,I=Inverted, R=Real
Table 2: Selected Other Irish Registered Companies with Foreign Global Ultimate Owners (Amounts in Thousands)
18Global Ultimate Owner Volatility Index Max Tax (Euro) Category FDI # FDI Amt. (USD) FDI Emp
ORACLE CORP 5.14 234,798 H, C 3 237,700 575
ADOBE INC 2.39 264,030 H, C 1 88,500 65
MR MARK ELLIOT ZUCKERBERG 2.31 167,851 H, C 16 1,349,488 2,977
MR MICHAEL SAUL DELL 2.22 238,294 H, C 13 315,200 1,399
BRISTOL-MYERS SQUIBB COMPANY 1.81 211,434 H, C 3 1,090,000 570
CK HUTCHISON HOLDINGS LIMITED 1.70 23,544 H, C 10 321,580 607
GENERAL ELECTRIC COMPANY 1.67 130,829 R 5 229,860 383
VERIZON COMMUNICATIONS INC 1.50 100,586 H, C 4 119,800 206
AXA SA 1.35 99,454 R 6 48,500 596
SUSQUEHANNA INTERNATIONAL HOLDINGS LLC 1.29 73,609 H, C NA NA NA
SAP SE 1.10 139,966 R 8 313,780 1,023
ABBOTT LABORATORIES 1.01 28,186 R, C 11 681,320 2,190
CHINA-PEOPLE'S REP. 0.82 64,589 H, C 1 67,200 51
ALLIANZ SE 0.81 68,538 R 6 77,100 363
TAKEDA PHARMACEUTICAL COMPANY LIMITED 0.43 26,751 R, C 6 360,448 359
EBAY INC 0.42 2,761 R 12 576,330 2,544
AMAZON.COM, INC. 0.41 13,644 R 24 2,737,479 4,620
INTESA SANPAOLO 0.36 57,648 R NA NA NA
AMGEN INCORPORATED 0.18 12,894 H, C 3 314,400 145
GROSVENOR CLEANING SERVICES LIMITED 0.17 723 R 1 1,889,760 6,220
INTERNATIONAL BUSINESS MACHINES CORP 0.14 7,885 R 21 785,368 2,110
PFIZER 0.13 8,676 R 14 1,620,050 1,389
INTEL CORP 0.10 5,002 R 14 7,397,130 5,359
MERCK & CO., INC. 0.06 4,396 R 21 2,576,679 2,216
JOHNSON & JOHNSON MANAGEMENT LIMITED 0.04 2,444 R, C 17 2,443,399 2,005
SCHWARZ BETEILIGUNGS-KG 0.02 2,515 R 31 896,770 2,475
TESCO PLC 0.01 609 R 41 1,703,161 6,673
ELI LILLY AND COMPANY 0.01 253 R 6 1,696,300 1,082
Source: fDi Markets; FAME; Authors’ calculation
C=CAIA, H=Hybrid,I=Inverted, R=Real
19Collectively, we use all our data sources to classify MNEs into three broad categories: Real
(R), Hybrid (H), and Phantom (P). We further investigate the FAME records of all these firms
to assess to what extent they report a large amount of intangible assets. Those that have large
and/or highly variable amounts of intangible assets we also classify as CAIA (C). We stress that
these categorizations are for conceptual and classification purposes only. They help separate
real from phantom activity, but they are not meant to imply that any specific firm in Table 1 or
2 is engaged in any particular type of tax behaviour. Instead, these classifications are merely
descriptions based on the financials reported in the FAME database. Those global multinational
firms whose GUO is tax-domiciled in Ireland, but have major operations outside of Ireland, are
classified as Inverted (I).
Firm Heterogeneity
We take two high-level inferences from this classification exercise. First, there is a high degree
of heterogeneity amongst Irish registered subsidiary and inverted firms. MNEs in Ireland have
very different financial profiles, and are likely to be engaged in different strategies to reduce
taxable income. Some display remarkable consistency in reported employee numbers, tax,
intangible assets, and other figures. This is reflected by low Volatility Index scores in Tables 1
and 2. Many of these MNEs have numerous real FDI projects with large (estimated) amounts
of investments and jobs. Many of these firms also do not report significant, if any, intangible
capital assets, although some do (Johnson & Johnson, Amgen, Takeda for example). We
classify these types of firms as ‘real’ and think it is highly likely that most of their reported
financial and company information reflects real actual economic activity based in Ireland.
The second variant of firms are those that we classify as ‘hybrid’. These are MNEs that have
some meaningful physical presence in Ireland, but those whose volatility in reported financials
would suggest that portions of their reported activity in employment, tax, and intangible assets
are “on paper” only. These MNEs cluster towards the higher end of our Volatility Index, but
even within these, there are varying degrees of hybridity. The three top MNEs in our Index –
Abbvie, Accenture, and Medtronic – all have a real physical presence in Ireland (as evidenced
by real amounts of FDI and job creation). However, they also have financials that appear
largely disconnected from their physical Irish presence.
Notably, each of these three MNEs only report a handful of real FDI projects from the early
2000’s (2 or 3 announcements). But since 2009, they have also reported a massive increase in
their intangible assets as shown in Figure 5. The scale is substantially distorted by the leading
MNE in our Volatility Index, Abbvie Inc., whose Irish-registered subsidiaries reported over
€200 billion in intangible assets in 2019. Notably, this figure jumped from €2.7 billion in 2011
to over €100 billion by 2015. Similar volatility can be seen in the reported employment and
tax figures. Employment jumped more than 10-fold from less than 3,000 employees in 2011 to
nearly 30,000 in 2017. Likewise, tax swung from a reported payment of over €250 million in
2012 to a credit of roughly €6 billion in 2017. Much of this activity was reported by a single
20subsidiary, Allergan Ltd. While Allergan does have a substantial manufacturing and
commercial presence in the West of Ireland, these figures almost certainly represent activity
from beyond Abbvie Inc.’s Irish subsidiaries.
Figure 5: Abbvie, Accenture and Medtronic Reported Intangible Assets
Source: FAME; Authors’ calculations
Finally, the third category includes firms that score high on the Volatility Index, and report
large, but volatile, figures in employment, tax, and intangible assets in the financial statements
of their Irish-registered subsidiaries or GUOs. These appear to have little, if any, real presence
in Ireland. We classify these as ‘phantom’ firms. As seen in Table 1, most of these firms are
inverted, where the Irish-registered firm is the GUO but the majority of the firm’s activities
take place outside of Ireland. We could not find any record of these firms having FDI projects
in the fDi Markets databases (our best data for real FDI). We note the possibility that some of
these firms could have real activity which has not been reported in, or pre-dates, the fDi
Markets data, and again stress that this classification is not meant to imply that any particular
21firm in this classification is engaged in any particular form of tax planning strategy. The
“phantom” designation merely reflects a high degree of volatility in their observed financial
statements, and a lack of any observable data on real presence in Ireland.
Many of the corporations classified in this phantom category appear to be ‘post-box’ firms that
are registered in Ireland for tax purposes only. A prime example of this is Adient Public Limited
Company, which is registered at 25-28 North Wall Quay, IFSC Dublin 1 D01 H104, which is
the address of the law firm A&L Goodbody. This is the address of multiple Irish-registered
post-box firms in the FAME data. Yet, despite having no apparent real presence in Ireland, in
2016 Adient reported €13.8 billion in revenue, €1.5 billion euros in tax, 75,000 employees and
€1.8 billion in intangible assets.
A final observation is that there are very different types of MNEs within each of our three
classifications. While all of the firms we identify as purely “phantom” are inverted, not all US
firms that have inverted legal status are “phantoms”. Likewise, while most “real” firms do not
appear to have substantial intangible assets, some do. Finally, there are no hard and fast rules
with respect to the sector. While retail and financial services firms tend to cluster in the “real”
category, and pharmaceutical or IT service firms tend to cluster in the “hybrid” or “phantom”
categories, there are out-of-category examples in each.
Our take-away from this is that individual MNEs may well pursue very specific and bespoke
tax strategies with regards to their economic activities in Ireland. We cannot speak in
generalities about the nature of foreign or foreign-inverted MNEs registered in Ireland. There
is significant heterogeneity and volatility across these firms. This means that the effective
corporate tax rate in Ireland is likely to vary not only by sector, but also by firm. This poses a
significant challenge for analysing the consequences of global tax reform on Ireland’s
corporate tax take, as discussed further below.
Firm Volatility
Our second high-level takeaway is that there is substantial volatility, at the firm level of MNE
subsidiaries in Ireland, year-on-year. This is captured, to some extent, by the Volatility Index,
but it is worth highlighting a few selected firms in the FAME data to illustrate these dynamics,
especially when there are “missing” reports in the FAME data which are not captured by the
Index. Danone Limited - a subsidiary of the French multinational food group, and another firm
registered at 25-28 North Wall Quay, reported €21 billion in revenue in 2015, no reported
turnover in 2016, and €25 billion in revenue in 2017. Likewise, their intangible assets jumped
from €16 billion in 2015, to none reported in 2016, to €25 billion in 2017. Notably, in 2016
Danone Ltd. invoked Section 357 of the 2014 Companies Act which allowed its ultimate
parent, Danone S.A, to substitute its filing with the filing of Danone S.A. While we cannot
speculate why Danone would only pursue this strategy in 2016, it remains illustrative of the
volatility in the financial statements of some Irish-registered companies.
22In contrast, other MNEs see relatively consistent financials that are then punctuated by a major
change, either upwards or downwards. For instance, Pepsico Inc. reported profits of €85.7
million in 2016, €57.2 million in 2017, and €61.1 million in 2018, before jumping to a
whopping €2.6 billion in 2019. Likewise, their reported tax jumps from an average of €1.1
million between 2016 and 2018, to €30 million in 2019. Most strikingly, however, Pepsico
reported no intangible assets in any year through 2018, only to report €31.2 billion worth of
intangible assets in 2019. This is despite Pepisco’s most recent FDI investment only being a
€14.5 million project in 2017, which created 40 jobs.
Or to give three examples of volatility in the big tech sector. Facebook reported intangible
assets held in Irish-registered companies in 2016 of €660,000. This then jumped to €656 million
in 2017 and €704 million in 2018 before falling to €4.5 million in 2019. The combined financial
statements of Microsoft's subsidiaries in Ireland suggest they paid €180 million in tax in 2014,
before jumping to over €470 million in 2018. Google’s accounts suggest €53 million in taxes
were paid to the Irish state in 2015, increasing to over €560 million in 2019. Again, while these
are just illustrative examples, they are suggestive that MNEs adjust their Irish-registered
corporate structure and reporting, year on year, resulting in substantial changes in their reported
financial accounts. This volatility has important consequences for trying to plausibly estimate
how much corporate tax revenues might change in response to proposed OECD and EU tax
reforms as discussed next.
7. The impact of phantom FDI on Irish corporate tax
To effectively estimate tax exposure we would need firm-specific information on tax receipts
and tax returns. Only Revenue has this firm-level data and it is kept highly confidential.
Accordingly, in this section, we attempt to identify the proportions of Irish tax revenue
attributable to each category of firm discussed above - real, phantom and hybrid - to assess how
much tax might be lost from global and European tax reforms. This requires a firm-level
approach, but given the likely inclusion of “phantom” tax reporting (i.e. taxes that are reported
in the financial statements of Irish-registered subsidiaries or GUOs but not ultimately paid to
Irish Revenue) conventional methods of estimating firm-level tax are not fit for purpose when
using the FAME firm-level data. The likelihood of “phantom” figures in other series, such as
employment, profit or revenue, further means that other conventional indirect measures, such
as tax-estimates based on revenue or profit per employee are also not feasible. Accordingly,
we develop an approach to firm-level tax estimation where we effectively weight reported tax
by our Volatility Index under the assumption that proportionally less of the tax reported by
these firms was actually paid to Irish Revenue. Full methodological details of these estimates
can once again be found in the Technical Appendix.
However, given the somewhat unconventional nature of this approach, we caveat the exercise
by underlining the high degree of uncertainty in these estimates. This is due to the firm
heterogeneity and volatility discussed above, and to the evident concentration of corporate tax
23payments amongst the top 25 MNEs. As shown in the 2018 Irish Revenue Commissioner data,
just ten MNEs account for 40 percent of all corporate tax payments, whilst 100 firms account
for over 70 percent of all corporate tax payments. MNEs in the Large Corporate Division
(LCD) of Revenue paid 80 percent of all net corporate tax receipts (see McCarthy 2019 for
more detail). This high concentration of tax receipts among a small number of global
multinationals means that Ireland is qualitatively unique within the advanced capitalist
democracies of the world. Standard tax estimate models are not easily applicable.
Our estimates are displayed graphically in Figure 6. The ‘real’ and ‘hybrid’ series are estimated
using the reported tax from the FAME data weighted by the volatility index aggregated by firm
classification, while the ‘phantom’ series is the residual difference between the other two series
and the reported aggregated corporate tax figures from the OECD. There are three observations
we make from these estimates.
Figure 6: Estimated Real, Phantom, and Hybrid Corporate Taxes in Ireland
Source: OECD, FAME, authors calculations
First, the ‘real’ series shows a stable trend of upward increases of about 13% every year with
a low volatility as indicated by the narrow blue shaded interval on either side of the blue line.
24We estimate that tax receipts from “real” firms accounted for €3.16 billion of the corporate tax
receipts in 2019, or roughly 29% of the total. Based on the assumptions in our Volatility Index,
we consider these receipts to be a low risk from any global corporate tax changes coming from
the OECD BEPS process. These revenues come from the 5,234 GUOs with at least 1 million
in turnover in any year between 2002 and 2019.
Second, we see that the largest share of corporate tax comes from the 73 GUOs with Volatility
Index scores between 1 and 15. We also see that the volatility of these flows increases
substantially, with estimated volatility of +/- €500 million euros by 2019. The €4.1 billion in
estimated tax from these firms in 2019 accounted for 37% of tax receipts and, notably,
represented a roughly €700 million decrease from the 2018 estimate. These revenues come
from MNEs who generally have some real FDI presence in Ireland, but whose financial
statements of Irish subsidiaries would also suggest a level of “phantom-like” activity that may
be tied to the pursuit of particular tax strategies. This leads us to consider there is moderate
risk to these receipts due to global corporate tax reform measures
Third, we see that, since 2015, the largest growth in estimated tax comes from the 13 GUOs
which scored 15 or higher on our Volatility Index plus any firms not in the FAME data. This
likely includes the majority of Apple’s Irish presence. Notably, our estimates of these receipts
decline sharply into 2013 and 2014, coinciding with the end of the Double Irish tax strategy,
but then jump markedly in 2015, coinciding with the 100% CAIA allowance and then again in
2018 and 2019, coinciding with US tax reform. These estimates show, by far, the greatest
volatility, with the volatility on the 2019 estimate spanning a range of nearly €3 billion around
the point estimate of €3.7 billion. The concentration of these receipts on a handful of MNEs,
combined with the high degree of volatility in their financial statements, leads us to conclude
there is a high degree of risk surrounding these corporate tax receipts.
Again, without accurate and transparent data on company-specific tax returns, it is difficult to
precisely estimate the tax shares and the tax impacts of regulatory changes. With that caveat,
we extrapolate our estimates for each series, with inferred values given by the dashed lines.
The same-coloured dotted lines indicate the 95% confidence interval of the extrapolations,
meaning that the tax will fall in that range with a 95% probability. The larger this interval, the
more uncertain the estimate. We note that these deductions are based solely on past trends and
do not account for potential changes in tax structures or external shocks like COVID 19 which
could substantially alter the estimates. That said, our extrapolated value for 2020 is €12.3
billion in total tax receipts, which corresponds very closely to the Department of Finance’s
preliminary forecast in October 2020 of €12.5 in total receipts. Likewise, our model estimates
that roughly 70% of Irish corporate tax receipts come from fewer than 100 “phantom” and
“hybrid” firms. These numbers are very much in line with the 2018 Irish Revenue figures
(McCarthy 2019).
25You can also read