The second demographic transition, 1986- 2020: sub-replacement fertility and rising cohabitation-a global update - Genus
←
→
Page content transcription
If your browser does not render page correctly, please read the page content below
Genus
Lesthaeghe Genus        (2020) 76:10
https://doi.org/10.1186/s41118-020-00077-4

 ORIGINAL ARTICLE                                                                                                                                Open Access

The second demographic transition, 1986–
2020: sub-replacement fertility and rising
cohabitation—a global update
Ron Lesthaeghe1,2,3

Correspondence: RLesthaeghe@
yahoo.com                                Abstract
1
 Free University of Brussels (VUB),
Brussels, Belgium                        The article considers the evolution of two “Second Demographic Tradition” (SDT)
2
 Royal Flemish Academy of Arts           core characteristics: fertility postponement and the rise of cohabitation, with
and Sciences, Brussels, Belgium          particular attention being given to the first two decades of the new century. It can
Full list of author information is
available at the end of the article      be considered as the sequel to the concise overview of the SDT published earlier in
                                         the US Proceedings of the National Academy (PNAS) (Lesthaeghe, 2014).
                                         In the first section, three optimistic views concerning the evolution of fertility are
                                         considered: (i) rises due to the end of postponement, (ii) rises connected with
                                         advancing human development and (iii) rises associated with advancing gender
                                         equality. The focus in this section is mainly but not exclusively on the European
                                         experience and its large degree of variation in fertility patterns. It is argued that these
                                         three optimistic predictions of sustained fertility rises are mainly based on
                                         observations prior to 2010, with too much weight being given to four Nordic
                                         countries and too little to other Western European countries with very similar fertility
                                         levels. However, these expectations have been thwarted during the second decade,
                                         even in the presence of advances in human development and/or gender equality.
                                         Hence, the original SDT prediction of 1986 of sustained sub-replacement fertility still
                                         holds after 35 years. We expect this to continue during the third decade as well.
                                         Furthermore, single-factor explanations are not likely to do justice to far more
                                         intricate situations that are responsive to varying structural and ideational influences.
                                         In the second section, the evolution of cohabitation is traced in Europe, the USA and
                                         Canada, the Latin American countries, three East Asian populations and selected sub-
                                         Saharan cases. At the onset, cohabitation can start either from a SDT basis among
                                         the better educated or among the poorer classes following a pattern of
                                         disadvantage (POD). It is argued that the feature of cohabitation spreads rapidly
                                         among all social classes and across all education groups and that in the process of
                                         increasing cohabitation, the POD versus SDT argument loses its significance. On a
                                         global scale, the rise in cohabitation is contingent on two dimensions: (i) contrasting
                                         historical patterns of kinship organisation, including the position of women, and (ii)
                                         further advances of the “ethics revolution”, indicating the growing dominance of
                                         individual autonomy over traditional societal norms. As a result, no breakthroughs in
                                         the near future are expected in countries with a Muslim or Hindu tradition in which
                                         no such major cultural shifts have occurred so far.
                                         Keywords: Sub-replacement fertility, Cohabitation, Second demographic transition

                                      © The Author(s). 2020 Open Access This article is licensed under a Creative Commons Attribution 4.0 International License, which
                                      permits use, sharing, adaptation, distribution and reproduction in any medium or format, as long as you give appropriate credit to the
                                      original author(s) and the source, provide a link to the Creative Commons licence, and indicate if changes were made. The images or
                                      other third party material in this article are included in the article's Creative Commons licence, unless indicated otherwise in a credit
                                      line to the material. If material is not included in the article's Creative Commons licence and your intended use is not permitted by
                                      statutory regulation or exceeds the permitted use, you will need to obtain permission directly from the copyright holder. To view a
                                      copy of this licence, visit http://creativecommons.org/licenses/by/4.0/.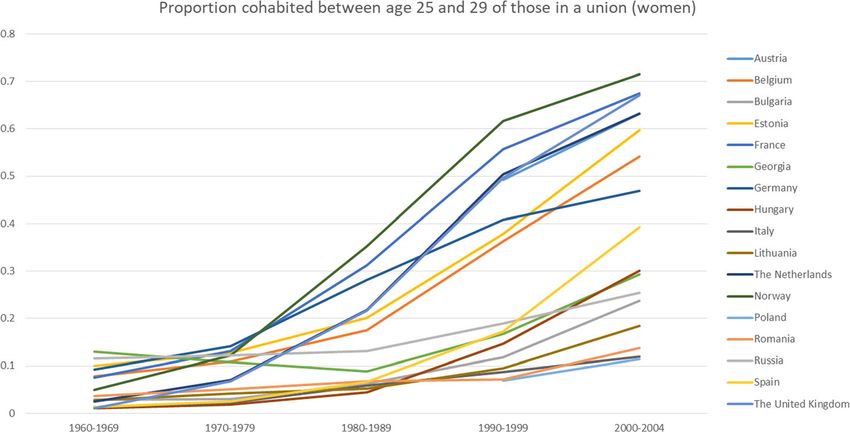
Lesthaeghe Genus        (2020) 76:10                                                                                                Page 2 of 38

                   Introduction
                   The initial building blocks for the theory of the second demographic transition (SDT)
                   were laid in 1986 in a Dutch language article by myself and Dick van de Kaa
                   (Lesthaeghe & van de Kaa, 1986). Its title was “A second demographic transition?” We
                   were convinced that below replacement fertility was going to be a lasting feature, and
                   that pre-marital cohabitation was going to expand in Europe. We had both lived
                   through the cultural changes of the 1960s that questioned all forms of authority. And
                   we based our argument on the fact that an era of much more individual discretion and
                   autonomy was in the making, spurred on by a newly expanding educated “post-materi-
                   alist” elite (Inglehart, 1977). We were not the only ones who thought along similar
                   lines: in France Philippe Ariès (1980) and Louis Roussel (1983) were equally convinced
                   that a page had been turned.
                      Major changes took place in global demography since 1986, and hence an assessment
                   of the last 35 years may be in order. The present article is essentially a sequel to an
                   earlier concise overview of the development of the theory of the “Second Demographic
                   Transition” (SDT) in the Proceedings of the United States National Academy of Sci-
                   ences (PNAS) (Lesthaeghe, 2014).1 In that PNAS article, we presented a history of the
                   concept along with a description of the basic ingredients both in terms of fertility and
                   household formation trends, and in terms of the conditioning ideational factors operat-
                   ing at the individual level. In addition, we contrasted the SDT to the first demographic
                   transition (FDT) in the West, again in terms of opposite demographic trends2 and in
                   terms of shifts in the conditioning societal correlates at the macro level. At the time of
                   publication in 2014 of the PNAS article, it was already clear that the SDT was not
                   merely a Western European idiosyncrasy as contended during the 1990s, but covered
                   the entire Western world.3 Furthermore, the incidence of cohabitation was rapidly in-
                   creasing in Latin America (Esteve, Lesthaeghe, & Lopez-Gay, 2012), and this SDT fea-
                   ture also emerged in industrial nations of the Far East (i.e. Japan, Taiwan) where it was
                   least expected (Tsuya, 2006; Raymo, Iwasawa and Bumpass, 2009). In 2014, we still
                   lacked a clear view of what was happening in the People’s Republic (PR) of China, but
                   very soon thereafter evidence was presented of rising pre-marital cohabitation in that
                   vast population as well (Yu & Xie, 2015).
                      In the present article, we will address three alternative views which proposed a rise in
                   fertility in the SDT countries during the period 1998–2014. In addition, we will also
                   shed light on the discussion pitting the so called “pattern of disadvantage” (POD)
                   against the SDT as two opposing prime causes of the increase in pre-marital cohabit-
                   ation (e.g. Perelli-Harris & Gerber, 2011). We will show that the overall rise over time
                   is often much larger than education or wealth related differences. Apparently, the fea-
                   ture of pre-marital cohabitation can spread like wildfire to all social classes of society.

                   1
                     See also the earlier review of global trends in Lesthaeghe (2010).
                   2
                     The opposite trends were nuptiality and fertility postponements in the SDT versus earlier marriage and
                   curtailment of fertility at older ages in the FDT. The other contrasts related to the rise of non-conventional
                   forms of household formation in the SDT (single living, rising divorce rates, pre-marital and post-marital co-
                   habitation, procreation within cohabitation, rise reconstituted families and same-sex households).
                   3
                     During the 1990s, scepticism was still dominant in Southern and Eastern Europe and in the English-
                   speaking world as well. The view that the SDT was not a transition and only a Western European idiosyn-
                   crasy was still defended as late as 2004 by D. Coleman (2004).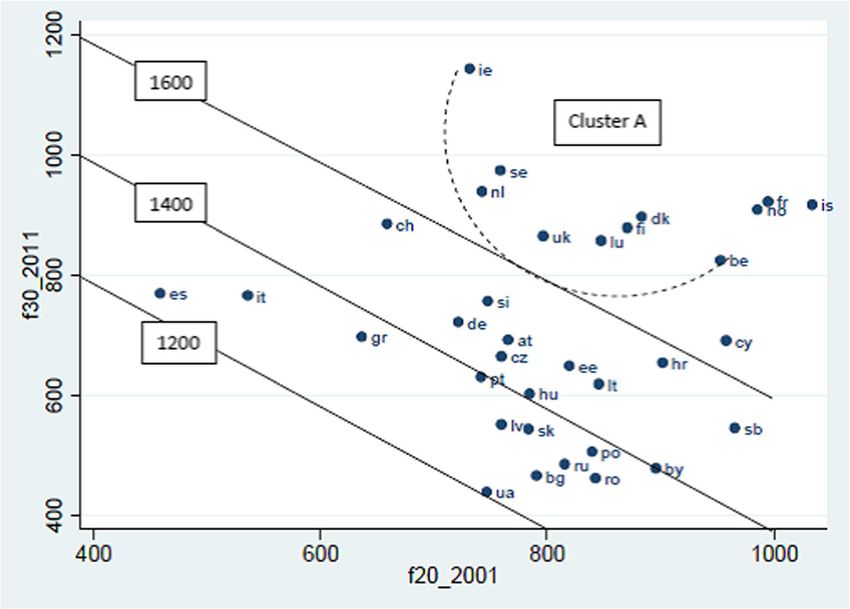
Lesthaeghe Genus        (2020) 76:10                                                                                                Page 3 of 38

                    We will furthermore try to formulate perspectives for the future courses of fertility
                   under SDT conditions in Europe and of cohabitation worldwide.

                   The disconnection between sub-replacement fertility and the rise of
                   cohabitation at a global level
                   In countries with a historical dominance of the nuclear and conjugal family, i.e. Europe
                   and the “new Europes”,4 the SDT features of both fertility postponement and increasing
                   pre-marital cohabitation were fairly synchronised. In fact, at the onset fertility outside
                   wedlock remained low, and consequently the rise of pre-marital cohabitation and/or
                   prolonged residence in the parental household resulted in a postponement of parent-
                   hood. During the subsequent phase, when parenthood among cohabitants started ris-
                   ing, no reversal in the mean age of maternity took place, and sub-replacement fertility
                   became a systemic feature of the SDT. In Europe, a dual reproductive system emerged
                   with the German-speaking countries and the Southern European ones having lower fer-
                   tility than the Nordic and other Western populations. They were joined during the
                   1990s by the formerly communist countries (FCCs) as a result of the political regime
                   change and its concomitant economic shock: fertility plummeted to the “lowest-low
                   levels”.5 Subsequently, also the hitherto low mean age at motherhood started rising in a
                   continuous way in the FCCs in tandem with the upward trend in pre-marital cohabit-
                   ation and parenthood among cohabitants.
                      In other world regions with very different family and kinship systems, there was no
                   such synchronism between the rise of cohabitation and fertility postponement. In a
                   number of urban and industrialised Asian patriarchal societies,6 the feature of fertility
                   postponement surfaced already since the 1970s and gained momentum, cohort after
                   cohort, to the point of pushing the period total fertility rates (PTFRs) to the “lowest-
                   low” level.7 In the PR China, the “One Child” policy had a similar effect of pushing fer-
                   tility down to the sub-replacement level. But in none of these countries were there any
                   signs yet of the possibility of rising pre-marital cohabitation. This would be a complete
                   violation of the century-old system of controlled endogamous marriage. That would,
                   however, change at the onset of the twenty-first century in Japan, Taiwan, PR China
                   and the Philippines. Evidently, the marriage and fertility postponement transition pre-
                   ceded the timid trend toward pre-marital cohabitation by roughly two to three decades
                   in these populations.

                   4
                     By the term “new Europes” we refer to the US, Canada, Australia, New Zealand, Argentina and Uruguay
                   who all have majority populations of European descent.
                   5
                     The term “lowest-low fertility” was coined by Kohler, Billari, & Ortega, 2002 to refer to Period Total
                   Fertility Rates (PTFR) below 1.3.
                   6
                     By “patriarchal” we refer to those populations in which there is a strong male dominance and a subordinate
                   position of women connected to class, caste and lineage endogamy, the permanent severance of ties of
                   women to their own kin, obedience to their grooms’ family, the payment of a dowry accompanying a
                   marriage (i.e. a transfer of goods to their new uxorilocal household) and often also a high degree of domestic
                   encapsulation. Courtship and marriages are controlled or arranged, and, under such conditions pre-marital
                   cohabitation is as good as non-existent. In this way a possible mésalliance resulting from individual freedom
                   of choice is averted.
                   7
                     In the period 1980–1985, Japan, Hong Kong and Singapore had PTFRs below replacement; in the period
                   2000–2005, “lowest-low” fertility was recorded for Japan (1.30), South Korea (1.21), Singapore (1.35), and
                   Hong Kong (0.95), but sub-replacement fertility was also prevailing in Taiwan (1.57) and PR China (1.61). In
                   2010–2015 all had “lowest-low” levels, except PR China (1.64). Compared to 2000–2005 there were no major
                   changes except in Hong Kong where the PTFR rose to 1.20.
Lesthaeghe Genus (2020) 76:10 Page 4 of 38
It should also be stressed that there are many instances of patriarchal societies in Asia
and North Africa which are characterised by a major postponement of marriage and
parenthood, without any “corruption” of the patriarchal system through pre-marital co-
habitation or fertility outside wedlock (Jones, 2005; Raymo, Park, Xie, & Yeung, 2015).
Several of them now have PTFRs at the brink of the sub-replacement level (e.g. Turkey,
Tunisia, Bangladesh) or are already passing that threshold (Iran). The fertility postpone-
ment in these cases may be connected to the SDT when it is driven by the quest for fe-
male advanced education and emancipation in certain urban parts of the population.
But for the larger and poorer segments, postponement of marriage and of parenthood
merely constitutes a response to economic stress and is as such not a SDT feature. Fi-
nally, there are also instances characterised by sub-replacement fertility as the result of
early marriage and early motherhood, but with a rapid curtailment of further fertility at
low parities via contraception or widespread sterilisation (e.g. Kerala in Southern India).
These are still typically FDT cases in the latest phase of their fertility transition. In other
words, sub-replacement fertility is not of necessity a SDT feature but can be reached
during the final phase of the FDT as well.
Exactly the opposite story applies to the mixed cultures populations of Latin America
and the Caribbean. In these instances, there was an extant tradition of pre-marital co-
habitation and also a pattern of life-long cohabitation without any transition to mar-
riage. But the picture in these culturally and ethnically mixed populations was quite
heterogeneous to start with, with customarily high levels of cohabitation prevailing
among formerly black slave populations (e.g. matrifocal visiting unions) and indigenous
populations with a hunter-gatherer background. The same also held among the urban
poor. Lower levels prevailed among ethnic populations stemming from pre-Columbian
advanced societies which had more complex patterns of social stratification with pos-
sibly endogamous marriage among the elite castes (e.g. royalty, nobility, priests, mili-
tary, craftsmen). Historically the lowest levels of cohabitation existed among the
European and educated upper strata, who mostly adhered to the Catholic principles of
marriage and prohibition of divorce.8 By 2010–2015, most countries were already quite
advanced with respect to the fertility transition (FDT) and several were close to or
below the 2 children level.9 However, this fertility transition was not the result of post-
ponement. Instead, an early starting pattern of fertility prevailed in tandem with early
partnership formation, typical for the last phase of the FDT. More specifically, fertility
declined primarily via a reduction at higher ages and parities beyond two. This was
achieved through a fairly rapid adoption of contraception and female sterilisation. To
sum up, populations of this region witnessed a “cohabitation boom” since the 1980s,
but without the other SDT component of fertility postponement (Castro-Martin, 2002;
Fussell & Palloni, 2004; Esteve et al., 2012; Esteve, Lopez-Ruiz, & Spijker, 2013; Esteve
& Florez, 2014).
The conclusion at this point is that the various aspects of the SDT can develop quite
independently from each other in different historical and social settings. In the context
of patriarchal family organisation, pre-marital cohabitation is still absent or only on the
8
Of course, this did not preclude concubinage among white elites (e.g. Borges, 1985).
9
TFR values in 2010-2015 were below the replacement level in Trinidad & Tobago (1.98), Jamaica (1.91),
Colombia (1.82), Brazil (1.74), Costa Rica (1.76), Chile (1.65), Cuba (1.62) and Puerto Rico (1.22). Note that
we count Argentina and Uruguay as part of the “new Europes”.Lesthaeghe Genus (2020) 76:10 Page 5 of 38
increase in Asian advanced industrial societies. In the latter instance, fertility postpone-
ment had already started two or three decades earlier. In the areas with the European
nuclear family system, both cohabitation and fertility postponement evolved simultan-
eously. By contrast, in the mixed race populations of the Americas, the practice of co-
habitation expanded without concomitant parenthood postponement.
Fertility recuperation in the new century: thwarted optimism
In 1986, the SDT theory predicted the persistence of structural below replacement fer-
tility in the West on the basis of several arguments. The rise of cohabitation, the further
advances in female education levels, and the concomitant advancing of female emanci-
pation and economic autonomy were structural features causing fertility postpone-
ment.10,11 But, ideational factors, such as pronounced consumerism, advanced
secularisation, the quest for self-actualisation, emancipation12 and ethical autonomy,
the keeping of an “open future”, and “post-materialist” or politically leftist convictions,
were also considered as props of a new demographic regime. What the SDT could not
yet foresee at this early date, however, was that fertility could also remain at levels
below a PTFR of 1.5 children only.13
Contrary to the SDT view of long-term sustained low fertility, a number of optimist
views were advanced during the period 1998-2014. They opened the perspective of a
fertility increase, including a possible end to PTFR levels below 1.5. The first optimist
view resulted from the technical “postponement adjustments”, the second was based on
the supposed link to human development and the third one foresaw a fertility increase
in function of advancing gender equality. These three views will now be discussed.
Postponement adjustments and higher fertility
During the 1990s much attention was given to the postponement aspect of the fertility
decline. The Bongaarts and Feeney (1998) tempo adjustments of period parity-specific
total fertility rates dominated the scene in a pervasive way. Their method re-inflated
the prevailing parity-specific period fertility levels by the complement of their average
postponement rates as observed over several earlier years. In other words, the observed
quantum of period fertility was held constant but was adjusted for recent tempo shifts
to later ages. The meaning of this hypothetical measure is then clear: what would the
PTFR at a given point in time be if no recent postponement had taken place. As such,
their method nicely illustrates the effect of past postponement. However, a misinter-
pretation accompanied the notion of the adjusted PTFR: to what level would the PTFR
increase if the postponement were to come to a halt. The adjusted PTFR now had a
prospective interpretation, but relied on the silent hypothesis of no further quantum de-
clines. Many assumed that the postponement would not continue for ever, and once
the end being reached, fertility would universally bounce back in countries that had
10
The SDT is not at odds with the neoclassical economic focus on rising opportunity costs for women
leading to lower fertility.
11
See also Billari, Liefbroer, and Philipov (2006) for the driving forces of postponement.
12
Here, we mean both emancipation of women leading to more gender equality and emancipation of ethnic
and sexual minorities.
13
In 1986, nobody could foresee the collapse of communism 3 years later nor the subsequent dip of fertility
in the FCCs to the “lowest-low level”. This post 1990 feature would constitute a major component of the
subsequent and lasting fertility duality in Europe.Lesthaeghe Genus (2020) 76:10 Page 6 of 38
completed a postponement transition. The focus on the sole feature of tempo shift and
the optimist interpretation of the adjustments distracted attention from the other cru-
cial aspect: further quantum declines as a result of weak fertility recuperation at later
ages, i.e. essentially between 30 and 40.
Realism commands that, under SDT conditions, fertility postponement and recuper-
ation need to be considered together. We drew attention to this holistic approach in
1999 (Lesthaeghe and Willems, 1999) and subsequently developed a cohort fertility-
based model of parametrised postponement and recuperation, leaving open the incom-
plete recuperation patterns of older cohorts after age 30 (Lesthaeghe, 2001).14 In this
approach, attention is drawn to the prospective degree of quantum recuperation of fer-
tility that will be required to compensate for the degree of postponement as observed
up to age 30 in successive cohorts. The benchmark cohort in this relational model can
be taken as the last one with a completed cohort total fertility rate (CTFR) of close to
two children. In that way, one can also visually appreciate how much recuperation after
age 30 is required to bounce back to cohort replacement level fertility. In practice, it
became quickly obvious at the onset of this century that the replacement level could
not be realistically reached in the overwhelming majority of European populations. In-
stead, it became abundantly clear that sub-replacement fertility, and even the extra low
versions of it, could last for a very long time. The relational cohort model of observed
postponement and partially incomplete recuperation did not lead to any optimistic ex-
pectations. Some 20 years later, this is still the case.
Increasing fertility with advancing human development?
A causal link between higher fertility and advancing human development was advo-
cated by Myrskylä, Kohler, and Billari (2009) for the industrialised countries in a very
widely circulated article in the journal Nature. Its title was short and provocative: “Ad-
vances in development reverse fertility decline”. In this article, the authors claimed that
improvements in the level of human development, as measured through the UN Hu-
man Development Index (HDI), in the lower fertility countries would produce a boun-
cing back to levels more commonly observed among countries with the higher HDI
values. This is shown in Fig. 1 in which we marked the “ski jump” feature with a red
circle. Especially, the Scandinavian countries with high HDI values and fertility closer
to replacement during the first decade of the twenty-first century constituted the refer-
ence points.
The problem with that view is that it was based on measurements in a cross-section.
The Myrskylä et al. article is in fact a notorious case of what Arland Thornton (2005)
called “reading history sideways”. This concept refers to the fact that there is a frequent
fallacy in the social sciences whereby a future evolution is proposed based on a single
and static cross-sectional pattern, i.e. a statistical observation that itself contains no
analysis of an evolution over time.
Closer inspection of the PTFR-HDI link for 460 regions in Europe shows that there is
also a problem of “split correlation” (Lesthaeghe & Permanyer, 2014). Split correlation
emerges when two distinct clusters are present. There is essentially no correlation
14
This would be further elaborated and refined in Sobotka, Zeman, Lesthaeghe, and Frejka (2011). For early
cohort analyses see also Frejka and Calot (2001), Frejka and Sardon (2004) and Frejka (2011).Lesthaeghe Genus (2020) 76:10 Page 7 of 38
Fig. 1 The relationship between the total fertility rate (TFR) and the UN human development index (HDI) in
2005 and 2008, and the “ski-jump” (red circle). Source: Myrskylä et al. (2009)
within each cluster, but the overall regression slope is significantly different from zero
simply because it runs through the lower and upper clusters combined. Split correl-
ation is indicative of the fact that the X variable is not a causal antecedent of Y and that
the explanation has to be sought elsewhere, i.e. in the variables Zi that cause the exist-
ence of the distinct clusters in the first place. In our problem more specifically, there
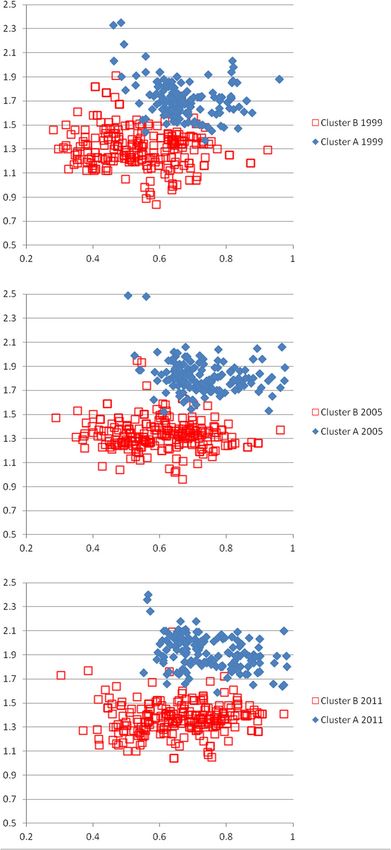
are two clusters of points in 1999 on the PTFR-HDI scattergram (see Fig. 2). The top
cluster A in blue contains all the Nordic regions, and those of the Low Countries,15
France, the UK and Ireland. The elongated lower fertility cluster B in red is composed
of the mainly German-speaking countries, the Southern European regions and those of
the former communist countries (FCCs), including the Baltic states and the Russian
Federation. In what follows in the rest of this article, we will continue using this A- and
B-cluster reference.
In 1999, the two clusters are already clearly visible, with just some 5 B-cluster regions
having PTFRs of 1.7 or higher. In 2005, the two clusters become even more distinct
with only 3 B-cluster regions with PTFR levels above 1.7. More importantly, both clus-
ters move to the right, indicating improvements in the HDI. By 2011, the B-cluster
scores noticeably higher on the HDI, but remains totally distinct from the regions of
cluster A. In other words, despite markedly improving HDI values in cluster B, there is
no convergence whatsoever to fertility levels of cluster A.
15
The term Low Countries commonly refers to Belgium plus the Netherlands, and not to the latter alone.Lesthaeghe Genus (2020) 76:10 Page 8 of 38
Fig. 2 Scattergram of the Period Total Fertility Rates (Y-axis) and the Human Development Index (X-axis) in
460 European regions (NUTS2), years 1999, 2005, and 2011. Source: Lesthaeghe and Permanyer (2014)
The Myrskylä et al. thesis met with more scepticism. For instance Harttgen and Voll-
mer (2012) indicate that the presumed rise in PTFRs at the national levels is not robust
to later revisions of the HDI and not to any HDI component either, whereas Furouka
(2009) questions the mere existence of a new positive HDI-PTFR relationship. How-
ever, Myrskylä, Kohler, and Billari (2011) retested their hypothesis using the World
Economic Forum’s Global Gender Gap Index (GGG) (Hausmann, Tyson, & Zahidi,
2010) and pointed out that it could be that the “gender equity” factor would be respon-
sible for the apparent cross-sectional positive correlation with national PTFR values.
This is to some degree corroborated by Luci and Thévenon (2010), who, on the basisLesthaeghe Genus (2020) 76:10 Page 9 of 38
of OECD data, point out that female employment could be the main driver but equally
stress that the reversal is not strong enough to restore replacement level fertility.
We can also inspect the presence of the split correlation fallacy for other dimensions
than the UNDP HDI indicator, and more specifically for gender equity measurements
(Lesthaeghe & Permanyer, 2014). This can only be done for entire countries for lack of
more detailed regional indicators. We use 8 indicators, i.e. three measurements of the
UN HDI, two indicators of gender equity GII and GEI*, two measurements of female
employment rates FER and one composite measure of the country positions on the
SDT dimension.16 In Table 1 we report the correlation coefficient between the PTFRs
and the eight indicators, first for both clusters of countries together, and then for each
cluster separately. As before, cluster A contains the Nordic and the five Western
European countries, whereas cluster B contains the three German-speaking countries,
the Southern European ones and all the FCCs.
The outcomes in Table 1 are quite telling: The overall correlations are typically posi-
tive for the overall sample of countries and exceed + .50.17 The split correlation with
the HDI as shown in Fig. 2 again appears very clearly when entire countries are con-
cerned. The UNDP gender inequality indicator GII and the female employment rates
FER do more poorly, even for both clusters combined. Typical for the feature of split
correlation is that these relationships vanish when measured within clusters. There are
only two exceptions in cluster A and none in cluster B. Apparently only among the
Scandinavian populations, the Low Countries, France, Ireland and the UK is there a
positive line up of the PTFR with the corrected Permanyer gender equality index GEI*
and with the Sobotka SDT dimension. The negative correlation with the SDT indicator
in cluster A refers to the period 2000–2001 when France and Ireland had higher fertil-
ity than the 4 Nordic countries. The overall positive correlation between the PTFR and
the Sobotka SDT index is explained by the fact that the cluster A countries had higher
values on both variables than most countries in the B cluster.
The overall outcome is clear: split correlation emerges when plotting PTFRs on na-
tional and regional HDIs. For the SDT and GEI* predictors, there is only a relationship
in cluster A but not in cluster B. The possible links between the PTFR and the FERs or
UNDP-GII are unconvincing on all accounts. These findings for the first decade of the
twenty-first century point to the possible relevance of gender equality for further ex-
ploration. But can this sole factor account for rising fertility?
Will more gender equality produce a fertility increase?
One of the remarkable observations since the formulation of the SDT in 1986 is that
the relationship between fertility and female employment rates reversed: initially, the
relationship was negative, and now it is positive among European countries. However,
the fertility postponement did not start in the industrialised countries at the same time.
16
We use the same HDI as Myrskylä et al., the GII is the gender inequality index of the UNDP in 2013 and
the GEI* is the improved version thereof proposed by Permanyer (2013) and labelled as the Gender Equality
Index for 2013. The FER values are those used by the OECD. The SDT measure is the composite indicator
proposed by Sobotka (2008) and based on demographic SDT indicators (SDT1 = mean age first births and
first marriage, proportion of non-marital births, total female marriage and divorce rates) and on 8 value ori-
entations taken from the European Values Studies pertaining to family values, non-conformist values and
secularisation (SDT2).
17
The GII or the UNDP gender index has of course the reverse sign given that it measures inequality, not
equality as the Permanyer GEI* corrected index does.Lesthaeghe Genus (2020) 76:10 Page 10 of 38
Table 1 Correlation between the national PTFRs and selected social indicators of human
development (HDI), gender relations (GII, GEI*), female labour force participation (FER) and second
demographic transition pattern (SDT): European countries
Overall Cluster A Cluster B
R Rsq R Rsq R Rsq
TFR-HDI 2000 + .54 .29 − .05 .00 + .13 .02
TFR-HDI 2008 + .59 .36 + .05 .00 + .14 .02
TFR-HDI 2012 + .54 .29 − .09 .01 − .03 .00
TFR-GII 2012 − .33 .11 + .38 .15 + .11 .01
TFR-GEI*2013 + .58 .33 − .56 .28 − .05 .00
TFR-FER 2000 + .27 .07 + .06 .00 − .08 .01
TFR-FER 2009 + .40 .16 − .28 .08 + .25 .06
TFR-SDT 2001 + .52 .27 − .68 .46 + .15 .02
Bold italics indicate R values ≥ + .50 and Rsq ≥ .25
Source: Lesthaeghe and Permanyer (2014)
Those with higher female labour force participation and high SDT scores lead the post-
ponement movement. This is shown in Fig. 3 by T. Sobotka who plotted the onset of
the postponement against a set of values incorporated in his SDT dimension (SDT2).18
The postponement timing indicator is the year in which the mean age at first birth had
increased by 2 years compared to the postwar minimum (trend reversal).
The Nordic postponement leaders were the first with PTFR values to drop below re-
placement level, immediately followed by the rest of North-Western Europe. All this
happened in the period 1968–1973. The Nordic countries reached their lowest PTFR
level in the mid-1980s (Sobotka, 2008). In Southern Europe, fertility postponement
came later, and PTFRs dropped below replacement level only in the late 1970s. Leaving
the FCCs aside, the resulting 1980 PTFR ranking is as follows: the German-speaking
trio being lowest, then Scandinavia, then the rest of Western Europe, with the PTFRs
still being highest in Southern Europe (Sobotka, 2008, p. 33) given the later onset of
the postponement. The strong negative correlation between period fertility and female
labour force participation, as observed in the period 1970–1990, is a direct result of the
timing differences in the onset of postponement. Early postponers had the highest female
labour force participation and the higher SDT scores, as theoretically expected. Coun-
tries with low female labour force participation were later postponers and had the
higher fertility, hence the negative relationship between the PTFRs and female labour
force participation. But this masked the underlying positive relationship between both
higher female labour force participation and cultural dimensions of the SDT at one
hand and the earlier onset of fertility postponement at the other.
During the decades that follow, Scandinavian and Western European PTFRs stay level
between 1.7 and 2.0,19 whereas all the others, late postponement FCCs included, had
dipped or were dipping below the 1.5 level. This caused the reversal of the relationship
between period fertility and female labour force participation. Clearly, not only fertility
18
The Sobotka SDT2 index is based on the 1999/2000 European Values Study for 29 countries. The items
are: greater importance of leisure, low frequency church/mosque/synagogue visit, high degree of control over
life, child not needed for women’s life fulfilment, marriage being outdated institution, women not wanting to
stay home, respect for parents not essential, and approve of abortion (see Sobotka 2008, appendix).
19
Scandinavian PTFRs increase temporarily during the 1987–1992 years, but this was essentially related to
the fertility peak in Sweden caused by the so called “speed premium”. See Hoem and Hoem (1997).Lesthaeghe Genus (2020) 76:10 Page 11 of 38
Fig. 3 Relationship between the onset of fertility postponement and a composite measure of SDT values
orientations (SDT2 Sobotka indicator). Source: Courtesy of Tomas Sobotka
postponement but also very differential recuperation at older ages played a role and ag-
gravated the split between the A and B clusters. This is depicted in Fig. 4 for the
European countries. In this figure we plotted the fertility level in the age group 30–39
in 2011, illustrative of recuperation, against the level 10 years earlier in the age group
20–29, illustrative of postponement. The oblique iso-lines give the total fertility per
1000 women from ages 20 to 39, and this approximates the cohort experience. Except
for the very strong postponement in Italy and Spain, and to a lesser degree also in
Greece and Switzerland, cluster A and cluster B countries had similar distributions of
fertility levels in the 20–29 age group in 2001. But cluster A countries all have much
higher recuperation levels in the age group 30–39 10 years later.
Why did this duality between the A and B clusters develop? Was it because the A
cluster of countries solely scored better on gender equality, or were there other factors
at work, for instance dealing with policies reducing female opportunity cost of labour
force participation, subsidising child-rearing expenditures or diminishing the work-
family time stress via early and universal child care and schooling?20 That stress can
also be alleviated through more generalised part-time labour force participation, as in
the Netherlands, the UK and Australia (McDonald, 2013). Or where macro-economic
forces at work such as uncertainty caused by a globalising economy21 and by weaker
employment positions of young adults? Or were economic crises responsible for falls in
period fertility levels at the younger ages? In what will follow, we will argue that the
20
Switzerland, Germany (West) and Austria are among the wealthiest countries in Europe, and yet they join
the B-cluster with extra low fertility. This contrasts with France and Belgium who stay in cluster A. The lat-
ter two countries had more generous child allowances, but particularly widely available pre-school child care
from infancy onward (crèches, kindergarten) with long opening hours. A telling case is provided by the con-
trast between the German-speaking part of Belgium with higher fertility and ample child care provisions and
the adjacent region in Germany having the opposite characteristics (Klüsener, Neels, & Kreyenfeld, 2013).
21
On the topic of globalisation as a complementary explanation, see Mills and Blossfeld (2012).Lesthaeghe Genus (2020) 76:10 Page 12 of 38
Fig. 4 Plot of cumulated fertility in the age group 30–40 (f30) (recuperation phase) in 2011 against
cumulated fertility in the age group 20–29 (f20) (postponement phase) 10 years earlier, European countries.
Source: Lesthaeghe and Permanyer (2014)
gender revolution could be a necessary, but by no means a sufficient ingredient for main-
taining a stable PTFR level above 1.7. In fact, men doing more housework is only one, al-
beit a major component of a broader package of factors diminishing the work-family
stress.
According to several of our colleagues familiar with the Nordic scene, it is definitely
the degree of gender equality that is the key to the fertility duality enigma (Esping-An-
derson & Billari, 2015, Goldscheider, Bernhardt, and Lappegard, 2015). Firstly, they see
phases in the development of gender equality, with initial rising of female labour force
participation constituting a first phase (women entering the “public space”), and with
equal sharing of domestic chores developing during the second phase (men entering
the “private space”). Moreover, only this second phase, which is “the real gender revolu-
tion”, would be associated with rising fertility. The crucial variable for these authors is
then the advancing from an incomplete to a complete gender revolution. Secondly, they
argue that this second phase of the gender revolution would strengthen the family, and
that therefore other reversals are taking place, such as diminishing divorce.22 The SDT
as originally described would be a good characterisation of the earlier phase, but its
prediction of sustained below replacement fertility would be falsified when the second
phase of the gender revolution comes into play. This was forcefully predicted by G.
Esping-Anderson in his address to the European Population Conference in Stockholm,
2012. At that conference, the author contended that a U-shaped curve was in the mak-
ing, with the right upward arm representing rising fertility directly as a result of
22
In countries in which the majority of couples are cohabiting instead of being legally married, the divorce
rate is highly affected by selectivity of marriage, and hence a poor indicator of overall couple instability.Lesthaeghe Genus (2020) 76:10 Page 13 of 38
advancing gender equality.23 But the prediction was open ended as there was no speci-
fication of the size of the fertility increase, nor of the timing of the gender revolution
reaching “maturity”.
Obviously, the Scandinavian countries are in the lead with respect to the transition
from the first to the second stage of the gender revolution. More specifically, the ratios
of female over male hours of domestic work for European Union member states around
2010 were already below 2 in Sweden (1.42), Denmark (1.74) and Finland (1.85), but
above that level in the UK (2.04), Netherlands (2.11), Belgium (2.52) and Metropolitan
France (3.25)24 (EIGE, 2013). However, as shown in Table 2, there is no such appre-
ciable difference in PTFRs between the two groups of cluster A: in the period 2000–
2009, France and Norway are in the lead with PTFRs above 1.90, followed by Sweden,
the UK, Denmark, Finland and Belgium with values between 1.80 and 1.89. In other
words, fertility differences in cluster A countries cannot be accounted for by differences
in male involvement in domestic work. Also, there is a PTFR rise during the first dec-
ade of the new century.25 But, as shown in Table 2, that rise is evident in all countries
of cluster A, i.e. as much in the four western countries with the lower levels of male do-
mestic work sharing (France, UK, Belgium, Netherlands) as in the Nordic countries with
the higher levels.
Also, the presumed U-shaped pattern is based on cross-sections, and not on an evo-
lution over time. When the latter is considered, Martin Kolk (2019) no longer finds
support for the Esping-Anderson & Billari, 2015.
During the second decade of this century, however, there is a substantial fall in the
fertility levels affecting all cluster A countries. Initially this was attributed to the 2009
economic recession, but the decline manifested itself all the way through the decade.
Finish fertility dropped below 1.6, Norway and the Netherlands fell back to the 1.60–
1.69 category. The UK, Denmark and Belgium managed to remain above 1.70, and
solely Sweden and France stayed above 1.80. Evidently, the optimistic view based on
any advancing gender revolution got thwarted during the last decade: the Nordic coun-
tries were not more robust than others despite their more advanced position on the gen-
der revolution scale.
These findings cast doubt on the Goldscheider et al. hypothesis. This is also echoed
by Hellstrand et al. (2020) who analysed the Nordic second decade fertility reversal in
greater detail, and found that fertility declined at all ages below 35. Fertility declines
above age 30 had hitherto never occurred in the Nordic countries. Evidently, they are
currently systematically diverging from the long-term pattern of stable and higher fer-
tility. The authors find no signs of declining gender equality or of weakening family
policies. In fact, in most Nordic countries, fathers tend to take full advantage of paren-
tal leave and most children are enrolled in day care from an early age. They further-
more show that decreasing first births are the main driver of the decline in period
23
See also Esping-Anderson and Billari (2015) where the U-shaped curve is the key to their further
argumentation.
24
The harmonised time-budget data HORUS show a similar pattern and contrast between the Nordic and
Western European countries, but France is no longer such an outlier with women doing more than three
times more domestic work than men as reported in the EIGE data set. See Lesthaeghe and Permanyer (2014)
for further details for the rest of Europe.
25
Virtually, all commentators using data for the 2000–2010 decade formulate conclusions pointing to the
high relevance of gender equality simply because the four Nordic countries determine the slope of
regressions.Lesthaeghe Genus (2020) 76:10 Page 14 of 38
Table 2 Period total fertility rates, European cluster A countries, 2000–2019
2000–2004 2005–2009 2010–2014 2015–2019
Sweden 1.67 1.89 1.9 1.85
Norway 1.81 1.92 1.82 1.68
Denmark 1.76 1.85 1.73 1.76
Finland 1.75 1.84 1.77 1.53
France 1.88 1.98 1.98 1.85
UK 1.65 1.86 1.87 1.75
Belgium 1.68 1.87 1.78 1.71
Netherlands 1.74 1.75 1.71 1.66
Source: United Nations Dept. of Economic & Social Affairs, UN Population Division, World Population Prospects, the 2019
revision, UN data sheet
fertility, and therefore speculate that voluntary childlessness could be on the increase.
Very much the same observations were made for Finland where the PTFR dropped to
an all-time low of 1.49 in 2017 (Hellstrand, Nissen, & Myrskylä, 2019). Also in that
country, a quantum decline is responsible and not further postponement. These obser-
vations are a far cry from the optimist theory based on the Esping-Anderson U-curve
with fertility increases being driven by advancing gender equality.
To sum up, the “gender revolution” theory is based on a single explanatory factor.
This contrasts with a multitude of additional factors, both structural and ideational,
that in conjunction cause sub-replacement fertility. In other words, gender equality is a
major element in the explanation,26 but by no means a sufficient one. Furthermore,
judging from the trends after 2009, also the gender revolution theory overplayed its
hand in predicting a fertility increase.
The end of fertility returning to replacement level?
The SDT theory essentially predicted a structural, long-term pattern of below re-
placement fertility, even for cohorts and not just for periods. It is not an optimist
theory as it recognised the existence of major forces, both of a social structural as
well as ideational nature, which would keep fertility levels down in industrialised
societies. The predicted outcome manifested itself on a global scale, as advanced
Asian societies and “new Europes” joined the club with sub-replacement fertility.
Obviously, the 1986 version of the theory could not predict the dual fertility pat-
tern in Europe and its persistence since the 1990s, nor the very low fertility in
Japan, South Korea, Hong Kong, and China.27 Apart from that, it is reasonable to
conclude that the prediction of generalised sub-replacement fertility still stands after
35 years, and that this period may be heading for the half century, even in the
countries with “mature” gender equality.
26
It should be noted that rising female education and female emancipation were already considered as crucial
ingredients of the SDT theory well before the “gender revolution” theory was formulated. But these
developments were not taken as the sole determining factors. See for instance Lesthaeghe (1991) for
empirical analyses that include effects of Protestantism, the rise in unemployment, closure of the female
employment gap, out of wedlock fertility as an indicator of rising cohabitation, Inglehart “post-materialism”,
and indicators of individual autonomy and female emancipation.
27
For East Asia see inter alia Frejka, Jones, and Sardon (2010), McDonald (2009) and Gautier (2016).Lesthaeghe Genus (2020) 76:10 Page 15 of 38
The rise of pre-marital cohabitation
Entering a consensual union involves a moral choice and presupposes a high degree of
individual autonomy. The postponement of parenthood, by contrast, generally does not
run counter to the prevailing cultural code. Only childlessness is subject to cultural
stigmatisation, and its spreading requires a cultural reversal in the same way cohabit-
ation does. On the whole, the rise of cohabitation is more contingent on ideational
changes than the emergence of the SDT low fertility pattern. In the parlance of the
“Ready, Willing and Able” paradigm (Coale, 1973; Lesthaeghe & Vanderhoeft, 2001),
the rise of cohabitation requires the “Willingness” condition (cultural acceptability) to
be fulfilled, whereas fertility is more dependent on the “Readiness” condition (the
micro-economic utility assessment).
We should also distinguish between three “layers” of cohabitation: (i) an ethno-
historical layer, (ii) a “poor man’s marriage” level, referring to a pattern of disadvantage
(POD), and (iii) a SDT level emerging after the 1970s only. The ethno-historical and
the POD layers are often interwoven and can appear as a combined “built in” pattern
existing prior to 1970.
The major critique levelled at the SDT explanation of rising cohabitation concerns
the source of its increase after 1970. According to the POD thesis, the rise was due to a
worsening of the living conditions of the poorer segment, and not, as the SDT had pos-
ited due to a “cultural revolution” lead by a young, secular and educated stratum. Also,
the economic crises in Latin American countries of the 1980s and the shift to capital-
ism in the FCCs during the 1990s were advanced as prime causes of the rise of cohabit-
ation in these regions. The latter argument pertaining to the respective 1980s and
1990s crises is the weakest one, since the trend toward more cohabitation in the re-
spective regions is a singular and uninterrupted one till today. This trend is currently
affecting young cohorts who were still babies or were not yet born at the time of these
crises. Also, there is no spurt in the cohabitation trend immediately following the re-
spective crises, and in the Latin American instance, several countries witnessed an ac-
celeration in their upward cohabitation trend only after the year 2000.
The argument that the source of the cohabitation rise was not necessarily the edu-
cated elite holds more water in various regions and warrants further inspection. Hence,
we need to follow the effects of the three layers over time in the different world regions
with their contrasting prevailing kinship systems and ethical/religious codes.
The rise of cohabitation in Europe: gradients by education
In the discussion of the POD versus the SDT explanations for rising cohabitation use is
commonly made of the education-related profiles. The European data commonly stem
from sample surveys, and in what follows the results are based on the Gender and Gen-
erations Survey harmonised data set. The indicator is the share of cohabitation among
all unions (i.e. marriage + cohabitation) for women 25–29, but with the added restric-
tion that they had to be for at least 1 year in a union. In this way, we eliminate short-
term cohabitation among younger women and obtain a more robust measurement of
longer-term cohabitation in more established unions.
The overall evolution of this share of cohabitation is depicted in Fig. 5. This illus-
trates that again two groups of populations developed in Europe: the Nordic andLesthaeghe Genus (2020) 76:10 Page 16 of 38
Fig. 5 Expansion of cohabitation in selected European countries: Proportion of women aged 25–29 who
cohabited for at least 1 year relative to all women 25–29 who were in a union (married + cohabiting) for at
least 1 year; 1960-2004. Source: Courtesy of Jorik Vergauwen, Antwerp University. Data: Gender and
Generations Survey harmonised data and national surveys
Western countries, including the German-speaking trio, have a take-off in the 1970s
and evolve beyond the 50% level in 2000–2004. Norway is at the top and Germany at
the bottom of this group. Note that Estonia too passed the 50% threshold.28 The sec-
ond group is made up of the rest of Europe, with a later take-off date in the 1990s, and
generally with a slower development thereafter. In this group, Spain is in the lead,
whereas Italy, Poland and Romania are at the tail of the distribution.
The education profiles use 3 groups based on the ISCED codes,29 and the results for the
same indicator among women 25–29 are given in Fig. 6. As expected on the basis of the
SDT theory, the best educated group of women 25–29 is continuously in the lead from
the start onward in Western countries: Netherlands, Austria, France, Belgium, and also
Germany. Rather flat profiles are found for Norway and the UK with minor shifts in the
pattern of the gradients by education. There are also interesting contrasts. For instance,
Spain also follows the positive gradient and advances far more rapidly than Italy.
The POD pattern is more typical for the FCCs, where rises were initiated in the lower
education category. Typical are Bulgaria, Romania and Russia. The exception appears
to be Hungary, where the advances are more pronounced among the higher education
group. However, equally relevant is the subsequent emerging of a V-shaped pattern in-
dicative of a catching up by the better educated. This later V-shape is present in virtu-
ally all FCCs considered here.
On the whole, Fig. 6 indicates that the successive upward shifts in the cohorts reaching
the age group 25–29 become far more important than the education-related differences
once the trend moves beyond the mere take-off phase.30 Obviously, pre-marital
28
Estonia is the only former communist country with such a rapid rise in cohabitation and follows the
Nordic model, in contrast to Lithuania which is the most conservative country of the three Baltic states. See
Katus, Puur, Põldma, & Sakkeus, 2007.
29
The low group corresponds with ISCED 1 and 2, the middle group with ISCED 3 and 4 and the high group
with ISCED 5 and 6.
30
Leridon and Villeneuve-Gokalp (1989 ) dated the rapid diffusion of pre-marital cohabitation across French
social classes as early as the 1970s.Lesthaeghe Genus (2020) 76:10 Page 17 of 38
Fig. 6 Expansion of cohabitation by level of education in selected European countries—share of
cohabitation for at least 1 year relative to all women 25–29 who were in a union (married + cohabiting) for
at least 1 year. Source: Courtesy of Jorik Vergauwen, Antwerp University. Data: Gender and Generation
Survey harmonised data and national surveysLesthaeghe Genus (2020) 76:10 Page 18 of 38
Fig. 6 Expansion of cohabitation by level of education in selected European countries—share of
cohabitation for at least 1 year relative to all women 25–29 who were in a union (married + cohabiting) for
at least 1 year. Source: Courtesy of Jorik Vergauwen, Antwerp University. Data: Gender and Generation
Survey harmonised data and national surveysLesthaeghe Genus (2020) 76:10 Page 19 of 38
Fig. 6 Expansion of cohabitation by level of education in selected European countries—share of
cohabitation for at least 1 year relative to all women 25–29 who were in a union (married + cohabiting) for
at least 1 year. Source: Courtesy of Jorik Vergauwen, Antwerp University. Data: Gender and Generation
Survey harmonised data and national surveysLesthaeghe Genus (2020) 76:10 Page 20 of 38
cohabitation spreads rapidly across all layers of population, and as a consequence, the
POD versus SDT discussion becomes irrelevant once the trend starts accelerating.
Cohabitation in North America
Data on proportions currently cohabiting women of ages 20–25 among all such women
in a union (married + cohabiting) are available for the USA and for Canada. The data
for the US stem from the censuses of 1990 and 2000 and are basically best estimates.
Thereafter, we can rely on direct questions in the American Community Surveys (ACS)
for the years 2007–2011 (pooled data). The Canadian data are census data for the years
1986, 1996 and 2006 (Laplante & Fostik, 2016).
On the basis of percentages ever-cohabited, the US has experienced a transition
from a slightly positive education-related gradient to a slightly negative one, but
the education differences are again not substantial (Neels & Perelli-Harris, 2012).
The data for currently rather than ever-cohabiting women for the US exhibit a
more systematic negative gradient from age 25 onward, mainly because the better
educated have faster transitions to marriages and not because of a lower inci-
dence at earlier ages (Lesthaeghe & Esteve, 2016). On the whole, the incidence of
cohabitation is lower in the US than in any of the other countries on the entire
American continent, and lower than in Western European countries. At the 1990
census, the education gradient of current cohabitation exhibits a POD pattern
among women aged 25–29 years. This pattern has been maintained over time,
but is weakening in relative terms as the overall incidence of 25–29-year-old
women cohabiting more than trebled from 1990 to 2007–2011 (see Table 3). The
negative education-related gradient witnessed in the US censuses stems in part
from the high cohabitation prevalence among the black population, as also shown
in Table 3.
The middle education group (complete high school, some university) has the largest
gains in rates of cohabitation across this period, and has come at par with the lowest
education group. The proportion among those with at least a university degree also
doubled. As with European countries, the overall rise in rates of cohabitation in the US
is considerably more important than the educational differences. Another interesting
feature for the US is that the two higher education groups in the younger age group
20–24 years in the ACS data have a slightly higher incidence of cohabitation than those
Table 3 USA: percent cohabiting among women 25–29 in union, 1990–2011, by race and
education
Census 1990 Census 2000 ACS 2007–2011
White non-Hispanic 9.9 16.1 23.2
Black 16.7 23.5 31.1
Hispanic 9.8 13.7 21.9
Less than complete high school (LSH) 13.6 16.2 24.3
High school or some college (HS or SC) 9.9 16.4 24.4
BA or higher 9.7 15.3 20.5
Total 10.3 16.0 22.9
Lesthaeghe et al. (2016): authors tabulations based on the Censuses and American Community Survey samples from the
IPUMS-USA databaseLesthaeghe Genus (2020) 76:10 Page 21 of 38
with less than complete high school, indicating that the better educated initiate their
partnerships via cohabitation at least as frequently as the least educated (Lesthaeghe,
Lopez-Colas, & Neidert, 2016). This is in line with the much earlier, but forgotten, ob-
servation by Macklin (1972) that cohabitation had expanded among college students
during the turbulent 1960s as well.
As age advances (i.e. as we examine cohorts of women of increasingly older ages than
25–29 years), the best educated have a larger drop off of rates of cohabitation than the
less educated, reflecting that the best educated are more prone to convert their cohabit-
ing union into a marriage (Lesthaeghe et al., 2016). This is a “sorting effect” (Fürsten-
berg, 2013): transition from cohabitation to marriage probably reflects the better
financial position of university degree holders, and also a cultural “embourgeoisement”
which sets them apart as an educated upper middle class.
For the Canadian provinces, measurements are available for 1986, 1996, and 2006
(Laplante & Fostik, 2016) for percentages of currently cohabiting women of 25–29 years
among all women of that age currently in a union (married plus cohabiting). The edu-
cation gradients are essentially flat in the provinces, with the highest incidence of co-
habitation in Quebec (above 60% in 2006), the North (mainly Inuït) and the Atlantic
provinces. The provinces with the lowest incidence of cohabitation (Ontario, Manitoba,
Saskatchewan, Alberta, British Columbia) exhibit a slightly negative educational gradi-
ent in 2006 but there was no such negative gradient in 1986. Quebec is the exception: a
higher proportion of the better-educated cohabitated, and as a result this francophone
province followed the Western European SDT pattern. The bottom line for all prov-
inces is that the overall rise during the 20 years of observation is much more substantial
than any of the educational differences.
The Latin American education-related profiles of pre-marital cohabitation: multiple layers
to be considered
As is well known, many Latin American populations had significant proportions of
consensual unions well before the cohabitation boom started in Europe and North
America after 1970. The custom of cohabitation was mainly concentrated in the poor-
est strata. There also were important differences in rates of cohabitation between ethnic
groups, with notably high rates among indigenous populations with hunter-gatherer or
nomadic backgrounds, as well as the black populations. Also racially mixed populations
tend to have extant traditions of consensual unions. These high rates of cohabitation
contrast with the low rates among better-educated white populations, such as the late
nineteenth and twentieth century European immigrants in the Southern Cone of South
America (Uruguay, Argentina, Chile) who strengthened the institution of marriage.
Furthermore, the European marriage became a mark of upward social mobility. The
net result is that all Latin American countries, whether rich or poor, exhibit a negative
education-related gradient. In short, at the onset there was a clear POD pattern, often
with a strong ethnic component (Esteve, Lesthaeghe, Lopez-Gay, & Garcia-Roman,
2016) and this has remained a “locked-in” feature till the present day.
31
This pertains to Brazil, Colombia, Mexico, Uruguay and Chile for which several World Values Surveys are
available.You can also read