The State of Latino Education - Texas Association of Chicanos in Higher Education

Page created by Kurt Hart
 
CONTINUE READING
The State of Latino Education - Texas Association of Chicanos in Higher Education
The State of Latino Education

 Texas Association of Chicanos in
        Higher Education
            Feb. 18, 2019

        Raymund A. Paredes
  Commissioner of Higher Education
The State of Latino Education - Texas Association of Chicanos in Higher Education
Texas Demographics Are Diverse

                                                      TEXAS POPULATION WITH A
          TEXAS POPULATION:                            CERTIFICATE OR DEGREE:
           AGES 25-34, 2017                               AGES 25-34, 2017
      White    Hispanic    African American   Other    White    Hispanic   African American    Other

                      8%                                          13%

              13%

                                       38%                 12%

                                                                                         49%

                                                               26%
                41%

    While Latinos make up 41 percent of the Texas population
    between the ages of 25 and 34, only 26 percent of those with a
    degree or certificate are Hispanic.
                                                                                                       2
The State of Latino Education - Texas Association of Chicanos in Higher Education
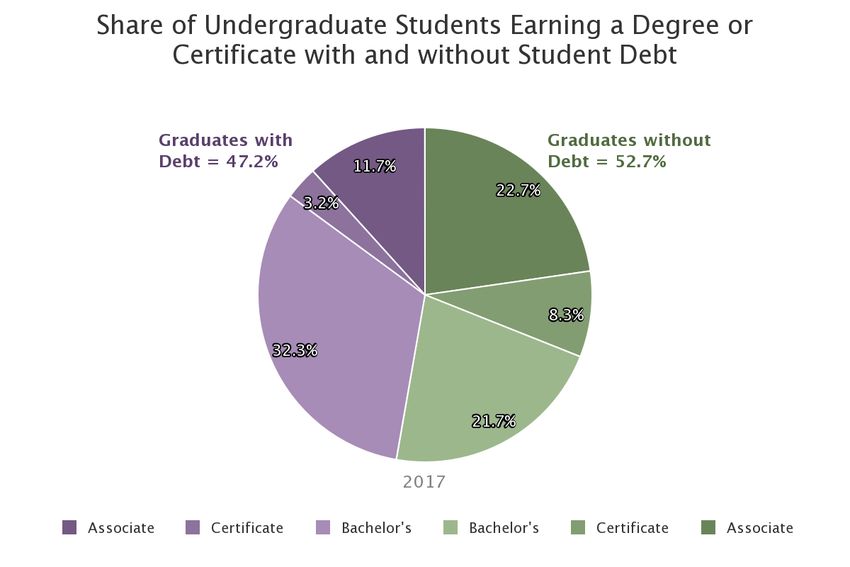
Texas has a Growing College-Going Population

• As one of a handful of states that is growing in its college-going
 population, Texas expects to produce over 65,000 more high school
 graduates in 2032 than we did in 2011.

• The youthfulness of our population is one of our greatest assets.

• How well we educate our children, especially our Latino children,
 will determine the fate of Texas in the 21st Century.

                                                                       3
The State of Latino Education - Texas Association of Chicanos in Higher Education
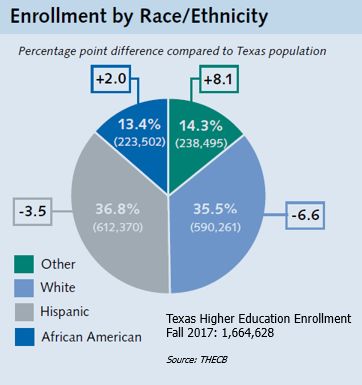
Texas Must Improve College Readiness

                                                               State-wide Graduating Class of 2017

                   SAT                                                    ACT                           TSIA
                   38% met both (2)                                                                     29% of IHE enrollees met in
                                                                          24% met all four benchmarks
                   benchmarks                                                                           all areas
                                                                          12% - Hispanic
                   27% - Hispanic                                         8% - African American         26% - Hispanic
                   20% - African American                                 27% - Male                    20% - African American
                   42% - Male                                                                           31% - Male

Sources used to make the calculations in this visual include:
2017 SAT Suite of Assessments Annual Report
2017 ACT Profile Report – Texas Public High School Students
CBM002 Administrative Report, Texas Higher Education Coordinating Board
Class of 2017 Graduation Report, Texas Education Agency

                                                                                                                                      4
The State of Latino Education - Texas Association of Chicanos in Higher Education
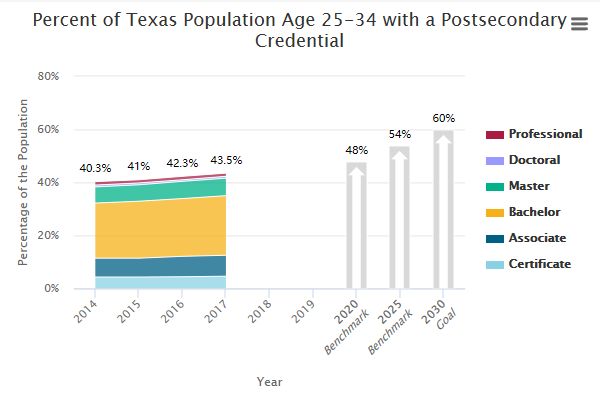
Dual credit data for Latino students
                                            Fall 2018 Dual Credit Enrollment
                                                                                                 All dual        Hispanic        % Hispanic
 Although less than a majority, Latino      Univ                                                        10,942           4,713           43.1%

 students make up the largest number        CTC                                                     174,313             82,722           47.5%
                                            Total                                                   185,255             87,435           47.2%
 of dual credit students in the state (47   Source: CBM001
 percent of all enrollments).
                                            Fall 2018 Average Attempted SCH: Hispanic Students
 -   84 percent of Latino students took                             Type of                      Num Dual Dual Credit             Dual SCH

     academic dual credit and no                                    Institution                    Credit              SCH           Per
                                                                                                  Students                         Student
     technical dual credit in fall 2018.    All                                                         87,435         500,609              5.7
 -   4 percent took at least one each of    Public univ                                                  4,713          25,800              5.5

     academic and technical                 CTC
                                            Source: CBM001
                                                                                                        82,722         474,809              5.7

 -   12 percent took only technical dual
     credit.                                Fall 2018 by Type Major: Hispanic Students
                                                                                                 Univ            CTC             Total            %
                                            Academic                                                     4,713          68,713           73,426   84.0%
                                            Technical                                                        0          10,858           10,858   12.4%
                                            Academic & Technical                                             0           3,151            3,151   3.6%
                                            Total                                                        4,713          82,722           87,435 100.0%
                                            Source: CBM001

                                                                                                                                                          5
College Enrollment Rates for Latino High School
Graduates are Growing
       THE PERCENTAGE OF HIGH SCHOOL GRADUATES ENTERING TEXAS
             PUBLIC HIGHER EDUCATION IN FALL BY ETHNICITY
                         Enrolled Fall 2000   Enrolled Fall 2017

                                                                         65%
                                                                   65%
                                                    52%

                                                            50%
                               46%
            46%

                       39%
     38%

      HISPANIC      AFRICAN AMERICAN                  WHITE          OTHER

                                                                               6
8th Grade Cohort Latino Outcomes
Of 100 Hispanic 8th                                                            2008 8th Grade Cohort Outcomes
graders enrolled in fall                                                                    Hispanic and overall cohort

2008:
                                                90%

-     76 graduated from                         80%
                                                              78%
                                                                            76%

      public high school
                                                70%

                                                60%                                                  54%
                                                50%                                                                47%

-     47 enrolled in higher                     40%

      education                                 30%
                                                                                                                                          23%
                                                                                                                                                        17%
                                                20%

-     17 received a higher                      10%

      education degree or
                                                0%
                                                      % Graduated frpm Public High School       % Enrolled in Higher Education   % Higher Education Credential in Texas

      certificate
Source: 2019 Texas Higher Education Almanac -                                                        Total   Hispanic
forthcoming

                                                                                                                                                                          7
Percent of Student Population by Race/Ethnicity
                                        Texas Public Two-Year Institutions
                        100%

                        90%

Among ethnic groups     80%
                                           31%
                                                                             34%

in Texas, Latinos are
the largest             70%
                                            4%
                                                                             3%
                                                                                                  White

population of public
                                            3%
                        60%                                                  3%
                                                                                                  Other

two-year college        50%
                                                                                                  International

enrollees and award                                                                               Hispanic

earners.                40%                45%
                                                                             43%                  Asian

                        30%                                                                       African
                                                                                                  American

                        20%

                                            5%                               4%
                        10%
                                           13%                               12%

                         0%
                               Enrollment Fall 2018 (758,113)   Degrees & Certificates Awarded,
                                                                      FY2018 (124,570)

                                                                                                                  8
Latinos who start at a two-year are less likely than many
other groups to transfer to a four-year institution

                         Two-Year College Transfer by Rate by Ethnicity
                  Percentage of entering students in the 2012 cohort who transferred within 6
                                                      years

                                                             42.4%

         27.2%

                                                                                            23.1%
                                             21.1%                          21.0%

                             15.9%

          White           African American   Hispanic        Asian           Other              Total

                                                                                                        9
Overall, Latinos are still underrepresented in higher
education in Texas

                                                        10
Latinos represent 37.5% of four-year undergraduate
enrollments, but just 32.5% of four-year completions
                    Percent of Undergraduate Student Population by
                                    Race/Ethnicity
         100%                               2.6%
                       3%                                            2.7%

                      13%                  11.4%                    11.4%
         90%

         80%

         70%          28%
                                           36.3%
                                                                    42.7%
         60%                                                                           International
                                                                                       Other
         50%
                                                                                       White
                                                                                       Hispanic
         40%
                                                                                       African American
                      42%
         30%                               37.5%
                                                                    32.5%

         20%

         10%
                      13%                  12.2%                    10.7%
          0%
                Accepted, Fall 2018   Enrolled, Fall 2018   Degrees awarded, FY 2018

                                                                                                          11
Latino 6-year graduation rates have improved almost 18
percentage points since 2000

                                      12

                                                         12
Affidavit students totaled 25,930 in FY 2017 – 1.5% of
total Texas public higher education enrollments

                                                            Total Affidavit Students
             Higher Education Sector                           (TEC 54.052(a)(3))
                                                    FY 2016               FY 2017
   Public Universities                                      7,863                  8,568
   Public Community, Technical and State Colleges         17,261                  17,318
   Public Health Related Institutions                          27                     44
   Total All Public Institutions                          25,151                  25,930

                                                              13

                                                                                           13
Texas made steady progress, but accelerated growth is needed
for several targets related to completion and student debt
                                                                               One-Year   Annual %                2030
                                                                             Improvement             2020
        Goal                     Target                   2016      2017                  Increase               Goal/
                                                                              (pc = point          Benchmark
                                                                                           Needed                Target
                                                                                change)
        60x30      60x30 (Educated Population)           41.0%      42.3%      1.3% pc     1.3%         48%       60%

                   Overall                               321,410   333,920      3.9%       3.9%        376,000   550,000

                      Hispanic                           103,889   111,344      7.2%       7.5%        138,000   285,000

                      African American                   38,813    41,027       5.7%       4.5%        48,000    76,000
      Completion
                      Male                               135,849   141,564      4.2%       5.2%        168,000   275,000

                      Economically Disadvantaged         119,490   124,178      3.9%       5.3%        146,000   246,000

                      TX High School Graduates
                                                         51.9%     52.3%        0.4 pc      .7%         58%       65%
                      Enrolling in TX Higher Education
      Marketable
        Skills
                   Working or Enrolled Within One Year   78.8%      78.4%     -0.40% pc      --         80%       80%
                   Student Loan Debt to First Year
                                                          60%       59%        -1% pc        --         60%       60%
                   Wage Percentage
       Student
        Debt
                   Excess SCH Attempted*                   19        18         -1 SCH       --          12        3
                   Percent of Undergraduates                                                      14
                                                         48.2%      47.2%      -1% pc        --         50%       50%
                   Completing with Debt

                                                                                                                           14
Key Insights

• The 60x30 goal and the completion goal showed strong improvement--at rates
 needed to reach 2030 goals.
• Completions for male and economically disadvantaged students grew modestly but
 are falling behind needed progress.
• Direct enrollment from high school increased slightly after a two-year decline and
 requires additional attention.
• Marketable skills and student debt goals remain steady, although excess semester
 credit hour reductions need to pick up the pace.

                                                                                       15
The 60x30 Educated Population goal increased by 1.3 percentage points
from 2015 to 2016 and another 1.2 percentage points in 2017

                                                                        16
Completions increased by more than 12,000 credentials between 2016
and 2017
           Bachelor’s degrees had the largest share, while associate
           completions increased fastest

                          52K   53K

                          87K   91K

                         129K   134K

                          53K   56K

                                                                       17
All target populations increased completions; Hispanic and African
American student completions achieved projected gains
                                                         Target:
                                                         285,000                                     Target:
         Target Populations: African American,                                                       275,000
         Hispanic, Economically Disadvantaged,                                 Target:
                                                                               246,000
         and Males Completing in Texas

                                                                                               141,564
                                                                         124,178         135,849
                                                   111,344         119,490
                                             103,889
                                   Target:
                                   76,000

                              41,027
                     38,813

                                                                                                               18
After a two-year decline, direct enrollment from high school increased
slightly from 51.9% to 52.3%

                                                                         19
Many students follow a pathway directly from K-12 to
higher education, though too few succeed today
            22 percent of 8th graders complete a credential
                         11 years later

  Texas public school 8th graders

  • Complete high school within 5 years

  • Complete a certificate or degree within 6 years

                                                              20
The 60x30 Educated Population goal counts residents who follow
a variety of education pathways, including those who. . .
 • Migrate into TX with credentials or migrate to TX to earn a credential and stay
 • Receive credentials in-state after attending public high school in TX
 • Receive credentials in-state after earning GEDs, attending private high school
   or homeschooling
 • Receive credentials in-state as adult students who did not go directly from high
   school or stopped out and returned to complete college
 • Went to high school in TX, left the state to complete higher education, and
   returned

                                                                                      21
Students who take alternative pathways make up 64
percent of undergraduate completions in Texas
           259,013 Students Completed Undergraduate
                      Credentials in 2017

                 9%                       8th Grade Cohort completers
           5%                             (93,426)
                                          More than 6 years in college or
                            36%           delayed start (63,060)
                                          Texas residents, did not graduate from
           26%                            Texas public high school (67,568)

                                          Out of state resident (12,682)

                      24%                 Out of country residents (22,277)

                                                                                   22
45 percent of completers in 2017 were 25 years or older
                                      Undergraduate Degrees Awarded, by Age FY 2017

                                                     40,936

                                                                                                             110,462
   Completions

                                                                54,527

                                        26,792

                                                  37,624

                     7,772

                 0           20,000              40,000          60,000             80,000         100,000       120,000
While achievement of the 60x30 Educated Population Goal is
possible, systemic improvements are essential for success

   • Retain Texas graduates                • Invest in and improve
   • Recruit graduates from other           pathways through Texas K-12
     states
                                            schools to ensure students
   • Strength of our economy is critical
                                            are college ready
      • Economic development and job
        opportunities                      • Improve all other pathways
      • 21st century industries             into and through higher
      • Competitive wages                   education
                                                                          24
The THECB enhanced support for the marketable skills goal; institutions
reported varied levels of progress

    • Marketable skills implementation guidelines were developed.

    • Marketable skills conference offered technical assistance to institutions about how
     to develop marketable skills and how to communicate skills to students.

    • The target related to the percent of graduates in Texas found working and/or
     enrolled in Texas in the first year following graduation remained steady at 78.8%.

                                                                                            25
Student debt as a percentage of first-year wage remained below the
60% goal

             Baseline      Recent Trend Years     Target
              Year
               2013        2014         2015       2030

            59.5% 59.8% 58.9% 60%

                                                                     26
The share of graduates with debt declined for the second year in a row
to 47.2%

                                          Target:
                                          Limit proportion of
                                          undergraduates with
                                          debt to no more than
                                          half.

                                                                         27
Excess semester credit hours decline modestly; substantial
progress is needed to reach the 2020 benchmark of 12 SCH

                          27
                                          26

                                               Target:
                     14                        Decrease excess
                                     13
                                               SCH to 3 by
                                               2030.

                                                                 28
The agency is supporting the strategic use of data to inform institution-
and state-level policy and practice

    • 60x30TX.com and revised
     accountability system

    • Almanac

    • Data Fellows program

    • Regional 60x30TX Targets

                                                                        29
Latinos are critical to 60x 30TX success

    - By 2050, Latino workers in Texas will outnumber
      Anglo workers three to one.

    - Given that the future workforce will be more
      diverse, the challenge is clear: Students of all
      backgrounds must complete certificates and
      degrees in larger numbers if Texas is to remain
      competitive in the global economy.

                                                         30
If we achieve all these actions, we will make significant strides
toward 60x30TX.

We will reinvigorate higher education as the primary engine of
social mobility.

We must be relentless in these efforts.

                                                                    31
You can also read