THE WORLD-LEADING PROVIDER OF MULTIPLATFORM MUSIC PRODUCTS AND SERVICES - March 2018 - Stingray
←
→
Page content transcription
If your browser does not render page correctly, please read the page content below

THE WORLD-
LEADING PROVIDER
OF MULTIPLATFORM
 MUSIC PRODUCTS
    AND SERVICES

        March 2018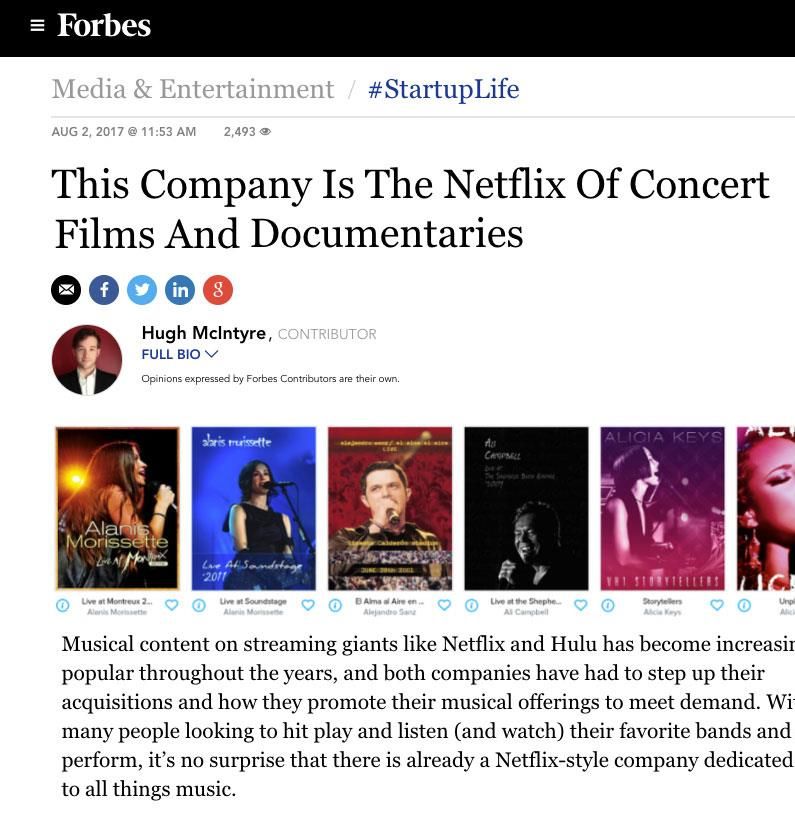
LEGAL DISCLAIMER
Forward-Looking Information
This document contains forward-looking information within the meaning of applicable Canadian securities laws. This forward-looking information includes, but is not limited to, statements with respect to management’s expectations regarding the
future growth, results of operations, performance and business prospects of the Stingray Digital Group Inc. (the “Corporation”). This forward-looking information relates to, among other things, our objectives and the strategies to achieve these
objectives, as well as information with respect to our beliefs, plans, expectations, anticipations, estimations and intentions, and may also include other statements that are predictive in nature, or that depend upon or refer to future events or
conditions. Statements with the words “could”, “expect”, “may”, “will”, “anticipate”, “assume”, “intend”, “plan”, “believes”, “estimates”, “guidance”, “foresee”, “continue” and similar expressions are intended to identify statements containing forward-
looking information, although not all forward-looking statements included such words.
In addition, any statements that refer to expectations, projections or other characterizations of future events or circumstances contain forward-looking information. Statements containing forward-looking information are not historical facts but instead
represent management’s expectations, estimates and projections regarding future events.
Although management believes the expectations reflected in such forward-looking statements are reasonable, forward-looking statements are based on the opinions, assumptions and estimates of management at the date the statements are
made, and are subject to a variety of risks and uncertainties and other factors that could cause actual events or results to differ materially from those projected in the forward-looking statements. These factors include, but are not limited to the risk
factors disclosed in the Annual Information Form for the year ended March 31, 2017 available on SEDAR.
In addition, if any of the assumptions or estimates made by management prove to be incorrect, actual results and developments are likely to differ, and may differ materially, from those expressed or implied by the forward-looking statements
contained in this document. Such assumptions include, but are not limited to, the following: our ability to generate sufficient revenue while controlling our costs and expenses; our ability to manage our growth effectively; the absence of material
adverse changes in our industry or the global economy; trends in our industry and markets; the absence of any changes in law, administrative policy or regulatory requirements applicable to our business, including any change to our licenses with
the CRTC; minimal changes to the distribution of the pay audio services by Pay-TV providers in light of recent CRTC policy decisions; our ability to manage risks related to international expansion; our ability to maintain good business relationships
with our clients, agents and partners; our ability to expand our sales and distribution infrastructure and our marketing; our ability to develop products and technologies that keep pace with the continuing changes in technology, evolving industry
standards, new product introductions by competitors and changing client preferences and requirements; our ability to protect our technology and intellectual property rights; our ability to manage and integrate acquisitions; our ability to retain key
personnel; and our ability to raise sufficient debt or equity financing to support our business growth. Accordingly, prospective purchasers are cautioned not to place undue reliance on such statements.
All of the forward-looking information in this document is qualified by these cautionary statements. Statements containing forward-looking information contained herein are made only as of the date of this document. The Corporation expressly
disclaims any obligation to update or alter statements containing any forward-looking information, or the factors or assumptions underlying them, whether as a result of new information, future events or otherwise, except as required by law.
IFRS and Non-IFRS Financial Measures
The annual consolidated financial statements of the Corporation have been prepared in accordance with International Financial Reporting Standards (“IFRS”) as issued by the International Accounting Standards Board (“IASB”) and are stated in
Canadian dollars.
The Corporation believes that Adjusted EBITDA and Adjusted EBITDA margin are important measures when analyzing its operating profitability without being influenced by financing decisions, non-cash items and income taxes strategies.
Comparison with peers is also easier as companies rarely have the same capital and financing structure. The Corporation believes that Adjusted net income and Adjusted net income per share are important measures as it demonstrates its core
bottom-line profitability. The Corporation believes that Adjusted free cash flow is an important measure when assessing the amount of cash generated after accounting for capital expenditures and non-core charges. It demonstrates cash available
to make business acquisitions, pay dividend and reduce debt. The Corporation believes that Net debt including and excluding contingent considerations and Net debt to Adjusted EBITDA are important measures when analyzing the significance of
debt on the Corporation’s statement of financial position. Each of these non-IFRS financial measures is not an earnings or cash flow measure recognized by IFRS and does not have a standardized meaning prescribed by IFRS. Our method of
calculating such financial measures may differ from the methods used by other issuers and, accordingly, our definition of these non-IFRS financial measures may not be comparable to similar measures presented by other issuers. Investors are
cautioned that non-IFRS financial measures should not be construed as an alternative to net income determined in accordance with IFRS as indicators of our performance or to cash flows from operating activities as measures of liquidity and cash
flows. See the reconciliation tables for all Non-IFRS measures in the Annual Report 2017 and quarterly report for the period ended September 30, 2017.

                                                                                                                                                                                                                                                            2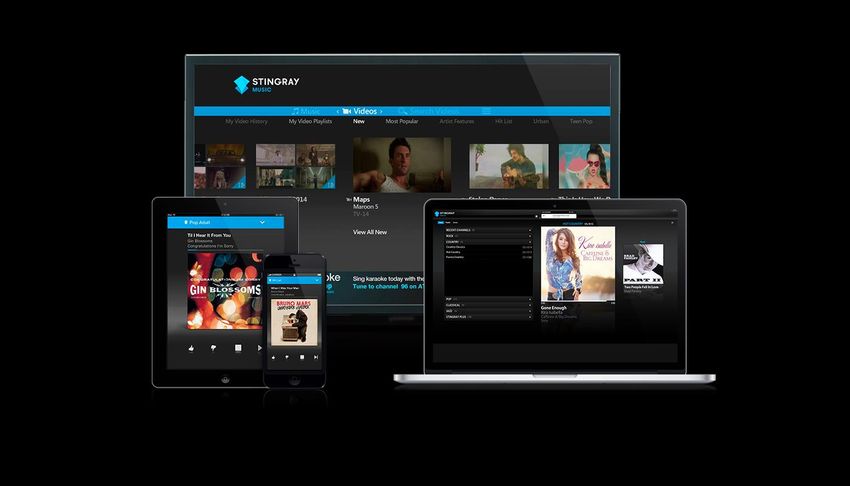
PRESENTATION

               Speaker

               Eric Boyko
               CEO

               Mathieu Péloquin
               SVP, marketing & communications

                                                 3
DID YOU KNOW ?

        400                         1.5                       100
          MILLION                    BILLION                    MILLION
    subscribers across all     streamed hours monthly         App downloads
   services in 152 countries

       50%                            78                        20
                                                                MILLION
                                   THOUSANDS
    Canadian listenership       Commercial music and          Monthly visits to
    January 2018 survey        digital signage locations   Stingray’s Mobile apps

                                                                                    4
LEADING B2B MULTI-PLATFORM MUSIC AND IN-STORE MEDIA
SOLUTIONS PROVIDER WORLDWIDE
> $110.8 million in revenue Music Broadcasting Commercial Music
(CAGR of 31.8%)
> 86.5% of recurring revenue
74% of Total Revenue 26% of Total Revenue
> $36.4 million in Adjusted EBITDA(1)
(CAGR of 29.5%)
> $4.2 million in Net income Multi-platform music audio
Custom music programming,
channels, karaoke, long form
> Strong cash flow generation digital signage, one-stop
TV channels and music videos
solution
channels
▪ $29.0 million in Adjusted FCF(1)
▪ $18.5 million in cash flows from operating
activities Reach of 400 million Pay-TV 78,000 establishments
subscribers across Canada
> Industry consolidator with 34 acquisitions
All figures for LTM ended September 30, 2017. CAGR calculated for the period from March 31, 2008 to LTM September 30, 2017.
Note 1: Refer to “IFRS and Non-IFRS measures” on page 2 and to “Supplemental information on Non-IFRS measures” on page 2 and 6 of the quarterly report ended September 30, 2017.
5CURRENT COMPANY GOALS
1| Aggressively pursue our M&A strategy, 5-25 plan.
2| Maintain 5% organic growth across broadcasting and commercial.
3| Maintaining 32% to 34% margins with acquisitions and increase of BtoC business.
4| Increase roll-out of SVOD services and mobile reach.
5| Generate new sale as the one-stop-shop for our clients’ Music Strategy.
6PRODUCTS & SERVICES ARCHITECTURE
MUSIC DELIVERED AS TV CHANNELS & VOD CONTENT
ON TELEVISION, MOBILE, AND THE WEB
KARAOKE CHANNELS, SVODs and MUSIC VIDEOS ORIGINAL BUSINESS
AUDIO CONCERTS & SHOWS MUSIC VIDEOS CONTENT SERVICES
Stingray Karaoke Stingray Music Stingray iConcerts Stingray Hits Stingray PausePlay Stingray Business
Yokee Music Stingray Classica Stingray Vibe Background Music
Digital Signage
Stingray DJAZZ Stingray Loud
Music Videos
Qello Concerts Stingray Retro
Stingray Pass
4K UHD
Stingray Juicebox
Stingray Platine
Stingray Ambiance 4K And more to come
Stingray Festival 4K
C Music TV
NatureVision TV
4K UHD
Television Mobile Web SVOD Stingray NOW 4K
Channels
7GLOBAL SVOD MARKET
▲ 2016-2021 Subscriber CAGR(1)
▲
▲9.4% ▲11.2%
$6,809 SVOD Revenue (USD $million)(1)
$20,437
$3,997
$13,031
Europe
2016 2017 2018 2019 2020 2021
North America
2016 2017 2018 2019 2020 2021 Asia Pacific
Middle East & ▲18.1%
▲11.6% Africa $8,261
$908
▲23.2%
$263 $3,589
$524
LATAM $93 2016 2017 2018 2019 2020 2021
2016 2017 2018 2019 2020 2021
2016 2017 2018 2019 2020 2021
(1) Source: PwC Global entertainment and media outlook 2017-2021.
8STINGRAY SVOD SERVICES B2B & B2C SUBSCRIPTIONS
Q3 2018 Q2 2018 Q1 2018 Q4 2017
B2B 196K 156K 96K 29K
B2C 150K 62K 58K 50K
346K 218K 154K 79K
▲59% ▲42% ▲95%
from prior quarter from prior quarter from prior quarter
9QELLO CONCERTS
Strategic Partner in the SVOD space
Stingray widens its reach in the fast-growing OTT space through the
acquisition of New-York based Qello Concerts in early January 2018.
Qello Concerts is the world’s leading OTT streaming service for full-length,
on-demand concerts and music documentaries available on TV, mobile and
web through a wide range of distribution channels:
- Apple (iPhone & iPad, Apple TV)
- Android (mobile, tablet, TV)
- Amazon Channels (mobile, tablet & Fire TV)
- Windows (mobile, PC)
- Roku
- PS 3 and 4
- Opera TV
10THANK YOU
You can also read