Town of Hume 2010 Comprehensive Plan
←
→
Page content transcription
If your browser does not render page correctly, please read the page content below
Town of Hume
2010 Comprehensive Plan

Plan Adopted on December 15, 2010                  Town of Hume
                                           20 North Genesee Street
                                    Fillmore, New York 14735-0302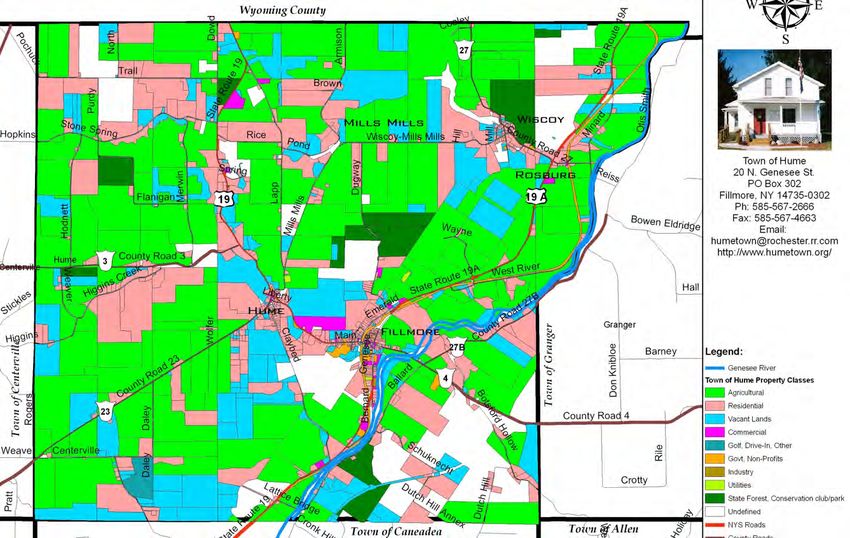
The Town of Hume was
 established in 1822.

Page 2                  Town of Hume
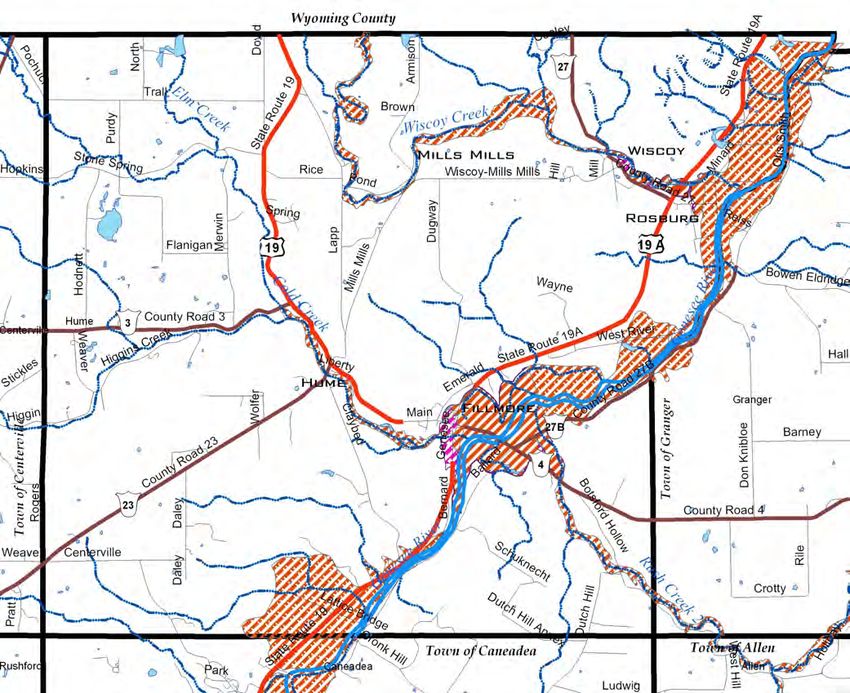
Table of Contents

Section                                                                                                                                                                                Page

Introduction ............................................................................................................................................................................... 4

Community Profile ..................................................................................................................................................................... 8
 Location & Early History ......................................................................................................................................................... 9
 Population Characteristics .................................................................................................................................................. 10
 Housing & Property Characteristics .................................................................................................................................... 12
 Economic Characteristics & Economic Base .................................................................................................................... 17
 Transportation System ......................................................................................................................................................... 20
 Water & Sewer Service ........................................................................................................................................................ 22
 Recreation & Tourism Facilities ........................................................................................................................................... 23
 Agricultural Resources ........................................................................................................................................................ 24
 Natural Resources ............................................................................................................................................................... 26
 Existing Land Use ................................................................................................................................................................. 28
 Implications.......................................................................................................................................................................... 30

Policy Framework.................................................................................................................................................................... 31

Community Vision & Policy Areas ......................................................................................................................................... 32
 Residential Living ................................................................................................................................................................. 34
 Community Resources ........................................................................................................................................................ 40
 Hamlet Revitalization & Economic Development ............................................................................................................. 46
 Rural Environment ................................................................................................................................................................ 56

Future Land Use ....................................................................................................................................................................... 62

Acknowledgements ............................................................................................................................................................... 70

Appendix ............................................................................................................................................... Under Separate Cover

2010 Comprehensive Plan                                                                                                                                                                    Page 3
Introduction
                            Plan Purpose & Intent

                            The purpose of this Comprehensive Plan is to provide an overall framework for future public and private
                            investment in our community. This investment can take many forms, including, but not limited to, our
                            community‘s financial, civic, and creative resources. In Hume, it is this collective investment by our residents,
                            businesses, churches, and our local government that will shape the physical, social, and economic character of
                            our community.
“Among      the most im-
                            It is important to note that this plan is consistent with New York State Municipal Law. According to NYS
portant powers and du-
                            Town Law 272-A, a Comprehensive Plan is defined as, ―the materials, written and/or graphic, including but not
ties granted by the leg-    limited to maps, charts, studies, resolutions, reports and other descriptive material that identify the goals,
islature to a local gov-    objectives, principles, guidelines, policies, standards, devices and instruments for the immediate and long-range
ernment is the author-      protection, enhancement, growth and development of the town located outside the limits of any incorporated
ity and responsibility to   village or city.‖
undertake comprehen-
sive planning and to        This Plan articulates the vision of the Town and establishes our community‘s policies and objectives in order to
regulate land use for       achieve that vision. It will serve as the foundation upon which future planning and policy decisions are to be
the purpose of protect-     based. Although this document is an instrument of Town Policy, it should not foreclose future decisions that
ing the public health,      may not align precisely with the stated vision and policies. However, for actions or decisions that deviate from
safety and general wel-     the strategies expressed in the Plan, a sound argument and rationale must be presented that is as convincing as
                            that presented in the Plan. Such deviations should not be a normal practice or easy to achieve and should be
fare of its citizens.”
                            supported only after careful consideration of the overall benefit to the community.
~ NYS Municipal Law         Planning Horizon

                            The planning horizon is defined by the length of time for which the plan is considered relevant and
                            representative of the community. It also quantifies the length of time necessary to implement a majority of the
                            plan‘s recommendations. The planning horizon for this Comprehensive Planning effort is 11 years or 2021. This
                            allows for the inclusion of the information obtained in the 2020 Census to be included in the next
                            comprehensive planning effort. However, it is recommended that the information contained in this document
                            be reviewed by the Town on a regular basis to ensure that it is relevant and beneficial prior to 2021.

Page 4                                                                                                                     Town of Hume
Introduction
Our Planning Process

The 2010 Comprehensive Plan is a product of a significant amount of time and
                                                                               Land Use Workshop
energy provided by the community, the Steering Committee, Town Staff and a
team of consultants hired by the Town. On May 7, 2008, the Town Board
appointed the Steering Committee to oversee the development of Hume‘s
Comprehensive Plan Update. The Steering Committee consists of 10 volunteers,
representing a broad cross-section of residents living within Hume. The
Committee and the public are key participants in the process used to develop
this Plan. The planning process is outlined below:

    Summer, 2003      Ad Hoc Planning Committee Formed
      Spring, 2004    Community Survey published
         Fall, 2004   Public Input Sessions Held
      Spring, 2009    Consultant team selected to assist in the process
         Jun, 2009    Project Kick-Off Meeting;
    Summer, 2009      Inventory and Analysis;
        Sep, 2009     Preliminary Vision, Policies, and Objectives;
        Nov, 2009     Land Use Workshop;
        Dec, 2009     Preliminary Future Land Use Map;
        Feb, 2010     Identification of Implementation Items;                  A Land Use Workshop was held in November, 2009. The
          Jul, 2010   Draft Plan Comprehensive Plan;                           workshop provided an opportunity for residents from the
  September, 2010     Public Hearing; and                                      Town to discuss preferences on various types of
  December, 2010      Plan Adoption.                                           development. The attendees were also asked to identify
                                                                               the preferred locations of future land uses within the
                                                                               community. This information was used to create the
                                                                               Future Land Use Map contained in this plan.

2010 Comprehensive Plan                                                                                                          Page 5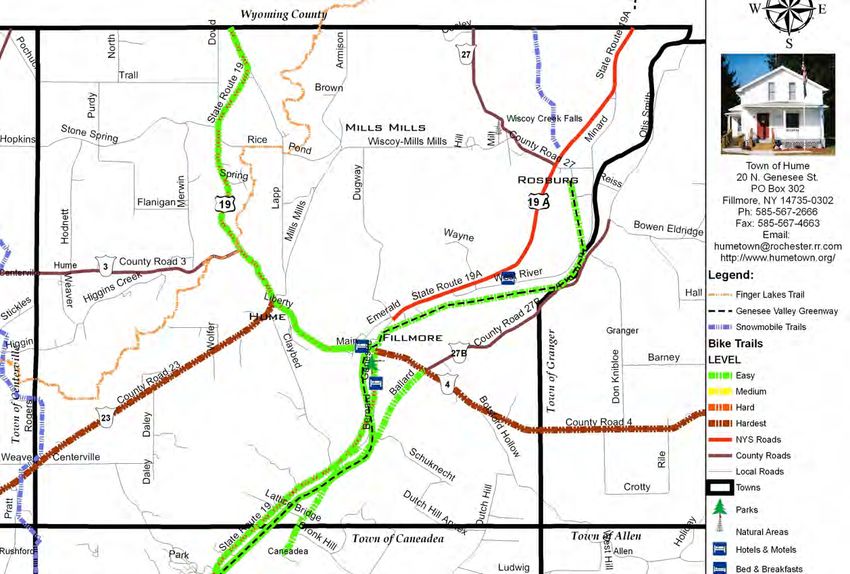
Introduction Key Issues In August, 2009 the Steering Committee participated in a brainstorming exercise to identify the community‘s strengths, weaknesses, opportunities, and threats. A partial list of the issues raised by the group are listed below and will become the basis for the Comprehensive Plan. The Plan will build upon Hume‘s strengths and opportunities, while it addresses its weaknesses and threats. (The complete list of issues raised by the Committee will be contained in the Comprehensive Plan‘s Appendix.) Strengths Opportunities Quiet & safe place to live Recreational resources (Greenway, creek, parks, etc) Presence of farming - rural character Tourism Everybody knows everybody (friendly) Maintaining small businesses & enhancing businesses River, hills, geography, natural landscape Mobilize people to ―shop local‖, etc. People want to stay & move here - retirement Good infrastructure – public water, electricity, internet 1st rate school (provides entertainment, plays, sports, etc) Town web site could be expanded to ―Sell‖ the town College next door & State Park to the north Pursue partnerships with school, college, etc. Strong fiscal position & low(er) taxes Old houses that need fixing up (―fixer uppers‖) Functional business core / center at Fillmore Leverage additional resources to achieve vision Recreational opportunities (hunting, snowmobiling, etc.) Wind energy - windmills Good highway & road system Architectural / historic buildings & historic metal bridge Weaknesses Threats Junk stored on properties & un-kept properties Cold Creek flooding & erosion Business climate is weak, lack of local jobs Public drinking source (well) is near creek erosion Young people moving away Portion of town in 100 year flood plain Number of residents living in poverty creates negative frame of Genesee River flooding & erosion mind moving forward Quick fixes to infrastructure that cost more in long run Lack of volunteers (fire, ambulance) Junk Distances to arts & entertainment & shopping are great Abandoned homes/buildings Fearful of partnering with outside organizations Fewer students in school Many local farmers are gone - farms now operated by Wyoming Farming practices & neighbor issues w/people moving near farms County farmers Water mains on Route 19 are old & need replacing Page 6 Town of Hume
Introduction Commonly Used Acronyms There are numerous agencies, organizations, and planning references used throughout this document. The following list provides the acronyms for the most commonly used names and titles: AFT American Farmland Trust AC Allegany County CBD Central Business District CCE Cornell Cooperative Extension CPS Community Preference Survey DEC Department of Environmental Conservation DOT Department of Transportation DPW Department of Public Works NYPF New York Planning Federation NYS New York State ROI Rural Opportunities Incorporated SEQRA State Environmental Quality Review Act STW Southern Tier West Planning Council US United States 2010 Comprehensive Plan Page 7
Community Profile
This Community Profile is intended to provide a common starting point that will serve as the foundation for
the comprehensive planning process in the Town of Hume. It will also provide local decision makers with the
background necessary to understand the consequences of future actions and the tools needed to make
informed decisions. The information that was chosen to be included in this profile is based on the
brainstorming results listed on the following page as well as sound comprehensive planning practices. The data
sources used to gather this information include but are not limited to:
Town of Hume;
Allegany County;
MRB Group;
Southern Tier West Regional Planning & Development Board;
New York State Comptroller‘s Office, and
This Community Pro-
United States Census.
file is intended to serve
as the foundation of The Community Profile is divided into seven topics: 1) Population Characteristics, 2) Housing, 3) Economic
the comprehensive Base, 4) Community Resources, 5) Transportation System, 6) Natural Resources, and 7) Land Use. Each topic
planning process in is analyzed using numeric data in order to quantify and assess the state of the Town in 2009. For comparison
Hume. purposes, data for the remaining towns within Allegany County are also provided when appropriate.
Page 8 Town of Hume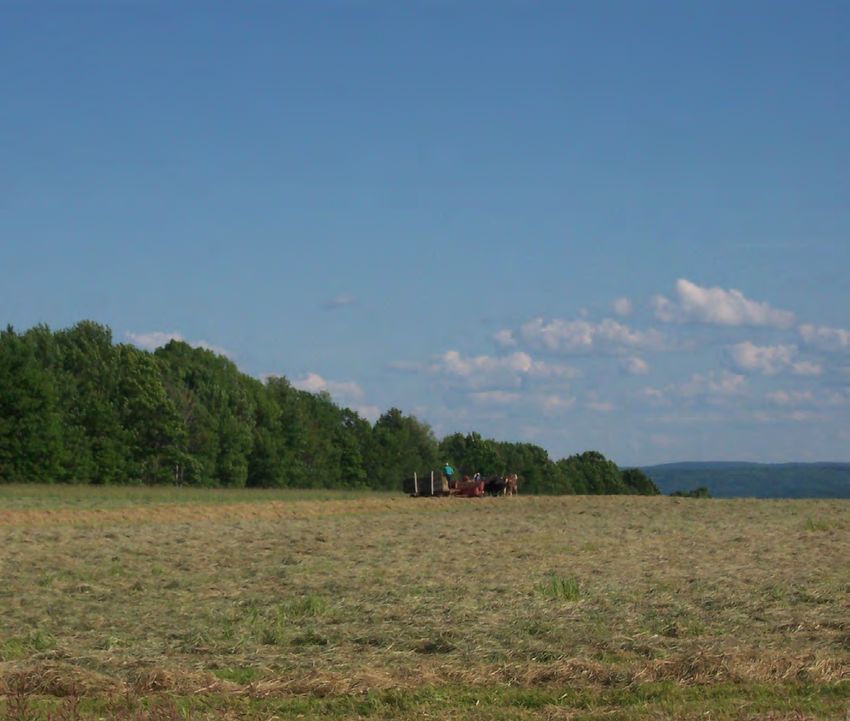
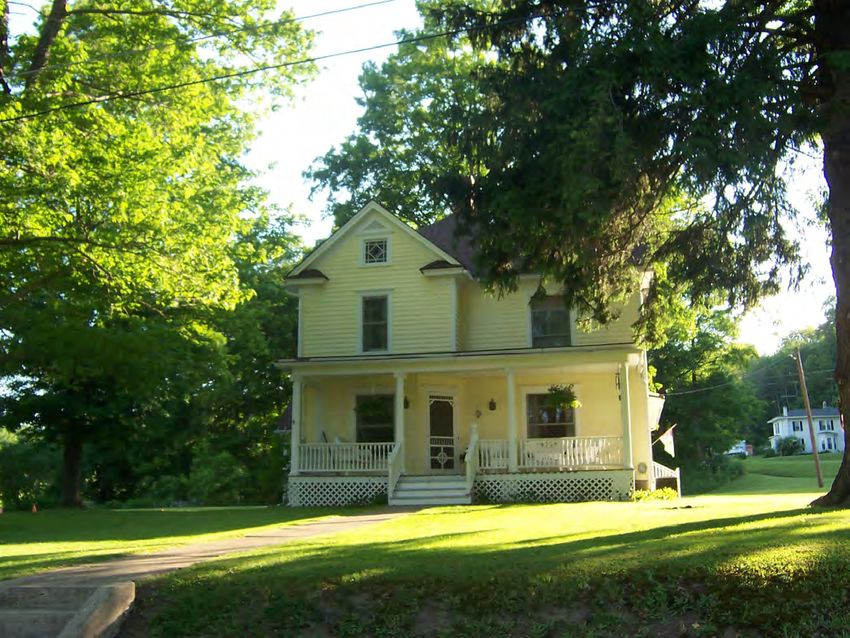
Community Profile
Location                                                                     Town of Hume Location Map
The Town of Hume is located in northern Allegany County, New York.
As the map indicates, the Town is located along the border to Allegany                                       HUME
and Wyoming County. The central business district (CBD) of Fillmore is
still considered the heart of the community. The CBD is situated at the
intersection of NYS Route 19 and NYS Route 19A.

Early History (from Town website)

―Hume was originally part of the territory known as the Town of
Angelica. Nunda was split from that territory on March 11, 1808 and
then further reduced to the Town of Pike on March 3, 1818. Township
6, Range 1 of the Holland Land Grant officially became the Town of
Hume on March 20, 1822. ‗Brooks Gore‘ (Dutch Hill) was later added
in 1846.

In the spring of 1806 at the age of 60 years, Roger Mills of Canajoharie,
Montgomery County came here in search of a mill site. He traveled
from Pike where he had spent the winter. There he hired a man named
Olin for $1.00 to lead him on his quest for land that would be of good
use. Olin lead him through the Wiscoy Valley to the ‗upper falls‘ in Source: www.alleganyco.com
Wiscoy Creek and there is where Roger Mills found the best location for
water power. The following year a dam was built across the creek and a sawmill was erected. In the winter of 1807 castings and stones were
brought from Albany by sleigh by George Mills and Zach Keys. The following year a gristmill was added, the first in the area. Men came from
as far away as Geneseo (40 miles) and were also assisted by the Indians from the nearby Caneadea Reservation, to help in the ‗raising‘ of the
mill. The mill was primitively constructed, its gearing, cog-wheels, etc. made mostly of wood.

In 1809 Elisha Mills sold the first stock of goods from the mill. Part of the mill was also used for housing and it is said that Goodwin Mills was
born there. The mill was also used as a make shift "hotel", for people who had traveled a great distance. They were given a meal provided by
the miller and the use of a sack or bag of grain for bedding. The mill served as the distribution center of mail brought from the nearest Post
Office. The mill served many uses for the early settlers of this area which became known as Mills Mills. And so the growth of the Town of
Hume began…‖

2010 Comprehensive Plan                                                                                                                    Page 9
Population Characteristics
                        Town Population History

                        Population history for the Town was obtained from the County Historian and the US Census Bureau.
                        According to this information, the largest number of residents recorded within Hume was 2,303 in 1840. As
                        shown in Figure 1, the Town‘s population declined steadily until 1940 when it reached 1,577. In the years
                        following World War II, Hume experienced a growth in population that was most likely due to the ―baby
                        boom‖ that was occurring across the country. This increase in population peaked in 1980. Since that time
                        Hume‘s population has decreased to 1,987 residents in the year 2000.

                        Figure 1: Town Population Change 1840 to 2000 (Source: County Historian & US Census)

                                                 2,500
A ccording    to  US
Census estimates, the
                                                 2,000
population of Hume is
                           Number of Residents

expected    to   have
declined by 26 people
                                                 1,500
in 2007.

                                                 1,000

                                                  500

                                                    0

                                                                               Year

Page 10                                                                                                          Town of Hume
Population Characteristics
Age of Population
The graphs shown in Figure 2 illustrate the breakdown of the Town and County population by age group. The
age distribution of Hume is similar to that of the County as a whole. A notable exception is the lower
percentage of school aged children in the Under 19 age group within Hume. The largest population group
within the Town is the 20 to 34 year-olds. This age group represents young men and women that are typically
single, very mobile, and pursuing higher education, serving in the armed forces, or establishing a career. By
comparison, the smallest population group in Hume is the 34 to 54 year-olds. The 34 to 54 year-olds typically
are married, raising a family, and have an established career. People in this group are more likely to have a
family, own a home, and be active members in their community. They are the most productive group in the
workplace and are the least likely to move. Finally, the combined percentage of those people approaching
retirement (55 to 64 year-olds) and those people of retirement age (Over 65) is the second largest portion of
the local population. Hume has a signifi-
cantly higher percent-
Figure 2: Age of Population in 2000 (Source: 2000 US Census) age of young adults (20
to 34 year- olds) than
Town of Hume Allegany County
Allegany County as a
whole.
●
●
Under 19 35 to 54 Year-Olds Over 65
● 20 to 34 Year-Olds 55 to 64 Year-Olds
2010 Comprehensive Plan Page 11Population Characteristics
Shift in Age Groups
According to the information contained in Table 1, Allegany County and Hume saw a significant drop in the
number residents in the 18 to 34 years-old age group between 1990 and 2000. This is a national trend as this
population group is aging and there are not enough births to replace them. Virtually the only communities in
the United States that did not have sizable losses in this population group were those on the coasts and in the
southern United States that attracted in-migration from other states and countries. On the positive side,
Allegany County and Hume now have more 35 to 54 year-olds. This confirms the observation raised by the
Steering Committee that people are moving to the County and the Town to settle down and retire. One of
the most notable discrepancies in the shift in age groups between the Town and County is the over 65 age
group. Hume has experienced a higher percentage of residents entering retirement age over the past decade
compared to the County as a whole. The aging of the Town‘s population is expected to continue over the next
Over the previous ten year period.
decade, the Town has
Table 1: Shift In Age Groups from 1990 to 2000 (Source: US Census)
seen a slight increase in
school aged children. Town of Hume Allegany County
By comparison, the Net Change % Change Net Change % Change
County has seen a
significant decrease. Under 18 +6 +1.1 -918 -7.0
18 to 34 -82 -17.7 -1,929 -13.1
35 to 54 +81 +17.0 +1,918 +16.7
55 to 64 -7 -3.4 +152 +3.4
Over 65 +20 +8.0 +234 +3.5
Total +18 +0.9 -543 -1.1
Median Age 36.1 35.0
Page 12 Town of HumePopulation Characteristics
Educational Attainment
Figure 3 provides a comparison of the educational attainment for the Town, County, and New York Sate. A review of Figure 3 indicates that
Hume and Allegany County have similar education levels. In both the Town and County, over one-half (56%) of all adults have at a high School
diploma or equivalency degree. The most notable discrepancy between the Town and County is the higher percentage of residents without a
high school degree within Hume. A comparison with New York State as a whole indicates that both Hume and Allegany County have a
significantly lower percentage of residents with a Bachelor‘s or Master‘s Degree.
Figure 3: Educational Attainment Comparison (Source: 2000 US Census)
Town of Hume Allegany County New York State
● ● ●
No High School Degree Associate’s Degree Master’s Degree or Higher
● High School Degree Bachelor’s Degree
2010 Comprehensive Plan Page 13Housing Characteristics
Home Ownership
According to the 2000 United States Census (as shown in Table 3), Hume has a relatively high rate of home
ownership with 74% of homes being owner-occupied as compared to the rate for New York State as a whole
which is 53%. Homeownership is a widely-regarded measure of community stability due to the tendency of
owners to invest in their properties and the community. As a result, this plan assumes that these rates are a
strength on which to build. However, this information may also be an indication that there may be limited
rental opportunities within the Town.
Table 2: Home Ownership Rates (Source: US Census)
Owner Occupied Renter Occupied
According to the 2000 Town of Hume 74.0% 26.0%
Census, Hume has 886 Average for towns in Allegany County 73.8% 26.2%
housing units with an
occupancy rate of
nearly 87%.
Page 14 Town of HumeHousing Characteristics Residential Building Activity Residential permit data collected by www.city-data.com for the Town of Hume is shown in Figure 4. As the graph indicates, Hume has issued a total of 38 permits for new homes from 1998 to 2008. Based upon this information and on existing population estimates, this Comprehensive Plan assumes that there will be limited residential construction necessary to accommodate new residents moving into the community over the next decade. Figure 4 also contains the average cost of new home construction based upon the permits issued. A review of these average costs of new homes in Hume do not indicate any discernible pattern or trend. Figure 4: Single Family Building Permits Issued Between 1998 to 2008 (Source: Town of Hume) NOTES: Average cost of new home construction is shown above the bar Source of data - www.city-data.com/city/Hume-New-York.html 2010 Comprehensive Plan Page 15
Property Characteristics
Property Value

There are a number of factors that affect     Table 3: Change In Property Values 2000 to 2007 (Source: NYS Comptroller)
property values within a community.                                     % Change In        % Change In    Did Assessments Keep
Communities with higher property values       Municipality           Property Values   Adjusted Dollars     Up With Inflation
typically have good schools, safe             Town of Allen                    29.2%               7.3%            Yes
neighborhoods, well maintained homes          Town of Genesee                  24.0%               3.0%            Yes
and provide convenient access to work         Town of Clarksville              20.9%               0.4%            Yes
and services. As a result, the property       Town of Caneadea                 19.2%              -1.0%            No
values within a town or village reflect the   Town of Wirt                     18.9%              -1.2%            No
overall quality of life enjoyed by its        Town of Scio                     18.7%              -1.4%            No
residents. By tracking the changes in         Town of Friendship               18.0%              -2.0%            No
property values, towns and villages can       Town of West Almond              16.6%              -3.2%            No
determine if these factors are                Town of Bolivar                  16.1%              -3.6%            No
contributing to or detracting from the        Town of Cuba                     15.7%              -3.9%            No
community.                                    Town of Rushford                 15.0%              -4.5%            No
                                              Town of Belfast                  14.8%              -4.6%            No
Table 3 contains the percent change in        Town of Centerville              13.9%              -5.4%            No
property values for the towns located in      Town of Amity                    13.7%              -5.5%            No
Allegany County. The table has the actual     Town of Burns                    12.8%              -6.3%            No
percentage change as well as the percent      Town of Angelica                 12.6%              -6.5%            No
                                              Town of Birdsall                 12.6%              -6.5%            No
change after it has been adjusted for
                                              Town of Independence             12.4%              -6.6%            No
inflation. A review of this information
                                              Town of Granger                  12.2%              -6.8%            No
indicates that the growth in property
                                              Town of Hume                     11.1%              -7.8%            No
values within the County has generally
                                              Town of Willing                  11.0%              -7.8%            No
not kept pace in inflation. Between 2000
                                              Town of New Hudson               11.0%              -7.8%            No
and 2007, 26 of the 29 towns located
                                              Town of Alfred                   10.7%              -8.1%            No
within Allegany County have experienced
                                              Town of Almond                    9.3%              -9.2%            No
a decline in property values. Hume was                                                                             No
                                              Town of Grove                     7.7%             -10.5%
among those 26 communities. As a result,      Town of Ward                      7.3%             -10.9%            No
the Comprehensive Plan should                 Town of Alma                      4.1%             -13.5%            No
incorporate policies and objectives that      Town of Andover                   1.2%             -16.0%            No
foster a growth in property values within     Town of Wellsville               -0.8%             -17.6%            No
the community.

Page 16                                                                                                          Town of Hume
Economic Characteristics
Family Income & Poverty
Family income is a traditional indicator Table 4: Median Family Income Comparison 1989 to 1999 (Source: US Census)
of the quality of employment that Median Family 1989 Dollars Median Family Did Incomes Keep Up
individuals are able to find, their relative Municipality Income in 1989 Adjusted to 1999 Income in 1999 With Inflation?
well-being, and their potential for Town of Alfred $41,026 $55,120 $57,159 Yes
investing in their property and Town of Almond $33,405 $44,881 $48,839 Yes
community. As shown in Table 4, Hume Town of Grove $34,821 $46,784 $48,594 Yes
has a median family income of $37,366 Town of Genesee $29,635 $39,816 $44,100 Yes
according the 2000 Census. This is Town of Ward $30,714 $41,266 $41,000 No
slightly less than the County‘s median Town of Amity $30,408 $40,855 $40,387 No
family income level of $38,580 and Town of Andover $28,287 $38,005 $40,341 Yes
$25,547 $40,000 Yes
significantly less than New York State‘s Town of Belfast $34,324
Town of Willing $31,471 $42,283 $39,737 No
level of $51,691. However, Hume was Town of Wellsville $28,736 $38,608 $39,705 Yes
one of 13 Towns that experienced an Town fo Caneadea $28,750 $38,627 $39,667 Yes
increase in their median family income Town of Bolivar $25,114 $33,742 $38,750 Yes
that kept pace with inflation from 1989 Town of West Almond $29,375 $39,467 $38,750 No
to 1999. Town of Scio $29,022 $38,993 $38,250 No
Town of Cuba $28,668 $38,517 $37,969 No
A review of the persons living in poverty Town of Angelica $22,423 $30,126 $37,891 Yes
identified as part of the 2000 Census Town of Hume $27,500 $36,948 $37,366 Yes
was conducted as part of this Town of Burns $29,750 $39,971 $37,054 No
Town of Independence $25,568 $34,352 $36,050 Yes
community profile. According to that
Town of Alma $23,967 $32,201 $35,833 Yes
information, the Town has a higher Town of Clarksville $28,043 $37,677 $35,000 No
percentage of persons living in poverty Town of New Hudson $22,031 $29,600 $34,702 Yes
than the County and the State. The Town of Friendship $22,952 $30,837 $33,542 Yes
exact numbers are provided below: Town of Wirt $24,500 $32,917 $32,222 No
Town of Birdsall $21,875 $29,390 $31,250 Yes
New York State = 14.6% Town of Centerville $23,750 $31,909 $31,058 No
Allegany County = 15.5% Town of Rushford $24,917 $33,477 $30,938 No
Town of Hume = 17.2% Town of Allen $27,045 $36,336 $29,688 No
Town of Granger $26,250 $35,268 $28,056 No
2010 Comprehensive Plan Page 17Economic Base
Employment By Industry
According to the most recent census, there are 814 workers living in Hume. Figure 5 shows the type of occupation in which these workers are
employed. It should be noted that some of these jobs are located outside the community (see Figure 6 for more information). A majority of
workers in Hume are employed in management, professional, and related fields. This sector employs a total of 215 Town residents.
Figure 5: Employment By Industry in 2000 (Source: US Census)
Production, transportation, &
material moving
Construction, extraction, &
maintenance
Occupations
Farming, fishing, & forestry
Total
Male
Sales & office Female
Service
Management, professional, &
related fields
0 50 100 150 200 250
Number of Workers
Page 18 Town of HumeEconomic Base
Place of Work
According to the 2000 Census data illustrated in Figure 6, nearly 57% of local workers were employed within the Allegany County. Meanwhile,
nearly 36% of workers were employed within the Town. In addition, the most recent census indicates that 35% of local workers travel time to
work is less than 14 minutes for Hume commuters and the average travel time to work was 29.5 minutes.
Figure 6: Place of Work in 2000 (Source: US Census)
Worked outside of New York State
Place of Work
Worked outside of Allegany County
Worked in Allegany County
Worked in New York State
0 100 200 300 400 500 600 700 800 900
Number of Workers
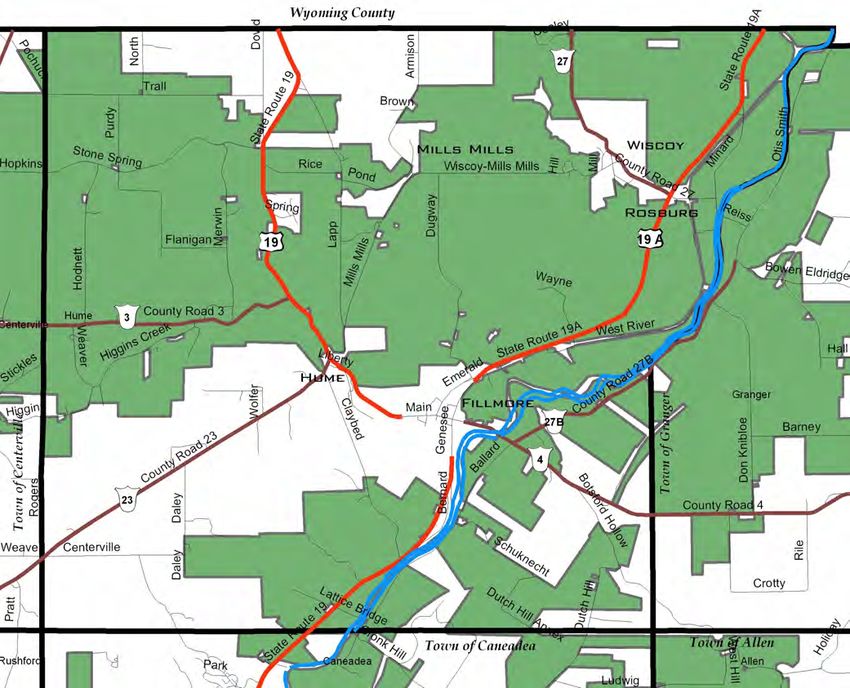
2010 Comprehensive Plan Page 19Transportation Network
Existing Road Network
The primary travel routes
within Hume are NYS State
Route 19 and 19A. These
roads accommodate north/
south travel across the Town.
There are six county roads
within the Town. These
include County Road 3, 4, 23,
27, 27B and 36. Together
these state and county
facilities form the backbone of
Hume‘s transportation system.
Figure 7 shows the locations
of the major Town, County,
and State Roads within the
Town. Sidewalks are
concentrated within the
hamlet of Fillmore.
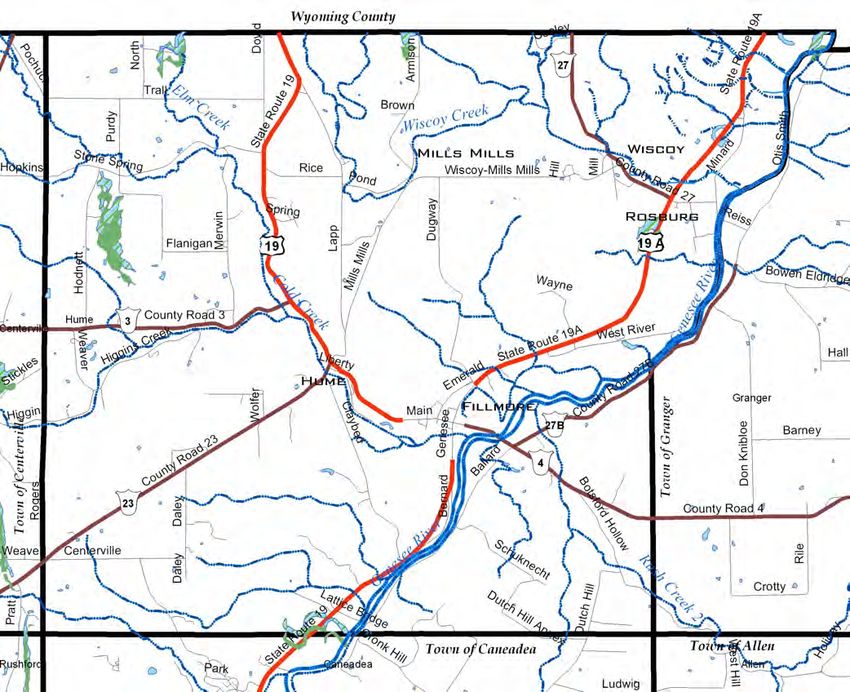
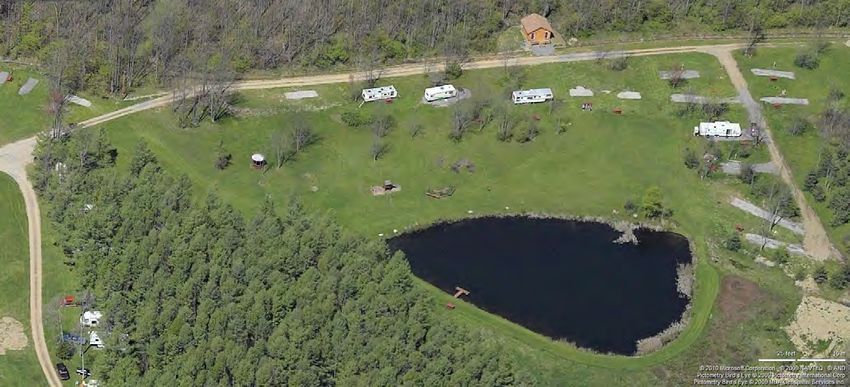
Recreation & Tourism
Facilities
Figure 8, on the opposite page
i d e nt if i e s t h e e x i st i ng
recreation and tourism
facilities located within Hume.
The two most notable include
the Genesee Valley Greenway
and the Finger Lakes Trail.
Figure 7: Existing Street & Highway Network
Page 20 Town of HumeRecreation & Tourism Figure 8: Recreation & Tourism Facilities 2010 Comprehensive Plan Page 21
Water & Sewer Service
Water & Sewer Service Summary
The current limits of the public water and sewer systems available in Hume are shown in Figure 9. The public
water system is owned and operated by the Town. In 2007, the Town consolidated Water Service Districts
1A, 1B, 2, and 3 into a single consolidated district. As shown in the Water and Sewer Service Map, the extent
of the public water service within Hume is generally located as follows:
Along County Road 3, east of Merwin Road past Cold Creek;
Along NYS Route 19, from CR 3, through the hamlets of Hume and Fillmore;
Along CR 4, from Fillmore to the Genesee River;
The location and Along NYS Route 19A from Caneadea to Wyoming County line; and
Along CR 279 and the Genesee River.
intensity of growth
within the Town is The sanitary sewer service area is also operated by the Town. In July, 2008 a study was completed to evaluate
dependent on the the feasibility and costs associated with the consolidation of the municipal wastewater treatment systems for
availability of public the Towns of Hume and Caneadea. According to that study, ―The Town of Hume‘s wastewater collection
drinking water and system was built as a grey water system, with each sanitary service having an individual septic tank. The
sanitary sewer service purpose of each septic tank is to provide primary treatment, i.e. primary settling and anaerobic digestion of
to accommodate new accumulated solids. The septic tanks discharge into small diameter interceptors which convey the primary
development. treated wastewater to a pump station located in the northeastern part of Fillmore off Route 19A. The pump
station transports the primary treated wastewater to the wastewater treatment facility (WWTP) located north
of the Fillmore west of Route 19A.‖
The existing sanitary sewer service within Hume generally consists of the former Village limits of Fillmore. The
recent sewer evaluation confirmed that the existing sewer system has the capacity to service an additional 60
residential units within Fillmore.
Page 22 Town of HumeWater & Sewer Service
Figure 9: Water & Sewer Service Map
Generalized Sewer
Service Boundary
2010 Comprehensive Plan Page 23Natural Gas Transmission System
Natural Gas
Figure 10 shows the location
of the existing natural gas
supply lines (in blue) as well as
the local distribution lines (in
yellow). The local distribution
company of natural gas within
Hume is the Fillmore Gas
Company. The company
responsible for supplying
natural gas is Dominion
Transmission Inc. According
to their website, ―Dominion
operates one of the largest
underground natural gas
storage systems in the United
States with links to other
major pipelines and to markets
in the Midwest, Mid-Atlantic
and Northeast regions of the
United States. We maintain
7,800 miles of pipeline in six
states — Ohio, West Virginia,
Pennsylvania, New York,
Maryland and Virginia. We
store and transport large
quantities of natural gas for
large customers, such as major
utilities and power plants.‖
Figure 10: Natural Gas Transmission Map
Page 24 Town of HumeAgricultural Resources
Agricultural District One
Farming and agricultural
related businesses remain one
of the Town‘s primary
business sectors. According to
the 2002 Census of
Agriculture, there are a total
of 83 active farms within the
14735 zip code. Out of the 83
farms, 71 reported that the
primary operated lived on the
farm.
The green area on Figure 11
shows the extent of County
Adopted Agricultural District
(#1) within Hume.
Figure 11: Agricultural District Map
2010 Comprehensive Plan Page 25Natural Resources
Wetlands
In 1975, New York State,
recognizing the value of
wetlands and the advantages
to their preservation, passed
the Freshwater Wetlands Act.
This Act requires the
protection of all wetlands of
12.4 acres or more in size.
New York State Department
of Environmental
Conservation (NYSDEC), as
the enforcement agency for
this legislation, has mapped all
wetlands in the state that
meet the minimum size
requirements. Figure 11 shows
the regulated wetlands that
have been identified in the
Town of Hume. Additionally,
federally regulated wetlands
not categorized by the DEC
also exist in the Town and are
shown on the map.
Figure 12: State & Federal Wetlands
Page 26 Town of HumeNatural Resources
Floodplains
Hydrologic studies have made
it possible to mathematically
calculate or model watersheds
based on topography, soil
characteristics, rainfall data,
watershed areas, etc. and to
determine a probability factor
for flooding occurrences at
various stream flows. For
example, a ―100-year flood‖ is
a calculated flow that has a
one percent (1%) chance of
occurring in any year, and a
―10-year flood‖ has a ten
percent (10%) chance of
occurring in any year. Under
normal conditions, stream
flows are contained within an
existing channel. During
periods of heavy precipitation
and/or excessive storm runoff,
increases in flows can exceed
the capacity of the channel,
also know as the floodway,
and cover adjacent lands. The
location of the 100 year flood
plain and the floodways in
Hume are shown on Figure
13.
Figure 13: Floodplains
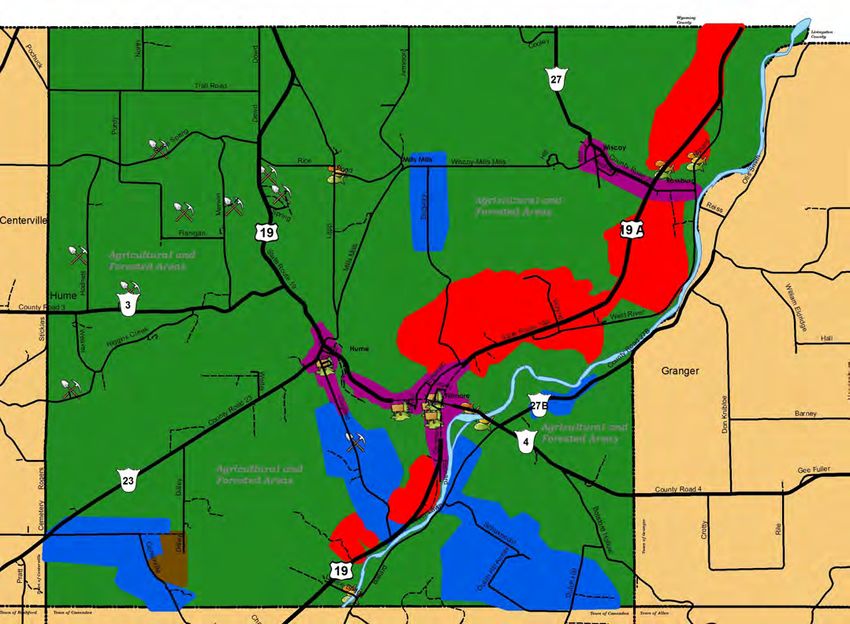
2010 Comprehensive Plan Page 27Existing Land Use
Existing Land Use
Table 5 contains a breakdown of the various land uses within the Town and Figure 14 shows their location.
The table and map were developed using the land use codes from the Town‘s property information file. This
file is maintained by the Town‘s property assessor who assigns each parcel within the Town one of nine New
York State land use classifications, each with a three-digit code.
The Town of Hume has always been a rural community and it is reflected in its existing land use pattern. As
indicted in Table 5, over 50% of the Town‘s land area is being used for agricultural purposes. The second
largest use category is residential (covering 14%) and vacant land is third (occupying 10%). A review of the
Existing Land Use Map indicates that agricultural uses are dispersed throughout the Town. A significant portion
of the Town‘s commercial land uses are spread along NYS Routes 19 and 19A, or clustered in downtown
Fillmore. It should also be noted that Hume has a large amount of Sate Forest Land, occupying over 930 acres.
Approximately 81% of
the Town’s population Table 5: Existing Land Use Breakdown (Source: Town of Hume)
% of Town’s
is located within the
Land Use Category Acres Total Land Area
three hamlets; Fillmore, Agricultural 22,002 53.2%
Hume, and Wiscoy- Undefined 6,407 15.5%
Rossburg. Residential 5,733 13.9%
Vacant 4,011 9.7%
Government, Non-Profits 1,851 4.5%
Forest & Conservation 931 2.3%
Commercial 180 0.4%
Golf, Drive-Ins, Other Entertainment 110 0.3%
Utilities 84 0.2%
Industry 10 0.0%
Total 41,319 100%
Page 28 Town of HumeExisting Land Use
Figure 14: Existing Land Use Map
Wiscoy
Mills Mills
Rossburg
Hume
Fillmore
2010 Comprehensive Plan Page 29Implications
It is clear from the community survey conducted in 2003, and the brainstorming results from 2009 that the
priorities of Hume have remained constant over time and that the Comprehensive Plan should focus on the
following issues:
Enhancing and strengthening the traditional character of the hamlets;
Preserving the Town‘s rural landscape;
Maintaining the ―small town atmosphere‖ that residents enjoy;
Protecting the environmental features of the community; specifically the Genesee River;
Providing quality community services at a reasonable cost;
Creating a wider range of residential living opportunities, especially for senior citizens;
Fostering a more vibrant local economy; and
Continuing to seek partnerships between the Town and with other regional entities.
Prediction is very These key issues will form the basis of the community‘s vision and policy areas within the Comprehensive Plan.
difficult, especially The information contained within the Community Profile will help to formulate the plan‘s objectives.
about the future.
~ Niels Bohr
Page 30 Town of HumePolicy Framework
Policy Framework
In order to be successful, a Comprehensive Plan must be developed and implemented on multiple levels. It must address the short and long
term needs of a community as well as provide varying levels of detail. In an effort to accomplish this, this plan has four key elements:
Vision: A general statement that describes the aspiration of the Town; it is an end towards which all actions are aimed. The Vision should not
dramatically change over time but rather be consistent throughout the planning horizon. Ideally, the Vision contained in this plan should be
useful for the 10-year planning horizon.
Policy: Similar to a vision in that it is a general statement of a future condition towards which actions are aimed. However, the scope of a
policy is much more narrow. It should support the vision by addressing a particular area or issue facing the community. Policies should not
dramatically change over time but rather be consistent throughout the planning horizon. Ideally, the policies contained in this plan should be
useful for the 10-year planning horizon.
Objective: A statement of a measurable activity to be accomplished in pursuit of the policy; it refers to some specific aspiration which is
reasonably attainable. Think in terms of actions such as ―increase‖, ―develop‖, or ―preserve‖. It should be noted that the Town may already be
undertaking some of the objectives articulated in this plan and wish to ensure that they continue to do so over the next decade. The general
lifespan of an objective is 6 to 10 years.
Implementation Items: A specific proposal to do something that relates directly to accomplishing a strategy; it can take the form of a plan,
project, or program. The lifespan of an implementation item can vary from one to 10 years depending on the item. The implementation items
are organized into tables. The purpose of each table is to:
Identify action items that could be pursued to achieve each strategy;
Designate the importance or priority of each action item to the community. Community Priority categories are defined as Low, Medium,
or High;
Provide a reasonable cost estimate for the plan, program, or project; and
Identify potential partners that could assist in the successful implementation of each item.
It should be noted that the implementation tables are a guide. It is reasonable to assume that opportunities may arise to complete some items
within the planning horizon. On the other hand, due to unforeseen circumstances, some projects may be delayed. It should also be noted that
the cost estimates provided for capital projects assume that no local participation is provided by the DPW or other Town departments in the
completion of the scope of work. As a result, these cost estimates represent a ―worst case scenario.‖ Additional details associated with the
cost of the capital projects identified in this plan are contained in the Appendix.
2010 Comprehensive Plan Page 31Our Community Vision
“Begin with the end in
mind.”
~ S. Covey
Page 32 Town of HumeOur Community Vision It is the vision of Hume to remain a small town known for its rural vistas and thriving hamlets. Residents enjoy a variety of living options including country homesteads or the more densely populated neighborhoods in the hamlets. The Town and its partners provide quality community resources that serve to improve the quality of life in the community and make Hume an attractive place to grow-up, work, raise a family, and retire. The community takes pride in its farming heritage and cares about its natural resources as evidenced by its efforts to preserve its rural environment. The Town will achieve this vision by engaging its residents, capitalizing on its assets, and ensuring future public and private investments are developed in a manner that enhances the character of our hometown. 2010 Comprehensive Plan Page 33
Residential Living

Since   1980, Hume’s
population           has
decreased from 2,040
to 1,987 residents in the
year 2000.

Page 34                     Town of Hume
Residential Living

Residential Living Policy Statement

It is the policy of the Town to have neighborhoods and residential living opportunities that are safe, attractive and foster an active lifestyle. In
the hamlets, the Town will focus their efforts on preserving the quality and character of existing neighborhoods while developing new
neighborhoods that reflect a more traditional development pattern. Outside of the hamlets, future residential development will be located in a
manner that efficiently uses available infrastructure capacity, while minimizing the loss of high quality farmland and avoiding environmentally
sensitive areas. Over the next decade, Hume will strive to have a combination of housing types available to residents of various ages, incomes,
and family structures.

Objectives

A. Preserve existing property values.
B. Increase the variety of living options available, with an emphasis on senior housing.
C. Encourage a dense living pattern within and immediately adjacent to the hamlets.

Measures

1.   Number of seniors (over 65) living in the community.
2.   Change in residential property values.
3.   Number of new housing lots by size (¼ acre, ½ acre, etc) and location (in or adjacent to the hamlets, in an Agricultural district, etc).
4.   Number of property code violations or complaints filed for residential properties.

2010 Comprehensive Plan                                                                                                                    Page 35
Residential Living

A. Preserve existing property values.

One of the primary factors that determines the value of housing in a given area is the overall economic health and desirability of the region in
which it is situated. A review of many of the most stable and expensive housing markets in the nation reveals that their regional economy is
also thriving. This can be seen in the housing values in and around Fort Collins CO, and Saratoga Springs NY. However, a review of the
property values within Allegany County (contained in Table 3 on page 12) indicates that Hume is situated within a region that is struggling to
preserve its property values. The Town should work with the County and its other regional partners to foster a quality of life that results in
stable or rising property values.

On a local level, the presence of junk stored on properties throughout the Town was seen as a key issue that should be addressed over the
next decade. The Town should do more to facilitate the removal of large junk items, sponsoring more pick-up days, and publicizing them more
aggressively. It may be appropriate to charge a nominal fee for this service (five dollars per stop, perhaps). The Town should also continue to
have public officials tour the Town periodically to enforce existing junk rules. The Town should no longer rely solely on neighbors turning in
neighbors, but should take this responsibility on itself. Finally, the Town should investigate the possibility of a tire pick-up and recycling
program. This may even be a possible opportunity for the Town to encourage a local enterprise that would draw business from the
surrounding area.

B. Increase the variety of living options available, with an emphasis on senior housing.

Throughout the public input process used to develop this Plan, it was made clear that the Town should work toward the development of an
assisted-living facility. Town residents do not want to see the Town act as a developer, but they are strongly convinced of the need for such a
facility, and would like the Town to pursue all means short of acting as a developer (e.g. identifying developers, offering incentives to
developers, etc) to get such a facility built. All the committee's research suggests that there is adequate demand to justify such a facility.
Residents are not interested in a high level of assistance, but in a low level that would enable reasonably healthy senior citizens to remain in the
Town past the point where home ownership becomes an excessive burden for them. Rent assistance and groundskeeping are the main forms
of assistance for which there is a strong public demand. Those in attendance at the public meetings were clear about their preferred location
for such a facility: downtown Fillmore. They stressed repeatedly how important it is for residents of such a facility to be able to walk to the
post office, the grocery store, etc. There are several potential sites that fit these criteria.

Page 36                                                                                                                           Town of Hume
Residential Living

C. Encourage a dense living pattern within and immediately adjacent to the hamlets.

As new residents choose Hume as a place to live and raise a family, there will be a need for new housing units within the community. How this
demand for housing is accommodated will directly impact the existing small town character that residents enjoy. Throughout the public input
process there has been a consistent desire expressed by both the Steering Committee members and the attendees of the various workshops
to continue the traditional residential development pattern with smaller lots within and adjacent to the hamlets and more rural living elsewhere
in the Town as depicted on the Future Land Use Map.

The recommended housing density within and immediately adjacent to the hamlets should be a maximum of a one unit per ½ acre lot, also
referred to as two units per acre. However, higher densities ranging from three to four units per acre would also be appropriate. These
densities are consistent with the existing settlement pattern within the hamlets of Fillmore, Hume, and Wiscoy-Rossburg. Opportunities for
even greater housing densities should be facilitated in the form of apartments or townhomes that are typically 6 to 12 units per acre.

The benefits of expanding outward from an existing hamlet or village center have been well              Alternative Septic Tank Layout
documented. One such benefit includes enhancing the character of the hamlet by creating dense,
walkable neighborhoods. These dense neighborhoods maximize the number of households that can
be accommodated within the available land area, thus reducing the need to build houses on one,
two, or five acre lots within the Town. As a result, the development pressure on Hume‘s farmland
and open space will remain low.

The preferred level of residential density within the hamlets can best be achieved with access to
public drinking water and sewer service. Water service is currently provided by the Town within
the hamlets of Fillmore and Hume (as discussed on pages 18 and 19). However, the only available
sewer service is within Fillmore. As a result, the Town would need to extend sewer service to
Hume and water and sewer service to Wiscoy-Rossburg. It is unlikely that Wiscoy-Rossburg will be
serviced with public water and sewer within the planning horizon. As a result, alternative methods
of waste disposal should be investigated to accommodate increased residential densities. One such
method is to locate individual septic systems within open space or common areas as shown to the
right. According to Randall Arendt, ―There is no engineering reason to require that septic filter
beds must be located within each houselot. However, it is essential that the final approved
subdivision plan clearly indicate which parts of the undivided open space are designated for septic
disposal, with each lot‘s disposal area graphically indicated through dotted lines extending out into   Source: Randall Arendt

the conservation land.‖

2010 Comprehensive Plan                                                                                                                 Page 37
Residential Living
Residential Living Action Plan
Potential Community Cost Estimate Potential
Implementation Item Priority Or Range Partners
1) Provide incentives to property owners to remove refuse High $0 -$5K Waste haulers, local residents
2) Enforce junk storage laws Medium $0 - $10K Town Attorney, CEO
3) Pursue the development of an assisted living facility Medium County, Rural Development
Solicit potential developers $0 - $2.5K Local leaders
Pursue State & Federal funding assistance $10 - $15K Grant writer
Project design & approvals $50 - 100K Civil engineer & architectural firms
Complete construction $1 to 5M Construction services company
4) Work with Allegany County Office for the Aging to identify Medium None County
other aging in place initiatives
5) Restrict connections to public sewer service to smaller lots Low None DPW, Town Engineer, Town
Attorney
Page 38 Town of HumeResidential Living This page may be intentionally left blank. 2010 Comprehensive Plan Page 39
Community Resources

A   community resource
is broadly defined as
any program, service,
or infrastructure that
positively contributes to
the Town’s quality of
life.

Page 40                     Town of Hume
Community Resources

Community Resources Policy Statement

It is the policy of the Town to have community resources that provide a high level of service to the local businesses and residents at a
reasonable cost. The quality of life within Hume is positively impacted by the health and safety benefits provided by law enforcement and
emergency service providers, as well as public water and sewer service (in certain areas). The community‘s well being is ensured by the
combined efforts of the school district, the library, the faith community, and public recreation facilities. As the population characteristics change
within the community, it is imperative that the community resources continue to meet the needs of Town residents.

Objectives

A. Provide quality delivery of services necessary to ensure the health, safety, and welfare of residents.
B. Enhance recreation and leisure activities within the Town.
C. Expand the number of volunteers in the community.

Measures

1. Crime rate or number of calls for assistance.
2. Number of volunteers on local boards, committees, fire department, etc.
3. Number of recreation programs (Town, school, etc) that serve the local young people and senior population.

2010 Comprehensive Plan                                                                                                                     Page 41
Community Resources

A. Provide quality delivery of services necessary to ensure the health, safety, and welfare of residents.

The health, safety, and welfare needs of a community continually change over time for a variety of reasons. It could be the result of an increase
in population or a shift in demographics such as an aging population. Sometimes the needs change due to emerging interests such as the
growing participation of young people in soccer around the region and the nation. The Town and its partners will have to monitor the
community‘s requirements and respond accordingly. The public input process used to develop this plan indicated that two areas of concern for
residents include emergency medical services and law enforcement.

Emergency Medical Services (EMS) - The Town should find out how many calls within the community are being answered by out-of-town
personnel, and whether this is a problem for the Town of Hume only, or one for the county as a whole. If the problem is significant, and
particular to the Town, Hume should institute incentives for EMS volunteers. Retirement benefits or tax breaks were popular suggestions in
discussions of this issue. If such incentives do not produce enough volunteers, the Town should consider a part-time (weekday) paid service to
supplement the volunteer service. If EMS availability problems are countywide, the Town should lobby the county to establish a centralized,
county-wide service.

Law Enforcement - Community policing, like sidewalks, is an area in which residents are willing to see the Town invest directly and significantly
with public funds. Residents especially want to see speeding checked by consistent law enforcement, although they have other concerns as well
(e.g., good order at all hours around local bars) The Town should explore each of the following options, with the aim of, one way or another,
reestablishing a substantial local police presence: a contract for services with the county sheriff s office; a paid constable; a citizens' patrol.

Unimproved Roads - An unimproved road can be described as one that is surfaced using dirt or gravel. There are just over 50 miles of roads
within the Town; approximately 6½ miles remain unimproved. The process of improving the roads consists of putting down a layer of cold mix
paving to provide a more durable surface for driving and snow plowing. Over the next decade the Town will continue to upgrade one to two
miles of these roads on an annual basis.

Water & Sewer System Improvements - The Town‘s existing sanitary sewer system is nearing its capacity. In addition, the lack of water or sewer
service in densely populated areas like Wiscoy-Rossburg create a potential hazard to public health. As a result, the Steering Committee
identified the improvements to its public water and sewer system as a high priority. The has completed several evaluations of the existing
systems and have identified potential solutions with the assistance of the Town Engineer. Hume and its leaders will continue their efforts to
fund and implement these solutions over the planning horizon.

Page 42                                                                                                                          Town of Hume
Community Resources
B. Enhance recreation and leisure activities within the Town.
Over the next decade, the Town should invest in improved and expanded parks and trails, considering among other possibilities a skating rink
(possibly doubling as a wading pool), a public pool, a trail linking Fillmore and Hume, a significant redesign of the Fillmore park, and a new park
on the outskirts of Fillmore, one that could serve as an area resource for sports tournaments.
Genesee Valley Greenway
One of the primary recreational opportunities within Hume is the completion of the Genesee
Valley Greenway. (A map of the Greenway is shown to the right.) According to the Friends of the
Genesee Valley Greenway‘s website, ―The Genesee Valley Greenway is one of hundreds of
greenways being developed across the nation along old canals, abandoned rail beds, and riverbanks.
It passes through scenic woodlands, river and stream valleys, rolling farmlands, steep gorges, and
historic villages located in sixteen towns in Monroe, Livingston, Wyoming, Allegany, and
Cattaraugus counties in New York State. The trail makes use of the canal tow path and the rail bed
and when completed will be 90 miles long and pass through 5 counties. About 60 miles of trail are
now open, mostly between Rochester and Letchworth Park.‖
Within the Town of Hume, there are a number of capital investments that need to be made in
order to make the Greenway Trail more usable. These include:
Replacing a bridge that has been removed in Fillmore over Cold Creek
Replacing a bridge that has been removed in Rossburg over Wiscoy Creek
Replacing two culverts that have been removed south of Fillmore
Restoring approximately 1,000 feet of abandoned rail bed that now serves as a trail segment
and has been eroded by the Genesee River north of Fillmore
Determining if a former grade separated crossing (that has been removed) should be replaced
or is an at-grade crossing on NYS Route 19A appropriate.
In order to be successful, the Town will need to partner with various organizations to design, fund
and complete these improvements.
Source: www.fogvg.org
2010 Comprehensive Plan Page 43Community Resources
C. Expand the number of volunteers in the community.
―The volunteer fire company, an institution that dates to Ben Franklin, is slowly going the way of the horse-drawn pumper. Blame it on the
changes in society: longer commutes, two-income households, year-round youth sports, chain stores that won't release workers at midday to
jump on a firetruck. Blame it on new folks in town who don't even know the department is volunteer. Blame it on stricter training
requirements and fewer big fires and the lure of paying fire jobs in the cities. The kinds of volunteers who used to be able to cover weekday
calls — farmers, shop owners, factory shift workers — are becoming as rare as a firehouse Dalmatian. But even though emergency calls are up,
the number of volunteer firefighters has dropped nationally more than 10% over the past two decades. The decline is particularly steep in the
Northeast. Pennsylvania, which had about 300,000 volunteers three decades ago, is down to 72,000. New York state, which had 140,000 15
years ago, now has 96,000.‖ ~ USA Today - November, 2005
The declining interest in volunteering is spreading beyond firefighting into other facets of communities across the country. Community
organizations are struggling to maintain the membership levels necessary to meet their operational needs. A smaller percentage of the local
population are volunteering. In areas of the country that are experiencing a rapid increase in population such as the southeast and southwest,
the smaller percentage of volunteers is offset by the sheer numbers of new residents moving into the community. In the northeast, the smaller
percentage of volunteers is combined with little or no population growth and is resulting in a significant loss of volunteer resources in
communities similar to Hume.
In order to ensure that the staffing levels of existing community resources are adequate, the Town and local service providers will have to
actively recruit new volunteers into the various organizations on an ongoing basis as well as consider merging services with neighboring
municipalities. The community should have a recruitment strategy that includes:
Educating potential volunteers on the mission and importance of the various local community organizations. A public outreach program
within the community must be developed and maintained. This campaign should include the school system.
Asking for volunteers. This should be a combination of an ongoing recruitment effort as well as more focused membership drives.
Maintaining a volunteer database. Every volunteer should be entered into a database in order to facilitate matching a volunteer with an
appropriate activity.
Having jobs ready for volunteers to do. If volunteers are not called upon in a timely manner, it sends the message that the organization
does not really need or is ready for any assistance.
Recognizing volunteers for service.
In order to maximize resources, consideration should be given to having a single point of first contact for all community organizations; perhaps
a welcome packet for new residents that identifies volunteer opportunities or an annual recruitment day.
Page 44 Town of HumeYou can also read