Transportation Revenue Forecast Council - September 2021 Transportation Economic and Revenue Forecasts Volume I: Summary - Office of Financial ...
←
→
Page content transcription
If your browser does not render page correctly, please read the page content below
Transportation Revenue Forecast Council

             September 2021 Transportation Economic
                    and Revenue Forecasts

                       Volume I: Summary

Adopted                        1                 September 22, 2021
Washington Transportation
Economic and Revenue Forecast
September 2021 Forecast

Summary Report (Volume I)
 Forecast Overview                                                           3
 Economic Variables Forecast                                                13
 Motor Fuel Price Forecast                                                  14
 Motor Vehicle Fuel Tax Forecast                                            18
 Motor Vehicle Revenue (Licenses, Permits and Fees)                         19
 Driver Related Revenues Forecasts                                          21
 Other Transportation Related Revenue Forecasts                             21
 Ferry Ridership and Revenue                                                23
 Toll Revenue                                                               25
 Highway Federal Funds Revenue                                              40
 Public Transportation Federal Funds Revenue                                42
 Washington State Ferries Federal Funds Revenue                             43
 Forecast Contacts                                                          45
 Appendix                                                                   46
   Tracking Table of Revenues/Expenditures in HB 2042                       47

Forecast Tables (Volume II)
 Motor Vehicle Fuel                                                          3
 Motor Vehicle Related Revenue Forecast (Licenses, Permits and Fees)        24
 Driver Related Revenue Forecasts                                           44
 Other Transportation Related Revenue Forecasts                             54
   Vehicle Sales and Use Tax                                                54
   Rental Car Tax                                                           54
   Business and Other Revenue                                               54
   Aeronautics Taxes and Fees                                               54
 Washington State Ferries Ridership and Revenue Forecast                    63
 Toll Operations and Revenue Forecasts                                      69
 Federal Funds Forecast                                                     85

Alternate Forecast Scenarios (Volume III)
Alternative Ferry Forecast                                                  3
Alternative Vehicle Miles Traveled Forecast                                13
Alternative Federal Highway Forecast                                       17

Adopted                                          2                     September 22, 2021
Preface
Washington law mandates the preparation, adoption of economic, and revenue forecasts. The organizations primarily
responsible for revenue forecasts are the Economic and Revenue Forecast Council and the Office of Financial
Management. The Office of Financial Management has the statutory responsibility to prepare and adopt those forecasts
not made by the Economic and Revenue Forecast Council (RCW 43.88.020). The Office of Financial Management carries
out its forecast responsibilities for transportation revenues through the Transportation Revenue Forecast Council. Each
quarter, technical staff of the Department of Licensing, Department of Transportation, Washington State Patrol, and the
Office of Forecast Council produce forecasts. The revenue forecasts agreed upon by the Transportation Revenue
Forecast Council members become the official estimated revenues under RCW 43.88.020 21.

 September 2021 Transportation Forecast Overview

Forecast Overview
Here are key conclusions from the September 2021 transportation revenue forecast.

   •   The 2019-21 biennium revenue finished at $6.12 billion, which was down $298 million or 4.65% biennia to biennia
       due to the 2019-21 biennium incorporating actuals coming in lower due to the pandemic first hitting last biennium.
       The current biennium. 2021-23, is showing a recovery for transportation revenues with a 8.8% growth biennia to
       biennia.

   •   September 2021 baseline transportation forecast of revenues: last biennium revenues came in above the June
       forecast by $5.36 million or 0.09%. Now the current biennium, 2021-23, is anticipated to have $6.66 billion which
       is up forecast to forecast from the June 2021 baseline forecast by $11.5 million or 0.2%. This was primarily due to
       some collections coming in higher than anticipated and the WSTC adopting higher toll rates and ferry fares since
       the last forecast. Most of the increase in revenue since the June forecast, $8.98 million and $9.4 million, was due
       to higher ferry and toll revenues respectively due to fare and rate increases. Other forecasts like LPF, driver
       related and business related came in below the last forecast in the current biennium. Conversely, rental car and
       vehicle sales taxes are both up from June.

   •   The 2019-21 biennium revenue losses from the pandemic and lower economic variables than the pre-pandemic
       alternative forecast in February is $453 million or down 7%. Next biennium, the COVID losses are anticipated to
       be higher at $490.7 million or down 7.3%. The largest pandemic losses are seen in the 2021-23 biennium as the
       recovery is beginning faster in FY 2022 and flowing into FY 2023 now.

   •   For the 10-year forecast horizon, total baseline revenue in September is projected to be $34.64 billion, which is up
       from the last forecast by $179 million or (0.5%) from June. With the largest upward adjustments being toll and
       ferry revenues due to new fare and toll increases. The current September forecast is up as well from the baseline
       March 2021 forecast which set WSDOT’s transportation budgets. Over the next 10 years, the current forecast is
       up from the March foecast by $575.5 million or 1.7%.

   •   The current forecast is still down from the pre-COVID-19 alternative forecast in February by $611.6 million or 9%
       last biennium and down $353 million or 5% in the current biennium. Over the next 10 years, the decline in
       transportation revenue from the pre-pandemic alternative February 2020 forecast is $1,363 million or 3.8%. We
       are still below the pre-pandemic forecast in all revenue streams except LPF, vehicle sales taxes and
       transportation related revenues.

   •   New projections of WA economic variables include lower real personal income growth rates in FY 2021 and 2022
       but faster growth in FY 2023-2026 than projected in June. Retail trade and trade, transportation and utilities
       employment projections are up in FY 2022-2024 from last quarter’s projections. Retail gas, diesel and B5 dyed
       diesel prices are adjusted upward beginning in FY 2022 and continues throughout the forecast horizon. This
       September forecast is above both the June and March forecasts for B5 biodiesel.

Adopted                                                   3                                       September 22, 2021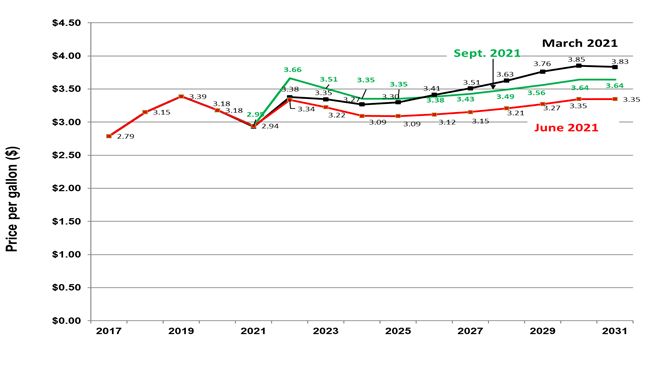
In FY 2020 baseline total transportation revenues came in at $2.899 billion which was 10.6% below the high point
in FY 2019 of $3.242 billion. FY 2021 baseline transportation revenues finished up the year at $3.221 billion which was
11% higher than in 2020. In the current fiscal year, baseline total transportation revenues are anticipated to be $3.225
billion, which is a year of year over year increase of 0.1% but FY 2023 now has a 6.5% annual growth after FY 2022. This
September forecast is only a minor adjustment upward from the June forecast and revenues are up for ferries and tolling
the most due to new adopted fares and tolls by WSTC. Overall, during the next 10-year forecast horizon, September’s
baseline transportation revenues are projected to be $34.642 billion which is up $179 million or 0.5% from the June
forecast.

         Figure 1 compares transportation revenues in September, June 2021, March 2021 vs alternative February 2020.
The black and blue lines show total revenues without I-976 impacts in February 2020 and March 2021 respectively. The
solid red line denote the June 2021 Forecast. The solid lime green bars show the September 2021 baseline forecast. The
striped green colored bars represent the Sept. COVID losses due to mandatory shutdowns and economic changes since
the pre-pandemic forecast in February 2020. The highest level was the alternative February 2020 pre-pandemic forecast
without the impacts of I-976 which is the solid black line. The March baseline forecast is only slightly below the June
baseline forecast.

Figure 1: Total Transportation Revenues Comparing September 2021 vs. June 2021 vs. March
2021 vs February 2020 Forecasts millions of dollars

Adopted                                                    4                                      September 22, 2021
Washington’s transportation revenues come from numerous taxes, fees, permits, tolls, and other revenues.
Revenues forecasted each quarter include the sources contained in Figure 2. This pie graph reveals the anticipated share
of each state revenue source to the total baseline transportation revenues for the 2021-23 biennium, ($6.66 billion).
Gasoline fuel taxes comprise the largest share at 39.8% but this share has declined during this pandemic period as fuel
tax revenue have been hit the hardest. With the addition of diesel fuel taxes, all motor vehicle fuel taxes comprise 51% of
all revenues. Licenses, permits, and fee revenues comprise the second largest share at 26.8%. The three largest revenue
sources are projected to consist of 77.8% of revenues in the 2021-23 biennium. The remaining 22% consists of ferry
fares, toll revenue, driver related revenue and other transportation related revenue.
Figure 2: Revenue By Source 2021-23 Biennium ($6.66 billion)
As Figure 3 indicates the 2019-21 biennium September revenues came in at $6.12 billion and above last quarter’s
June forecast by $5.36 million or 0.09%. The September forecast is up due to LPF and toll revenues coming in with
stronger collections than anticipated. Other revenue streams like fuel tax collections came in below the June forecast in
recent months. Most revenue sources besides fuel taxes and ferry revenues ended FY 2021 higher than last projected. In
the current biennium, total transportation revenues are up from June by $11.5 million or 0.2%. Motor vehicle fuel taxes are
not changed much overall in the current biennum, up $0.4 million. LPF revenues are down $8.8 million in the current
biennium due to lower revenue collections but toll and ferry revenues are up due to the newly adopted fare and toll rates.
Toll revenue are up 9.4 million or 2.2% this biennium from June. Ferry revenues were also up $9 million or 2.2% from the
last forecast also due to fare increases. Next biennium projections for total transportation revenues are up by $46 million
from June’s projections. Over the next 10 years, transportation revenues are anticipated to be $34.64 billion, which is up
$179 million or 0.5% from the June baseline forecast.
In this September forecast, the transportation revenues are compared to the March 2021 forecast in Figure 4.
This March 2021 forecast is the baseline forecast because it set our 2021-23 transportation biennium budget. Figure 4
shows the current September forecast compared to the baseline March forecast. The 2019-21 biennium September
revenues came in at $6.12 billion and above the March baseline forecast by $57.58 million or 0.95%. The current
biennium projections for total transportation revenues are $6.66 billion which is higher than the March’s projections by
$100.5 million. The 10 year increase from the March forecast is $575.5 million which is primarily due to motor vehicle fuel
Adopted 5 September 22, 2021taxes coming in $142 million higher and ferry and toll revenue are higher as well by $105.7 million and $153.2 million
respectively due to the new adopted toll rate and fare increases.
Figure 3: Current September Forecast Compared to June Forecast For All Transportation
Revenues - 10-years
Forecast to Forecast Comparison for Transportation Revenues and Distributions 10-Year Period
September Baseline Forecast to June 2021 Baseline forecast millions of dollars
10-Year Period
2019-2021 2021-2023 (2019-2029)
Forecast Chg from Percent Forecast Chg from Percent Forecast Chg from Percent
Sept. 2021 June 2021 Change Sept. 2021 June 2021 Change Sept. 2021 June 2021 Change
Sources of Transportation Revenue
Motor Vehicle Fuel Tax Collections 3,268.36 (5.60) -0.17% 3,398.30 0.41 0.01% 17,347.38 (17.88) -0.10%
Licenses, Permits and Fees 1,599.69 4.47 0.28% 1,782.47 (8.80) -0.49% 9,403.71 20.00 0.21%
Ferry Revenue† 329.08 (0.35) -0.11% 410.15 8.98 2.24% 2,139.63 68.82 3.32%
Toll Revenue § 368.83 4.56 1.25% 440.62 9.41 2.18% 2,548.64 115.60 4.75%
Aviation Revenues ‡ 6.54 0.16 2.58% 6.89 0.08 1.19% 34.00 (0.47) -1.37%
Rental Car Tax 52.31 0.62 1.20% 67.92 4.23 6.64% 353.68 9.70 2.82%
Vehicle Sales Tax 110.24 0.73 0.67% 118.82 0.96 0.81% 619.06 6.00 0.98%
Driver-Related Fees 289.53 0.66 0.23% 317.66 (1.05) -0.33% 1,600.99 (0.21) -0.01%
Business/Other Revenues‡ 96.13 0.12 0.12% 116.21 (2.69) -2.26% 594.80 (22.40) -3.63%
Total Revenues 6,120.71 5.36 0.09% 6,659.03 11.52 0.17% 34,641.88 179.14 0.52%
Distribution of Revenue
Motor Fuel Tax Refunds and Transfers 239.09 (3.31) -1.36% 256.24 6.50 2.60% 1,302.26 26.33 2.06%
Motor Fuel Administrative Fee - DOL 18.43 (0.09) -0.48% 18.49 0.32 1.78% 95.91 0.23 0.24%
State Uses
Motor Vehicle Account (108) 1,214.69 23.52 1.97% 1,297.67 (15.35) -1.17% 6,776.30 (35.74) -0.52%
Transportation 2003 (Nickel) Account (550) 402.21 (1.59) -0.39% 416.12 (0.22) -0.05% 2,116.17 (6.16) -0.29%
Transportation 2005 Partnership Account (09H) 587.13 (4.26) -0.72% 607.96 0.29 0.05% 3,108.30 (11.72) -0.38%
Connecting Washington Account (20H) 731.07 0.82 0.11% 750.19 (2.84) -0.38% 3,843.57 (10.67) -0.28%
Multimodal Account (218) 514.30 (0.58) -0.11% 634.55 5.73 0.91% 3,438.03 52.34 1.55%
Special Category C Account (215) 46.08 0.05 0.11% 47.28 (0.18) -0.38% 242.24 (0.67) -0.28%
Puget Sound Capital Construction Account (099) 33.52 0.04 0.11% 34.40 (0.13) -0.38% 176.25 (0.49) -0.28%
Puget Sound Ferry Operations Account (109) 389.00 0.46 0.12% 469.16 10.10 2.20% 2,439.32 71.18 3.01%
Capital Vessel Replacement Account (18J) 57.50 (0.11) -0.19% 65.37 (0.11) -0.17% 330.38 0.05 0.02%
Tacoma Narrows Bridge Account (511) 160.20 1.31 0.83% 175.66 6.33 3.74% 891.24 29.52 3.43%
High Occupancy Toll Lanes Account (09F)^ 6.51 0.14 2.20% 9.29 0.18 1.92% 72.72 0.32 0.44%
SR 520 Corridor Account (16J) 124.14 0.20 0.16% 149.97 (0.78) -0.52% 931.70 68.69 7.96%
SR 520 Corridor Civil Penalties Account (17P) 7.09 0.86 13.74% 4.77 0.02 0.46% 31.61 0.65 2.08%
Interstate 405 Express Toll Lanes Operations (595) 37.51 1.14 3.13% 41.69 0.32 0.77% 314.22 (0.74) -0.24%
Alaskan Way Viaduct Replacement Acct. (535) 33.40 0.90 2.78% 59.23 3.34 5.97% 307.15 17.16 5.92%
Aeronautics Account (039) 6.45 0.17 2.63% 6.80 0.08 1.23% 33.49 (0.47) -1.38%
Washington State Aviation Account (21G) 0.07 (0.00) 0.00% 0.09 0.00 0.00% 0.47 (0.00) -0.08%
State Patrol Highway Account (081) 459.79 (16.13) -3.39% 500.79 2.32 0.47% 2,577.33 5.25 0.20%
Highway/Motorcycle Safety Accts. (106 & 082) 263.73 0.26 0.10% 290.73 (0.85) -0.29% 1,459.54 (0.33) -0.02%
School Zone Safety Account (780) 0.47 0.01 2.54% 0.59 0.00 0.18% 2.89 (0.36) -11.17%
Other accounts (201, 06T, 097, 09E, 216, 07C, 24-K) 37.07 0.02 0.06% 42.77 (2.33) -5.17% 216.83 (19.83) -8.38%
Electric Vehicle Account (20J) 23.36 0.29 1.26% 32.97 1.57 5.02% 94.98 3.69 4.04%
Ignition Interlock Devices Revolving Acct 14V 8.23 0.03 0.41% 8.36 (0.15) -1.72% 42.80 (0.26) -0.60%
Multiuse Roadway Safety Account Collections-571 0.39 0.02 5.40% 0.44 0.03 7.33% 2.20 0.14 6.94%
Total for State Use 5,143.90 7.57 0.15% 5,646.84 7.37 0.13% 29,449.74 157.87 0.54%
Cities 176.71 0.20 0.11% 181.33 (0.69) -0.38% 929.02 (2.58) -0.28%
Counties 288.27 0.67 0.23% 293.66 (1.20) -0.41% 1,509.07 (3.83) -0.25%
Transportation Improvement Board (112 & 144) 189.82 0.23 0.12% 195.54 (0.64) -0.33% 1,007.38 (2.19) -0.22%
County Road Administration Board (102 & 253) 64.49 0.08 0.13% 66.93 (0.15) -0.23% 348.49 (0.37) -0.11%
Total for Local Use 719.29 1.18 0.16% 737.46 (2.67) -0.36% 3,793.97 (8.97) -0.24%
Total Distribution of Revenue 6,120.71 5.36 0.09% 6,659.03 11.52 0.17% 34,641.89 179.16 0.52%
† Ferry Fares plus non-farebox revenue
‡ Aviation Revenues and Business/Other Revenues net of amounts transferred to General Fund in the Sept.
forecast.
Adopted 6 September 22, 2021Figure 4: Current September Forecast Compared to March 2021 Baseline Forecast For All
Transportation Revenues - 10-years
Forecast to Baseline Comparison for Transportation Revenues and Distributions 10-Year Period
September 2021 Baseline Forecast to M arch 2021 Baseline Forecast millions of dollars
10-Year Period
2019-2021 2021-2023 (2019-2029)
Forecast Chg from Percent Forecast Chg from Percent Forecast Chg from Percent
Sept. 2021 March 2021 Change Sept. 2021 March 2021 Change Sept. 2021 March 2021 Change
Sources of Transportation Revenue
Motor Vehicle Fuel Tax Collections 3,268.36 4.77 0.15% 3,398.30 25.18 0.75% 17,347.38 141.68 0.82%
Licenses, Permits and Fees 1,599.69 3.40 0.21% 1,782.47 (15.78) -0.88% 9,403.71 (27.64) -0.29%
Ferry Revenue† 329.08 7.54 2.34% 410.15 22.28 5.74% 2,139.63 105.71 5.20%
Toll Revenue § 368.83 14.83 4.19% 440.62 30.33 7.39% 2,548.64 153.23 6.40%
Aviation Revenues ‡ 6.54 0.22 3.51% 6.89 0.10 1.42% 34.00 (0.34) -1.00%
Rental Car Tax 52.31 0.56 1.08% 67.92 3.75 5.85% 353.68 8.26 2.39%
Vehicle Sales Tax 110.24 6.03 5.79% 118.82 6.70 0.00% 619.06 33.69 5.75%
Driver-Related Fees 289.53 4.19 1.47% 317.66 8.44 2.73% 1,600.99 61.07 3.97%
Business/Other Revenues‡ 96.13 16.04 20.03% 116.21 19.59 20.28% 594.80 99.89 20.18%
Total Revenues 6,120.71 57.58 0.95% 6,659.03 100.59 1.53% 34,641.88 575.52 1.69%
Distribution of Revenue
Motor Fuel Tax Refunds and Transfers 239.09 (1.33) -0.55% 256.24 20.57 8.73% 1,302.26 88.06 7.25%
Motor Fuel Administrative Fee - DOL 18.43 (0.12) -0.66% 18.49 0.32 1.78% 95.91 0.20 0.21%
State Uses
Motor Vehicle Account (108) 1,214.69 15.43 1.29% 1,297.67 (16.86) -1.28% 6,776.30 (31.41) -0.46%
Transportation 2003 (Nickel) Account (550) 402.21 (0.28) -0.07% 416.12 3.95 0.96% 2,116.17 12.35 0.59%
Transportation 2005 Partnership Account (09H) 587.13 (1.32) -0.22% 607.96 1.53 0.25% 3,108.30 1.87 0.06%
Connecting Washington Account (20H) 731.07 1.53 0.21% 750.19 0.65 0.09% 3,843.57 12.48 0.33%
Multimodal Account (218) 514.30 6.73 1.33% 634.55 6.08 0.97% 3,438.03 54.82 1.62%
Special Category C Account (215) 46.08 0.10 0.21% 47.28 0.04 0.09% 242.24 0.79 0.33%
Puget Sound Capital Construction Account (099) 33.52 0.07 0.21% 34.40 0.03 0.09% 176.25 0.57 0.33%
Puget Sound Ferry Operations Account (109) 389.00 7.74 2.03% 469.16 23.00 5.16% 2,439.32 107.36 4.60%
Capital Vessel Replacement Account (18J) 57.50 (0.74) -1.28% 65.37 (0.03) -0.04% 330.38 (2.18) -0.66%
Tacoma Narrows Bridge Account (511) 160.20 4.97 3.20% 175.66 14.44 8.95% 891.24 41.29 4.86%
High Occupancy Toll Lanes Account (09F)^ 6.51 0.47 7.73% 9.29 1.37 17.28% 72.72 1.84 2.60%
SR 520 Corridor Account (16J) 124.14 2.66 2.19% 149.97 6.57 4.58% 931.70 79.61 9.34%
SR 520 Corridor Civil Penalties Account (17P) 7.09 1.36 23.73% 4.77 0.24 5.35% 31.61 1.38 4.58%
Interstate 405 Express Toll Lanes Operations (595) 37.51 2.42 6.91% 41.69 1.81 4.54% 314.22 5.82 1.89%
Alaskan Way Viaduct Replacement Acct. (535) 33.40 2.95 9.70% 59.23 5.90 11.07% 307.15 23.29 8.20%
Aeronautics Account (039) 6.45 0.22 3.58% 6.80 0.10 1.51% 33.49 (0.31) -0.93%
Washington State Aviation Account (21G) 0.07 (0.00) -2.03% 0.09 (0.00) 0.00% 0.47 (0.02) 0.00%
State Patrol Highway Account (081) 459.79 (7.05) -1.51% 500.79 (2.48) -0.49% 2,577.33 (8.30) -0.32%
Highway/Motorcycle Safety Accts. (106 & 082) 263.73 4.15 1.60% 290.73 9.18 3.26% 1,459.54 63.01 4.51%
School Zone Safety Account (780) 0.47 0.01 2.76% 0.59 0.00 0.29% 2.89 (0.36) -11.11%
Other accounts (201, 06T, 097, 09E, 216, 07C, 24-K) 37.07 15.12 68.92% 42.77 20.05 88.27% 216.83 102.19 89.13%
Electric Vehicle Account (20J) 23.36 1.55 7.09% 32.97 4.19 14.56% 94.98 10.29 12.15%
Ignition Interlock Devices Revolving Acct 14V 8.23 (0.38) -4.37% 8.36 (0.34) -3.96% 42.80 (1.28) -2.90%
Multiuse Roadway Safety Account Collections-571 0.39 0.05 13.43% 0.44 0.08 23.45% 2.20 0.39 21.53%
Total for State Use 5,143.90 57.76 1.14% 5,646.84 79.52 1.43% 29,449.74 475.47 1.64%
Cities 176.71 0.37 0.21% 181.33 0.16 0.09% 929.02 3.02 0.33%
Counties 288.27 0.27 0.09% 293.66 (0.61) -0.21% 1,509.07 2.41 0.16%
Transportation Improvement Board (112 & 144) 189.82 0.44 0.23% 195.54 0.38 0.19% 1,007.38 4.26 0.42%
County Road Administration Board (102 & 253) 64.49 0.18 0.28% 66.93 0.27 0.40% 348.49 2.12 0.61%
Total for Local Use 719.29 1.27 0.18% 737.46 0.19 0.03% 3,793.97 11.80 0.31%
Total Distribution of Revenue 6,120.71 57.58 0.95% 6,659.03 100.60 1.53% 34,641.89 575.54 1.69%
Figure 5 compares the current September baseline forecast to the pre-pandemic baseline February 2020
alternative forecast. The September baseline revenues for the 2019-21 biennium are $6.12 million which is $611.6 million
or 9% lower than the pre-pandemic forecast. In the current biennium, total transportation revenues are below the pre-
pandemic February forecast by $353 million or 5%, which is lower due to the new legislation and fare and toll rate
increases since February 2020. Next biennium’s September revenues are $7.082 billion which is $169.3 million below the
February alternative forecast because of the negative impacts of COVID shutdowns that biennium. This same trend holds
true for the rest of the forecast horizon. As discussed before, fuel taxes, toll revenue, rental car taxes, driver-related and
ferry revenue declines are the largest sources of the decline. Fuel taxes are down in the current biennium by $299 million
or 8% and toll revenues are down $98 million or 18% and ferry revenues are down $39.4 million or 8.8% from the pre-
pandemic February alt. forecast. There are some forecasts which have recovered from the pandemic faster and have
Adopted 7 September 22, 2021revenues above the February 2020 alternative forecast. The LPF, vehicle sales tax and transportation related revenue
have forecast above the pre-pandemic level by $62.5 million for LPF, $6 million for vehicle sales taxes and $34 million for
new legislation on new fees for DOL administration. Over the next 10 years, transportation revenues are down $1,363
million or 3.8% below the pre-pandemic February alternative forecast without I-976 impacts.
Figure 5: September Forecast Compared to February 2020 Alternative Forecast (Without I-976
Impact) For All Transportation Revenues - 10-years
Forecast to Alternative Feb. 2020 Baseline Comparison for Transportation Revenues and Distributions 10-Year Period
September 2021 Forecast to Alt. Feburary 2020 Baseline Forecast (Without I-976) millions of dollars
10-Year Period
2019-2021 2021-2023 (2019-2029)
Forecast Chg from Percent Forecast Chg from Percent Forecast Chg from Percent
Sept. 2021 Feb. 2020 Change Sept. 2021 Feb. 2020 Change Sept. 2021 Feb. 2020 Change
Sources of Transportation Revenue
Motor Vehicle Fuel Tax Collections 3,268.36 (366.88) -10.09% 3,398.30 (299.18) -8.09% 17,347.38 (1,369.78) -7.32%
Licenses, Permits and Fees 1,599.69 3.78 0.24% 1,782.47 62.53 3.64% 9,403.71 396.72 4.40%
Ferry Revenue† 329.08 (100.25) -23.35% 410.15 (39.38) -8.76% 2,139.63 (140.02) -6.14%
Toll Revenue § 368.83 (118.06) -24.25% 440.62 (98.01) -18.20% 2,548.64 (374.97) -12.83%
Aviation Revenues ‡ 6.54 (0.53) -7.48% 6.89 (0.35) -4.81% 34.00 (2.50) -6.84%
Rental Car Tax 52.31 (21.03) -28.68% 67.92 (8.71) -11.36% 353.68 (45.70) -11.44%
Vehicle Sales Tax 110.24 2.76 2.57% 118.82 5.96 0.00% 619.06 30.70 5.22%
Driver-Related Fees 289.53 (26.28) -8.32% 317.66 (9.67) -2.95% 1,600.99 (39.43) -2.40%
Business/Other Revenues‡ 96.13 14.89 18.33% 116.21 33.86 41.12% 594.80 181.70 43.99%
Total Revenues 6,120.71 (611.60) -9.08% 6,659.03 (352.94) -5.03% 34,641.88 (1,363.27) -3.79%
Distribution of Revenue
Motor Fuel Tax Refunds and Transfers 239.09 22.78 10.53% 256.24 10.46 4.26% 1,302.26 58.68 4.72%
Motor Fuel Administrative Fee - DOL 18.43 (1.04) -5.34% 18.49 0.34 1.90% 95.91 (1.39) -1.43%
State Uses
Motor Vehicle Account (108) 1,214.69 (101.81) -7.73% 1,297.67 (60.05) -4.42% 6,776.30 (229.81) -3.28%
Transportation 2003 (Nickel) Account (550) 402.21 (32.93) -7.57% 416.12 (25.13) -5.70% 2,116.17 (118.69) -5.31%
Transportation 2005 Partnership Account (09H) 587.13 (57.75) -8.95% 607.96 (47.98) -7.32% 3,108.30 (215.08) -6.47%
Connecting Washington Account (20H) 731.07 (83.83) -10.29% 750.19 (76.36) -9.24% 3,843.57 (340.84) -8.15%
Multimodal Account (218) 514.30 (26.09) -4.83% 634.55 16.73 2.71% 3,438.03 115.44 3.47%
Special Category C Account (215) 46.08 (5.28) -10.29% 47.28 (4.81) -9.24% 242.24 (21.48) -8.15%
Puget Sound Capital Construction Account (099) 33.52 (3.84) -10.29% 34.40 (3.50) -9.24% 176.25 (15.63) -8.15%
Puget Sound Ferry Operations Account (109) 389.00 (102.38) -20.83% 469.16 (40.23) -7.90% 2,439.32 (147.55) -5.70%
Capital Vessel Replacement Account (18J) 57.50 (7.23) -11.17% 65.37 (4.57) -6.53% 330.38 (22.24) -6.31%
Tacoma Narrows Bridge Account (511) 160.20 (11.40) -6.64% 175.66 0.10 0.06% 891.24 (6.59) -0.73%
High Occupancy Toll Lanes Account (09F)^ 6.51 (4.56) -41.19% 9.29 (5.08) -35.35% 72.72 (18.88) -20.61%
SR 520 Corridor Account (16J) 124.14 (63.48) -33.83% 149.97 (48.18) -24.31% 931.70 (124.39) -11.78%
SR 520 Corridor Civil Penalties Account (17P) 7.09 0.74 11.67% 4.77 (1.99) -29.41% 31.61 (3.99) -11.22%
Interstate 405 Express Toll Lanes Operations (595) 37.51 (28.86) -43.48% 41.69 (32.83) -44.05% 314.22 (194.16) -38.19%
Alaskan Way Viaduct Replacement Acct. (535) 33.40 (10.51) -23.94% 59.23 (10.04) -14.49% 307.15 (26.95) -8.07%
Aeronautics Account (039) 6.45 (0.54) -7.69% 6.80 (0.36) -5.02% 33.49 (2.54) -7.06%
Washington State Aviation Account (21G) 0.07 (0.00) -1.59% 0.09 0.00 0.00% 0.47 0.00 0.00%
State Patrol Highway Account (081) 459.79 (6.45) -1.38% 500.79 19.93 4.15% 2,577.33 107.63 4.36%
Highway/Motorcycle Safety Accts. (106 & 082) 263.73 (25.94) -8.96% 290.73 (9.82) -3.27% 1,459.54 (44.84) -2.98%
School Zone Safety Account (780) 0.47 (0.37) -44.09% 0.59 (0.29) -33.37% 2.89 (1.47) -33.63%
Other accounts (201, 06T, 097, 09E, 216, 07C, 24-K) 37.07 15.42 71.23% 42.77 20.85 95.12% 216.83 105.60 94.93%
Electric Vehicle Account (20J) 23.36 3.55 17.92% 32.97 6.97 26.82% 94.98 18.23 23.75%
Ignition Interlock Devices Revolving Acct 14V 8.23 (0.43) -4.94% 8.36 (0.25) -2.91% 42.80 (0.30) -0.70%
Multiuse Roadway Safety Account Collections-571 0.39 0.07 21.81% 0.44 0.12 36.88% 2.20 0.60 37.55%
Total for State Use 5,143.90 (553.88) -9.72% 5,646.84 (306.76) -5.15% 29,449.74 (1,187.96) -3.88%
Cities 176.71 (20.26) -10.29% 181.33 (18.45) -9.24% 929.02 (82.38) -8.15%
Counties 288.27 (30.23) -9.49% 293.66 (29.56) -9.14% 1,509.07 (127.91) -7.81%
Transportation Improvement Board (112 & 144) 189.82 (21.66) -10.24% 195.54 (20.10) -9.32% 1,007.38 (89.02) -8.12%
County Road Administration Board (102 & 253) 64.49 (7.29) -10.16% 66.93 (7.02) -9.49% 348.49 (30.59) -8.07%
Total for Local Use 719.29 (79.45) -9.95% 737.46 (75.13) -9.25% 3,793.97 (329.90) -8.00%
Total Distribution of Revenue 6,120.71 (611.60) -9.08% 6,659.03 (352.94) -5.03% 34,641.89 (1,363.26) -3.79%
† Ferry Fares plus non-farebox revenue
‡ Aviation Revenues and Business/Other Revenues net of amounts transferred to General Fund in the
June forecast.
Figure 6 isolates the annual impacts of the COVID shutdowns and economic variable changes since the pre-
pandemic February alternative forecast. It includes actual revenue losses from the monthly comparison of actuals to Feb.
Adopted 8 September 22, 20212020 alternative forecast. The September forecast is slightly higher from the last forecast so the COVID losses are slightly
down from the last forecast. These impacts are calculated based on the February 2020 alternative forecast for LPF and
motor vehicles sales tax which excludes I-976. In FY 2020, the losses from COVID is $262.66 million from the February
forecast. In FY 2021, the COVID losses were $190.5 million based on the monthly comparison from the February forecast
without I-976 but this is smaller than the estimates in June. In FY 2022, the losses are bigger at $287.6 million and $203
million in FY 2023. The largest COVID revenue reduction is anticipated to be in FY 2022 at 8.7% below the alternative
February pre-pandemic projections.
Figure 6: Transportation Revenue Reductions from February 2020 (Baseline) Alternative
Forecast: COVID-19 Induced Recession and Lower Economic Variable Forecasts
Revenue Sources Impacted by $ Difference Between Sept. 2021 and Feb. 2020 Forecasts
COVID-19 Shutdowns FY 2020 FY 2021 FY 2022 FY 2023
Gross Fuel tax $ (147,535,900) $ (219,841,280) $ (158,351,500) $ (140,828,900)
LPF * $ (29,700,000) $ 222,116,720 $ (33,322,759) $ (17,747,741)
Ferry Fares $ (34,933,470) $ (57,507,910) $ (31,347,000) $ (8,028,000)
Toll Revenue $ (40,507,400) $ (86,664,130) $ (62,471,000) $ (35,534,000)
Aeronautics Revenues $ (338,100) $ (366,700) $ (149,247) $ (200,029)
Rental Car Tax $ (5,993,000) $ (15,531,840) $ (4,838,100) $ (3,869,700)
Motor Vehicle Sales Tax * $ (3,650,000) $ (32,740,210) $ 2,843,200 $ 3,121,200
Total Major Revenue Sources $ (262,657,870) $ (190,535,350) $ (287,636,406) $ (203,087,170)
Revenue Sources Impacted by
COVID-19 Shutdowns Percentage Change Between Sept. and Feb. 2020 Forecasts
FY 2020 FY 2021 FY 2022 FY 2023
Gross Fuel tax -8.2% -12.0% -8.6% -7.6%
LPF -3.6% 25.8% -3.8% -1.8%
Ferry Fares -16.8% -26.0% -14.0% -3.6%
Toll Revenue -17.3% -34.2% -23.6% -13.0%
Aeronautics Revenues -9.7% -10.3% -4.1% -5.5%
Rental Car Tax -16.5% -41.9% -12.8% -10.0%
Motor Vehicle Sales Tax -6.9% -60.1% 5.1% 5.5%
TOTAL Major Revenue Sources -8.3% -5.8% -8.7% -5.9%
2020 & 2021 have actual losses from monthly forecast
Adopted 9 September 22, 2021Figure 7: Transportation Revenue Actuals Compared to the March 2021 Forecast:
March –July 2021
Change in Transportation Revenue Since the June Forecast (June and July 2021 Collections)
$ in millions Difference Actual Collections Compared to June Forecast
Jun-21 Jul-21 2 Months % Change
Major Revenue Sources
Gross Fuel Taxes (before
refunds/transfers) * $ (5.61) $ 7.48 $ 1.87 0.6%
Aviation Fuel tax $ 0.17 $ 0.08 $ 0.25 62.6%
Licenses Permits and Fee Revenues ^
$ 1.60 $ (2.30) $ (0.70) -0.6%
WSF Ferries $ 0.15 $ 0.19 $ 0.34 0.9%
Toll Facilities - Adjusted Gross Toll
Revenues + $ 0.68 $ (0.33) $ 0.35 1.2%
Rental car tax $ 0.62 $ 0.85 $ 1.47 29.7%
Motor Vehicle Sales Tax $ (0.68) $ (1.02) $ (1.71) -12.8%
Total All Revenue Sources $ (3.07) $ 4.94 $ 1.87 0.38%
* June gas tax collections are missing $7 million that will appear in the July OST collection report
^ June LPF revenue has a $11 million negative adjustments for overreporting IRP revenues in Nov. and Dec. 2020
+ July 2021 Toll revenues (partial) are incomplete due to a transactions backlog following the back-office transition to a new vendor.
These backlogged transactions are planned to be reviewed and
processed over the next few months.
Figure 7 shows the latest actuals in the major transportation revenue sources since the last June forecast. June
and July 2021 actuals have been received with only preliminary data available in August. All transportation revenue
sources in total rose from the last forecast by $1.87 million or 0.4% since June. All revenue sources for transportation are
up except for LPF and motor vehicle sales taxes.
Figure 8 reveals the cumulative impact of the pandemic on recent actuals compared to the pre-pandemic forecast
in February. The results reveal that over the past 17 months since June collections, major transportation revenue actuals
have come in $245 million or 6% below the February 2020 forecast. Fuel tax actuals have come in below that pre-
pandemic forecast the most at -$374.8 million or 14.5% below projections for this past year. The second largest reduction
was in toll revenues coming in -$134 million or 40% below the February 2020 forecast. Ferries revenue losses in actuals
Adopted 10 September 22, 2021has been $94.7 million or 31% below the pre-pandemic projections. LPF is the only revenue source where the September
forecast is above the February baseline forecast by $386 million for the past 17 months.
Figure 8: Transportation Revenue Actuals Compared to the February 2020 (Alternative)
Forecast: March 2020 – July 2021
Figure 9 shows the various September forecasts recovery periods after the drops in revenue from COVID-19
shutdowns, The recovery from our recent recession is demonstrated as the period of time it takes to reach the levels
projected in the February 2020 forecasts for FY 2021. Some of the revenue sources, like passenger cars and truck
registrations and $30 license fee revenue and truck combined license fees have recovered already by FY 2021. Other
revenue sources with a short recovery period from the reduced demand and revenue losses in FY 2020 were diesel
consumption by FY 2022. Some revenue sources like gas consumption and net for distribution of fuel taxes are
anticipated to have a very slow recovery from the losses seen in FY 2021 in 10+ years. WSF ridership and corresponding
revenues are anticipated to be slower to recover from this reduced demand from the pandemic. For ferries ridership
(passengers), ridership is not expected to recover from the recent downturn to the FY 2021 level until 2029 or in 8 years.
Vehicle ferry ridership is anticipated to be back to the 2021 level from the February forecast in 2026 or 5 years from now.
Ferry farebox and misc. revenue are not expected to recover until FY 2024. Toll traffic and revenue recovery varies with
each facility. Overall, for all tolled facilities, the recovery in traffic and adjusted toll revenue is projected to be back to 2021
traffic level in 3 years for traffic and 3 years for toll revenue but the individual tolled facilities adjusted toll revenue recovery
is longer in some cases.
Adopted 11 September 22, 2021Figure 9: September 2021 Forecast Recovery Periods for Major Revenue Sources
Time # of
Type of Forecast Period Years
Fuel Consumption and Fuel Tax Revenue
Return to Gas Consumption in Feb. Forecast -FY 2021 ------ 10+
Return to Diesel Consumption in Feb. Forecast -FY 2021 2022 1
Net for Dist. Fuel Taxes: Return to Feb. Forecast -FY 2021 level ------ 10+
Vehicle Licenses Permits and Fee Revenue (LPF)
Return to Passenger Cars Registrations in Feb. Forecast -FY 2021 2021 0
Return to Trucks Registrations in Feb. Forecast - FY 2021 2021 0
Return to $30 License Fee Revenue in Feb. Forecast -FY 2021 2021 0
Return to Truck Combined License Fee Revenue Level in Feb. Forecast -
FY 2021 2021 0
Rental Car Revenue
Return to Rental Car Revenue Level in Feb. Forecast -FY 2021 2025 4
Aircraft Fuel Tax Revenue
Return to Aircraft Fuel Tax Level in Feb. Forecast - FY 2021 ------ 10+
Ferries Ridership and Revenue
Return to Passenger Ridership in Feb. Forecast - FY 2021 2029 8
Return to Vehicle Ridership in Feb. Forecast - FY 2021 2026 5
Return to Ferry Farebox and Misc. Revenue in Feb. Fct -FY 2021 2024 3
Toll Traffic and Revenue – All Facilities
Return to Total Toll Traffic in Feb. Forecast -FY 2021 2024 3
Return to Toll Adjusted Revenue in Feb. Forecast -FY 2021 2024 3
Adopted 12 September 22, 2021Economic Variables Forecast
Several economic variables are used in forecasting Washington’s transportation revenues each quarter. Key
economic variables include the following: Washington real personal income, driver age population, driver-in population,
inflation, employment, oil price index, fuel efficiency, US sales of new light vehicles and various employment sectors.
These economic variables in September represent the preliminary economic variables by Economic and Revenue
Forecast Council, based on the May IHS-Markit forecast. The September 2021 Forecast includes the federal American
Rescue Plan Act of 2021 beginning in first quarter 2021 with COVID stimulus relief. The COVID Stimulus Act boosts the
economic variables like Washington real personal income and employment in FY 2021 but then when the federal stimulus
funds expire again, then FY 2022 and 2023 have lower growth rates than what was forecasted in June. Washington real
personal income even has a negative annual growth rate in FY 2022 of
-1.4% which was predicted at -0.5% in June. Washington’s non-ag. employment in FY 2021 has increased a little to -3.5%
as compared to the June forecast of -3.7% annual growth. Retail and trade, transportation and utilities employment
sectors are showing growth in FY 2021 at 4.0 and 1.3% respectively. In FY 2022, the non-ag. employment growth is
anticipated to be 5.2% while retail and trade, trade, transportation and utilities employment growth is anticipated at 2.9
and 3.2% respectively. The US oil price index is up in 2022 compared to last projections but down in all subsequent years
throughout the forecast horizon.
Figure 10: Annual Percentage Change (%) in Select Economic Variables
September 2021 Forecast
Source: Washington Economic and Revenue Forecast Council, Washington Office of Financial Management 2021 long-
range forecast, August 2021 Global Insight forecast adjusted for Blue Chip average GDP growth rates and NYMEX crude
oil prices
Adopted 13 September 22, 2021Figure 11: Annual Rate of Change in Select Economic Variables – Sept. vs June 2021 Forecast
Motor Fuel Price Forecast
Washington’s transportation revenues are affected by fuel prices. Gasoline tax collections are negatively related
to the price of gasoline. WSDOT’s budget is heavily impacted by changes in fuel prices. Therefore, projections of fuel
prices are made quarterly to assist in the near and long-term budgeting process for WSDOT. The forecast includes the
following price projections: U.S. West Texas Intermediate crude oil (WTI) and Washington retail prices of gasoline, diesel,
and biodiesel (B5 & B99).
Source of data for the forecast
For the Washington retail price of gasoline, fuel prices are collected from the Energy Information Administration’s
(EIA) survey of retail prices for regular gasoline. For the retail price of diesel, the actual prices are collected from AAA’s
weekly publication of retail prices for diesel in Washington. The actual ferry B5 biodiesel prices are reported by the
Washington State Ferries (WSF). In the short term (through calendar year 2022), the retail gas price forecasts are based
on the growth in the national gas price forecast by EIA. The diesel and biodiesel fuel prices are projected based on the
growth in national diesel prices from the Energy Information Agency (EIA) monthly projections. Beyond calendar year
2022, the fuel price projections are based on September’s Global Insight national gas price forecast for future Washington
gas prices and the producer price index (PPI) projections for refined petroleum products for the diesel price forecasts.
The forecasts of biodiesel prices include two different biodiesel prices: B5 and B99 without the renewable
identification number (RIN). WSF currently purchases biodiesel B5. WSDOT also purchases B99 biodiesel without RIN for
vehicle fleet needs. WSDOT receives OPIS fuel prices with the latest prices for B5 in Portland and B99 biodiesel prices
without RIN in Tacoma. The B99 prices represent those paid by other state entities’ purchases of biodiesel. The B5 price
is based on Washington State ferries’ latest reported purchase price of biodiesel with the markup, delivery, and other tax
Adopted 14 September 22, 2021costs included and the latest B5 Portland OPIS prices for current forecast month. The base for the price forecast for the
B99 price without RIN for non-WSF purchases is the OPIS base price without markup, delivery, and tax costs.
Figure 12: Near-term UNADJUSTED BASELINE Qtrly Fuel Prices: September 2021
Fiscal Crude Oil WA Retail
Year Price Gasoline Price WA Retail Diesel
Quarter ($/barrel) ($/gal) Price ($/gal)
2020Q3 40.89 2.71 2.72
2020Q4 42.45 2.65 2.79
2021Q1 57.79 2.83 2.87
2021Q2 66.09 3.39 3.40
FY2021 51.81 2.89 2.95
2021Q3 69.74 3.77 3.71
2021Q4 68.33 3.52 3.73
2022Q1 65.17 3.26 3.64
2022Q2 63.83 3.32 3.57
FY2022 66.77 3.47 3.66
2022Q3 61.33 3.26 3.57
2022Q4 59.33 3.12 3.54
2023Q1 59.87 3.06 3.50
2023Q2 59.73 3.37 3.43
FY2023 60.07 3.20 3.51
Figure 13: Forecast of UNADJUSTED Washington Retail Gasoline Prices, Regular
Sept. vs. June 2021 vs. March 2021
Adopted 15 September 22, 2021Figure 14: Forecast of UNADJUSTED Washington Retail Diesel Prices
Sept. vs June 2021 vs. March 2021
Comparison of several current U.S. crude oil price forecasts
The WTI crude oil prices from five surveyed forecasting entities, EIA, NYMEX, Global Insight, Consensus
Economics, and Moody’s Economy.com were compared in this forecast. WSDOT’s baseline fuel price forecasts use the
Energy Information Administration (EIA) forecasts in the near-term through calendar year 2022 and then use the growth
rates from Global Insight forecasts for subsequent years. The forecast for WTI crude oil in FY 2022 ranged from $65 per
barrel in the Global Insight forecast to $68 per barrel by Consensus Economics. The baseline crude oil price forecast in
FY 2022 is $66.8 per barrel, which is 0.2% above the 5-entity average of $66.64 per barrel. In FY 2023, the crude oil
prices range from $60 per barrel in baseline EIA and GI forecast to $66 per barrel in the NYMEX forecast. The 5-entity
average price is $63.53 per barrel, which is 5.8% above the baseline price forecast of $60 per barrel. Figure 15 reveals
the WSDOT baseline WTI price forecast compared to the other entities’ crude oil price forecasts and the necessary
adjustments each year.
Figure 15: Near-term Annual WTI Crude Oil Price Forecasts – 5 Different Forecast
Comparisons: September 2021 Dollars per barre
Consensus 5 % Diff
Fiscal WSDOT Global Economy. Economics Entity Average
Year (EIA/GI) NYMEX Insight com Avg
2021 $51.81 $51.83 $51.83 $51.83 $51.83 $51.82 0.03%
2022 $66.77 $67.57 $65.34 $65.26 $68.25 $66.64 -0.20%
2023 $60.07 $66.29 $63.70 $62.90 $64.70 $63.53 5.77%
Adopted 16 September 22, 2021Figure 16: Near-term Average Adjusted Quarterly Fuel Prices and B5 Biodiesel Prices and
Unadjusted B99 Biodiesel Prices Used for Budgeting Purposes: September 2021 Dollars per gallon
Fiscal Adjusted WA Adjusted WA Adjusted B5 Unadjusted
Year Retail Gasoline Retail Diesel Biodiesel B99 Biodiesel
Quarter Price ($/gal) Price ($/gal) Price ($/gal) price
2020Q3 2.71 2.72 1.36 2.95
2020Q4 2.65 2.79 1.61 3.03
2021Q1 2.83 2.87 1.95 3.11
2021Q2 3.39 3.40 2.31 3.69
FY2021 2.89 2.95 1.81 3.19
2021Q3 3.76 3.70 2.56 4.02
2021Q4 3.51 3.73 2.45 4.05
2022Q1 3.25 3.63 2.36 3.95
2022Q2 3.32 3.56 2.28 3.87
FY2022 3.46 3.66 2.41 3.97
2022Q3 3.45 3.77 2.34 4.09
2022Q4 3.30 3.74 2.31 4.06
2023Q1 3.24 3.70 2.26 4.01
2023Q2 3.57 3.62 2.21 3.93
FY2023 3.39 3.71 2.28 4.03
WSDOT applies the five-entity forecast average adjustment to the baseline September 2021 retail gasoline,
diesel, and B5 biodiesel prices. The adjusted fuel prices listed in Figure 16 will be used to estimate the future costs to
WSDOT agency’s 2021-23 biennium transportation budgets for gas, diesel, and biodiesel fuel purchases. The latest
adjusted forecast requires a -0.2% downward adjustment to the baseline fuel prices in FY 2022 and upward adjustment of
5.77% in FY 2023.
As Figure 17 reveals, the new B5 fuel price forecast beginning the third quarter of fiscal year 2021 throughout the
forecast horizon is higher than in the June forecast. Since second quarter 2020 and throughout calendar year 2021, B5
diesel prices had been rising and the last few forecasts have been revisions upward. In recent months since the June
forecast, B5 prices have continued to rise steadily so we have now recovered fom the drastic decline in prices after the
pandemic in this first quarter of 2021. The current September 2021 B5 forecast is higher than the last forecast and the
second quarter 2021 B5 average prices are above the first quarter 2021 biodiesel averaged price at $2.31 per gallon. That
is above the last forecast of $2.26 per gallon. In this third quarter of 2021, B5 prices have increased to an estimated $2.56
Adopted 17 September 22, 2021per gallon versus $2.28 per gallon predicted in June. The September 2021 forecast is significantly above the March
forecast throughout the forecast horizon as well.
Figure 17: Quarterly Ferries Adjusted B5 Biodiesel Prices Used for Budgeting the 2019-21 and
2021-23 Biennia September, June 2021 and March 2021 Forecasts
Motor Vehicle Fuel Tax Forecast
Overview
Motor fuel tax collections for June 2021 through August 2021 came in only slightly above the June 2021 forecast
by $0.5 million or 0.1 %. Gasoline tax collections lagged the June projection by $2.5 million or 0.7%. Diesel collections
came in above projections by $3.0 million or 3% for the three-month total.
For the 2021-2023 biennium, gross fuel collections are estimated at $3.398 billion. This is $406 thousand above
below the June 2021 estimate. The gain in total revenue is due to higher special fuels collections. Total fuel tax revenue
for the 10-year period beginning in the current biennium and ending in the 2029-2031 biennium is $17.751 billion. This is
$17.689 million less than projected in the June 2021 forecast. Current fuel tax revenue estimates are higher throughout
the forecast horizon especially in the current and next biennium. In the long run, the gain in special fuels estimate is
insufficient to counter the downward revision to gasoline.
Primary Reasons for Changes in the September 2021 Forecast
Gasoline annual consumption in FY 2022 is expected to be up 6% year over year which is lower than the last forecast by
0.4%. In FY 2023, gasoline consumption is projected to bounce back with an annual growth of 2.2%, down 0.6% from the
last forecast. Forecasts from FY2023 to FY2031 have been revised down an average of 0.4%. We have become less
optimistic about the economic “bounce back” in the near term and have revised the gasoline forecast 0.3% downward in
FY 2022 and 0.6% downward in FY 2023 since June. Many firms such as Microsoft have delayed their return to the office
Adopted 18 September 22, 2021due to the Delta variant. In June we noted that telecommuting should be especially pronounced in Washington; the state
has a more sophisticated job base than the U.S. as a whole and is therefore more amenable to telecommuting.
The special fuels forecast has been revised up 1% from June. We had expected growth in this revenue source to
benefit more from pandemic driven shifts from consuming experiences (such as going to dinner) to purchasing things. IHS
notes that “Recent strength in retail sales reflected emphasis on spending for goods instead of services in the face of
increased concern about the spread of the virus.” Diesel consumption is up by 1% in the current biennium and that
forecast to forecast increase diminishes some over the forecast horizon.
Off-road gasoline refunds have been revised downward in FY 2021 which resulted in a $5.7 million or 9% decline
for the 2019-21 biennium due to low collection reports at the end of the fiscal year. In the current biennium, off-road
refunds commensurate with the forecast of reduced consumption but this will be examined further once additional DOL
reports are made available. Off-road gasoline refunds will amount to about 2.4% of revenues each year and this
assumption is unchanged since June. Special fuels off-road vehicles refunds have been increased due to higher actual
refunds in FY 2021 than anticipated in June and due to an increase in diesel consumption. In addition, refunds are
forecast to be 4.9% of revenues, a slight increase over the last quarter estimate.
Tribal gas tax refunds came in higher at the end of FY 2021 than anticipated in June by $1.9 million. The current
biennium tribal gas tax refunds were revised downward by 1.6% or $1.5 million due to re-examining the growth rate for
tribal refunds and the reduced estimate in gas consumption. The tribal gas tax refunds year over year growth, we expect
in FY2022 is 5.8% increase which commensurate with the recovery in travel. The tribal retail gasoline industry seems to
be in a mature phase with growth a function of gasoline demand rather than station expansion. In contrast to tribal gas tax
refunds, special fuel tax tribal refunds have a big revision upward due to activity which has exploded in FY2021, growing
by roughly a third. In the current biennium, we raised the special fuel tax tribal refunds by $6.64 million or 46% from the
June estimate. Each subsequent biennia, we increased the tribal special fuel tax refunds by more than 50%.
Motor Vehicle Revenue (Licenses, Permits, and Fees)
Overview
Vehicle related forecasts fall into two main categories: motor vehicle registrations and license plate-related fees.
This forecast has a variety of small fees, but the majority of the revenue is from registration-based fees. There are five
main economic drivers for the vehicle licenses, permits, and fees (LPF) forecast: Washington population and net
migration, Washington real personal income, Washington Retail Employment, Washington - U.S. real income share, and
U.S. sales of light vehicles.
Washington State collected $1.6 billion in licenses, permits and fees (LPFs) revenue in the 2019-21 biennium,
which is slight revision upward of $4.5 million from June’s forecast. Now we anticipate collecting about $1.78 billion from
LPFs in the 2021-2023 biennium, which is decreased by $8.8 million or 0.49% compared to the forecast in June. By the
end of the forecast horizon, the LPF forecast is anticipated to be $2.1 billion by 2029-2031 biennium, which is up for about
$13 million or 0.61% from the previous forecast. Over the 10-year period from 2019-2021 biennium to 2027-2029
biennium, the revenue increase is $20 million.
Primary reasons for the change in the September 2021 forecast
• For the fiscal year 2022, passenger car registrations are up 1.6% or 88,000 vehicles comparing to the previous
forecast. For FY 2023, passenger car registrations will be 1.9% more than the previous forecast. The forecast
remains higher in the future years from 2024 through 2031, however, the forecast to forecast difference will get
smaller in the out years. The increased forecast of registrations is mainly due to the higher passenger car actuals
we received for the last 3 months.
• For the fiscal year 2022, truck registrations are increased by 2.6% or 46,200 vehicles comparing the June
forecast. In fiscal year 2023, truck registrations will increase from the previous forecast by 2.6% as well. After
that, the truck forecast will keep seeing a forecast-to-forecast increase in registrations for the rest years. By the
end of the forecast horizon, we see an increase of truck registrations by 2.66%. The increased forecast
registrations are mainly due to the higher truck actuals we received for the last 3 months, and the higher
employment growth rate forecasted by ERFC.
Adopted 19 September 22, 2021• In the 2021-23 biennium, $30 registrations revenue is down 2.2% or $8.5 million. This is because instead of using
$30 to calculate the registrations revenue, we are using the $29 realized rate in the calculation from this revenue
source forecast. In the next biennium, revenue from $30 registrations is about $5.5 million less than the previous
forecast. This trend continues in the later periods. We see the revenue change being about $2.5 million below the
previous forecast by the 2029-2031 biennium due to the reduced realized rate for the passenger cars and other
$30 vehicles.
• In the 2021-23 biennium, the forecast has a decrease in the combined truck weight revenue by $4.3 million or
0.8%. This is because we reduced the prorate vehicle forecast in September. In next biennium, truck weight
revenue is about $3 million less than the previous forecast due to the reduced prorate vehicle forecast. The
revenue decrease keeps going on in later forecast periods. By the end of the forecast horizon, we will see a $3
million decreased revenue in 2029-2031 biennium for truck weight fees.
• In the 2021-23 biennium, the Freight Project fee is about $1.76 million or 4.2% less than the previous forecast due
to the decreased prorate vehicle forecast and lower actuals in FY 2021. In the 2023-25 biennium, the Freight
Project fee is $1.4 million less than the June forecast. This revenue decrease keeps steady in the out years. By
the end of this forecast horizon, we will see a $1.4 million freight project revenue reduction in 2029-2031
biennium.
• The passenger vehicle weight revenue is increased by $3.9 million or 0.95% in the 2021-23 biennium, which is
due to the increased passenger car forecast. In the 2023-25 biennium, the revenue is up for $9.5 million. The
revenue increase gradually goes bigger in the out years. By the end of this forecast horizon, we will see a $15.1
million passenger vehicle weight revenue increase in 2029-2031 biennium.
• In this forecast, the motor home weight revenue is decreased for $0.1 million in the 2021-23 biennium due to the
current fiscal year first two months motor home weight fee actuals did not pick up as much as we forecasted.
However, the revenue is increased in the out years due to the increased motor home registrations. By the end of
this forecast, we will see a $0.1 million motor home weight revenue increase in 2029-2031 biennium.
• Electric battery and plug-in battery vehicles Electrical vehicles paying $225 fee revenue for the closed biennium is
0.93% higher than expected due to strong actuals and data revision. Revenue for current biennium is revised up
by 4.61% or $0.9 million. The 10-year total is up 3.3%.
• The hybrid vehicles paying $75 fee closed 0.78% or $131k higher for the FY19-21 biennium. The current
biennium revenue is up 5.21% or $1.1M. The ten-year total revenue is up by 4.9%.
• Title Fee FY19-21 revenue closed 0.49% or $357k higher. The forecast is tracking well. Global Insight light
vehicle sales variable adjustment resulted in -0.14% or -$105k current biennia and no changes for the rest of the
forecasting period.
• Ferry Service Fee (18J) Title service fee closed the FY19-21 biennium -0.93% or -$142K. Current biennium
change is -0.41% or -$66k. Over the 10-year period, the change is -0.27%. Registration service fees closed the
FY19-20 biennium -0.21% or -$68k. The current biennium revenue change is 0.1% or $35k. Over the 10 years
period, the change is 0.52%.
• DOL Service Fees (201) and License Plate Technology (06T): DOL Service Fees (201) and License Plate
Technology (06T) forecasts have increased in line with the vehicle and vessel forecasts following several months
of strong performance. The average increase is 2.5% across the forecast period. This will increase 2021-2023
biennial revenue $76,000 for fund 201, and $38,000 for fund 06T. Total forecast increases fund 201 revenues by
nearly $1 million through FY 2031 and increases fund 06T revenues by $485,000 through FY 2031.
• Intermittent use Trailers: The Intermittent use Trailers forecast has decreased -$54,000 (-3.5%) for the 2021-2023
biennium, -$110,000 (-4.9%) for the 2023-2025 biennium and -$733,000 (-5.7%) across the forecast period. This
decrease is the result of transactions failing to meet the previous forecast growth projection. Intermittent use
trailers are a new class which appear to be approaching their normalized growth rate more quickly than previously
forecast. While the forecast continues to expect year on year growth, the growth is slower in the out years than
the years past.
• Wheeled All-Terrain Vehicle (WATV) On-Road forecast ended higher for FY 2019-21 by $19,845 or 5.4%. This
forecast continues higher by $30,900 or 7.2% on average per biennium throughout the forecast horizon based on
historic trend for these transactions.
Adopted 20 September 22, 2021Driver Related Revenue Forecasts
Overview
The September 2021 forecast of driver related revenue projected by the Department of Licensing includes the
following revenues: driver license fees (including commercial driver licenses, enhanced driver licenses, and
temporary restricted licenses), ID card fees, driver exam application fees, copies of records, motorcycle operator
fees, ignition interlock fees, and other miscellaneous fees. The miscellaneous fees include limousine licenses,
fines and forfeitures, and driver school instructor license fees. These driver-related fees are deposited into the
Highway Safety Fund (HSF), Motorcycle Safety Education Account (MSEA), the State Patrol Highway Account
(SPHA), and Ignition Interlock Revolving Account (IIRA).
All driver-related revenue for FY2019-2021 is closed at $289.5 million, up by $0.65 million (0.2%). FY2021-23
biennium is forecasted at $317.6 million, down by $0.4 million (-0.1%) from the prior forecast. Over the next ten-
year period (FY22-FY31), driver related revenues total $1,654.1 million, up about $9.5 million (0.6%) from the
prior forecast.
It is important to note that with SHB1207 passed in the 2021 legislative session, DOL will offer eight-year license
and ID cards, along with the existing six-year license and IDs, depending on customer choice. Driver and ID
renewals will follow either a six- or eight-year renewal cycle, with variable extensions through FY28 to smooth the
workload and revenue. Caution is advised in year over year comparisons.
Primary reasons for the changes in the September 2021 forecast
• Original Licenses ended FY 2019-21 higher than the June forecast by 3,349 or 1.2%. The original
transactions are slightly lower by -2,300 or -0.4% on average per biennia throughout the rest of the forecast
horizon. This forecast has been updated with the Nonfarm Employment and Driver-In variables.
• License Renewals ended FY 2019-21 lower than the June forecast by -10,325 or -1%. The renewal
transactions are overall slightly lower by -1,600 or -0.1% on average per biennia throughout the rest of the
forecast horizon.
• Identicards revenue are adjusted up about 2% due to higher actuals.
• Incorporation of ESSB5226 (sec 13) additional $1.00 fee to all issuances of driver licenses, ID’s. The
impact is an average of $1.2 million additional revenue per year to the Highway Safety Fund.
Other Transportation Related Revenue Forecast
Overview
This category of transportation related revenue forecasts consists of four primary components: vehicle sales and
use taxes, rental car sales taxes, studded tire fees, business and other revenue and aeronautics revenue. The business
and other revenue category includes the following revenue sources:
• Sales of property
• WSP and DOT services and publications and documents
• Filing fees and legal services
• Property management
• Access Permits (Highways)
• Outdoor Advertising
• Other revenues
State Patrol Highway Account miscellaneous revenue consists of ACCESS fees (fees charged for usage of our
statewide law enforcement telecommunications system), Breathalyzer Test fines, DUI Cost Reimbursement, Commercial
Vehicle Penalties and Communication Tower Site Leases and Terminal Safety Inspection fees.
Adopted 21 September 22, 2021You can also read