The Economic Impact of the Seafood Sector at Ireland's Main Ports
←
→
Page content transcription
If your browser does not render page correctly, please read the page content below
The Economic Impact
of the Seafood Sector
at Ireland’s Main Ports
Oxford Economics was founded in 1981 as a commercial venture with Oxford
University’s business college to provide economic forecasting and modelling
to UK companies and financial institutions expanding abroad. Since then, we
have become one of the world’s foremost independent global advisory firms,
providing reports, forecasts and analytical tools on more than 200 countries,
250 industrial sectors, and 7,000 cities and regions. Our best-in-class global
economic and industry models and analytical tools give us an unparalleled
ability to forecast external market trends and assess their economic,
social and business impact.

Headquartered in Oxford, England, with regional centres in London,
New York, and Singapore, Oxford Economics has offices across the globe in
Belfast, Boston, Cape Town, Chicago, Dubai, Frankfurt, Hong Kong, Houston,
Johannesburg, Los Angeles, Melbourne, Mexico City, Milan, Paris, Philadelphia,
Sydney, Tokyo, and Toronto. We employ 400 full-time staff, including more than
250 professional economists, industry experts and business editors – one of
the largest teams of macroeconomists and thought leadership specialists. Our
global team is highly skilled in a full range of research techniques and thought
leadership capabilities, from econometric modelling, scenario framing, and
economic impact analysis to market surveys, case studies, expert panels,
and web analytics.

Oxford Economics is a key adviser to corporate, financial and government
decision-makers and thought leaders. Our worldwide client base now comprises
over 1,500 international organisations, including leading multinational
companies and financial institutions; key government bodies and trade
associations; and top universities, consultancies, and think tanks.

August 2019

All data shown in tables and charts are Oxford Economics’ own data, except
where otherwise stated and cited in footnotes, and are copyright © Oxford
Economics Ltd.

This report is confidential to Bord Iascaigh Mhara and may not be published
or distributed without their prior written permission.

The modelling and results presented here are based on information provided
by third parties, upon which Oxford Economics has relied in producing its report
and forecasts in good faith. Any subsequent revision or update of those data
will affect the assessments and projections shown.

To discuss the report further please contact:

Neil McCullough: nmccullough@oxfordeconomics.com
Oxford Economics, Lagan House, Sackville Street, Lisburn, BT27 4AB, UK
Tel: +44 28 9263 5400

Table of     Foreword

contents     02   Foreword

             Executive summary
             03   Executive Summary

             1. Introduction
             05   1.1 About this study
             05   1.2 The seafood sector at the ports
             07   1.3 The key elements of the seafood sector
             09   1.4 Report structure

             2. The seafood sector at the ports
             10   2.1 The port economies and the seafood sector
             12   2.2 Seafood’s main components
             16   2.3 Understanding the local seafood sector

             3. The impact of commercial fishing
             25   3.1 Ireland estimates
             27   3.2 Regional estimates
             29   3.3 Taxation estimates

             4. The impact of aquaculture
             32   4.1 Ireland estimates
             33   4.2 Regional estimates
             35   4.3 Taxation estimates

             5. The impact of fish processing
             38   5.1 Ireland estimates
             40   5.2 Regional estimates
             42   5.3 Taxation estimates

             6. Total impact of the overall ports’ seafood sector
             44   6.1 Seafood sector activity at the ports
             44   6.2 Ireland estimates
             46   6.3 Regional estimates
             49   6.4 Taxation estimates

             7. Conclusions
             51   7.1 The seafood sector in Ireland’s 10 main ports
             51   7.2 Fish processing provides the greatest supply chain benefit
             51   7.3 Commercial fishing is the most prominent seafood employer
             52   7.4 Aquaculture is a significant segment of the ports’ seafood sector
             52   7.5 The seafood sector makes significant contributions to peripheral economies

Appendix 1   Model approach
             53   Understanding economic impact assessments
             54   Estimating the direct economic contribution
             55   Estimating indirect and induced impacts
             56   Overcoming double-counting

Appendix 2   Socio-economic analysis of the port economies
             57   Economic activity
             58   Demographics
             60   Economic structure
             61   Economic opportunity and deprivation
             63   Summary

                                                                                                   1
Foreword
The Economic Impact of the Seafood Sector at Ireland’s Main Ports
This report reveals the results of the project to evaluate Irelands’ top ten seafood ports and assess the
importance of the seafood sector directly and downstream in these ports, their hinterlands and at the regional
and national levels. The seafood sector is a primary driver of rural economies around the coastline of Ireland
and acts as an anchor in these locations around which other supporting service sectors develop. In many of the
ports and hinterlands assessed in this study, common characteristics describe regions of poor agriculture land,
at significant distance from major urban settlements, with low levels of transport connectivity. Opportunities in
agriculture are low while there is a lack of factors to attract industry to these locations. Nevertheless, each of
these ports are located in areas of remarkable natural beauty and stunning landscapes. For these reasons, these
areas are highly dependent on the seafood and tourism sectors.
The 10 ports selected here are the ports with the highest volume and value of seafood landings in Ireland and
are located all around the coastline in the north-east, east, south-east, south-west, west and north-west corners
of the island. The hinterlands around these ports were designated as the local zones of influence of these ports
through dialogue with local stakeholders and to capture all the major seafood activity in the localities. Significant
levels of aquaculture and fish processing activity are captured in these areas (35% and 45% respectively) while
three-quarters of the volume and value of Irish fleet landings are landed in these ports.
All data used in this project is sourced from the telephone surveys of seafood producers inside and outside
the port hinterlands combined with CSO Census data. From 859 producers identified within the port areas, 435
participated in the survey, a return rate of 50%. BIM would like to thank all participants in this survey for their
time and in delivering such a high response rate for this survey. Many thanks are due to all local stakeholders
that provided their time and knowledge throughout this project and assisted in delivering this high level of
participation. The project manager Richard Curtin, BIM, would like to recognise the excellent work carried out by
Oxford Economics and Perceptive Insight in the course of this project.
2 BIM The Economic Impact of the Seafood Sector at Ireland’s Main PortsExecutive summary
The Irish seafood sector is an important component of the Irish economy.
In particular, the process of acquiring seafood from the waters surrounding
Ireland’s coastline, and then its subsequent processing, play a crucial role in
some of the country’s more peripheral economies.
To shed new light on the full impact of the industry at both national and
local level, Bord Iascaigh Mhara (BIM) commissioned Oxford Economics and
Perceptive Insight to assess the economic impact of the seafood sector at 10 of 8,445 Jobs
Ireland’s most prominent ports, ranging from Howth – the largest of these port Total employment
sustained across Ireland
economies – down to Dunmore East.
through the seafood
activity at its 10
For each port, our analysis considers three key seafood-related activities:
main ports.
l commercial fishing;
l aquaculture; and
l fish processing.
This executive summary sets out our key findings in terms of total contributions to GDP, jobs, wages and tax
revenues in 2018. Our analysis includes the estimated impact of economic activity in the seafood sector’s supply
chain (indirect impact), and also wage-related spending in the wider consumer economy (induced impact).
The seafood sector’s impact on the national economy
Commercial fishing, aquaculture and fish processing at the 10 ports bring substantial economic benefits to the
Irish economy as a whole. When the direct, indirect and induced impacts are combined, we calculate that seafood
activity related to the 10 ports sustained a total of 8,445 jobs throughout Ireland in 2018, paying wages
worth €267 million.
We also find that this activity generated a total contribution to Ireland’s GDP of €646 million and
provided fiscal benefits estimated at €56 million. Fig. 1 shows how these national totals are divided between
the direct, indirect, and induced impacts.
Fig. 1: Combined economic benefits of the 10 ports’ seafood activity, 2018
Ports seafood sector Ireland
GVA (€m) Employment Wages (€m)
Direct 366 4,775 136
Indirect 195 2,695 91
Induced 86 970 39
Total 646 8,445 267
Source: Oxford Economics, Perceptive Insight, CSO
Note: May not sum due to rounding
3The seafood sector’s impact on local Irish economies
In terms of GVA, employment, and wages, we see that the ports’ seafood sector
makes an economic contribution in all eight NUTS3 regions of Ireland – even
those with no direct port presence. None of the 10 ports fall within the midlands
or mid-west, but these regions still receive some of the benefits via supply chain
and subsequent consumer spending.
€267m
We estimate that these overall economic benefits are largest in the border and Wages sustained
south-west regions (see Fig. 2). Between them, these regions are home to five The Border and South-West
of the 10 ports included in our analysis, including two of the largest ports in regions enjoyed a significant
terms of seafood sector activity: Killybegs (border) and Castletownbere (south- share of the wages sustained
by the sector.
west). As a result, the border and south-west regions account for over two-thirds
of the seafood related turnover generated across the 10 ports.
Fig. 2: Estimated benefits of the ports’ seafood sector by NUTS3 regions
Ports seafood sector Model output summary
GVA (€m) Employment Wages (€m)
Border 199 2,440 81
West 45 765 20
Mid-West 8 120 4
Mid-East 48 540 25
South-West 177 2,475 66
South-East 79 1,140 33
Dublin 86 855 32
Midlands 6 105 4
Total 646 8,445 267
Source: Oxford Economics, Perceptive Insight, CSO
Note: May not sum due to rounding
These wide-ranging local impacts are especially important given that the port
economies are not affluent areas, relative to the national average. While their
unemployment rates are broadly below average, this hides weak employment €646m
opportunities (with net out-commuting a common trend) and relatively high GVA sustained
rates of economic inactivity. In addition, the outlook for the port economies The economic benefits
is likely to be challenging given their sectoral structure, demographic trends, associated with the ports’
and stock of skills. Therefore, a vibrant and growing local seafood sector is seafood sector were
important for the economic and demographic health of these areas. estimated to be largest in
the Border and South-West.
The impact of each seafood sub-sector
We are also able to break down the total impact of the seafood sector across the 10 ports into each of its three
sub-sectors. Our headline findings for each are:
l Activity in the commercial fishing sub-sector is estimated to have sustained 3,520 jobs, €112 million of
wages, and made a €277 million contribution to the national economy in 2018.
l Activity in the aquaculture sub-sector sustained 1,230 jobs, €35 million of wages, and a €86 million
contribution to the economy.
l The fish processing sub-sector sustained 4,355 jobs, €145 million of wages, and contributed €347 million to
the Irish economy.1
1 Summing the benefits of all three sub-sectors within our definition of the seafood sector (commercial fishing, aquaculture
and fish processing) will overestimate the indirect and induced impacts, and as a result, overall impacts. This is because the
supply chain of the processing sub-sector will likely contain a proportion of the port’s fishing sub-sector and its supply chain.
To get the direct totals (for employment, GVA and wages), we add all three sub-sectors. However, for the indirect and induced
totals, we sum those of the processing sub-sector with a proportionate share of the fishing and aquaculture (according to
the proportion of sales not destined for local processors and informed by the survey exercise). The remainder of the fishing
and aquaculture indirect and induced impacts will already be accounted for within that of the processors.
4 BIM The Economic Impact of the Seafood Sector at Ireland’s Main Ports1. Introduction
1.1 About this study
The Irish seafood sector is an important component of the Irish economy. It is, however, more important to
coastal communities around the country given its concentration at Ireland’s ports and the relatively lower level of
alternative economic activity in these economies. In addition, as economic and employment growth is increasingly
driven by office-based activity which favours urban areas, the seafood sector’s role in providing labour market
opportunities, wages and local demand in these local areas is arguably rising.
Against this backdrop, Bord Iascaigh Mhara (BIM) commissioned Oxford Economics and Perceptive Insight to
estimate the economic contribution of the seafood sector in 10 of Ireland’s ports.
1.2 The seafood sector at the ports
This report concentrates on the seafood sector at 10 of Ireland’s most prominent ports and goes on to show the
economic benefit this sector supports within the Irish economy.2 Although these port areas vary in a number of
respects (see the socio-economic section in Appendix 2), the local seafood sector remains a mainstay of these
local economies. The port economies are widely dispersed throughout the island and are found in six of Ireland’s
eight regional authority areas.3 Our analysis will lay out how the seafood sector at the ports impacts each of
these ‘local’ areas, in addition to the country as a whole.
Fig. 3: Port areas and their regions
Port area NUTS3 region
An Daingean South-West
Castletownbere South-West
Clogherhead Mid-East
Dunmore East South-East
Greencastle Border
Howth Dublin
Killybegs Border
Kilmore Quay South-East
Ros an Mhíl West
Union Hall South-West
Source: CSO
To inform the analysis, a comprehensive seafood-related survey exercise was carried out across Ireland’s main
ports. We worked closely with BIM in order to, firstly, understand the seafood population at each of the 10 ports.
Following this, the market research firm Perceptive Insight collected information concerning the characteristics of
the local seafood sector through both telephone and electronic surveys.
2 A port area refers to the port itself and its hinterland area. This in turn is defined as the port’s own district electoral division
area (DED) as well as those surrounding it and constituting its hinterland (informed by BIM) – see Fig. 4.
3 All references to ‘Ireland’ and seafood’s economic benefits are attributable to the Republic of Ireland i.e. excludes Northern
Ireland.
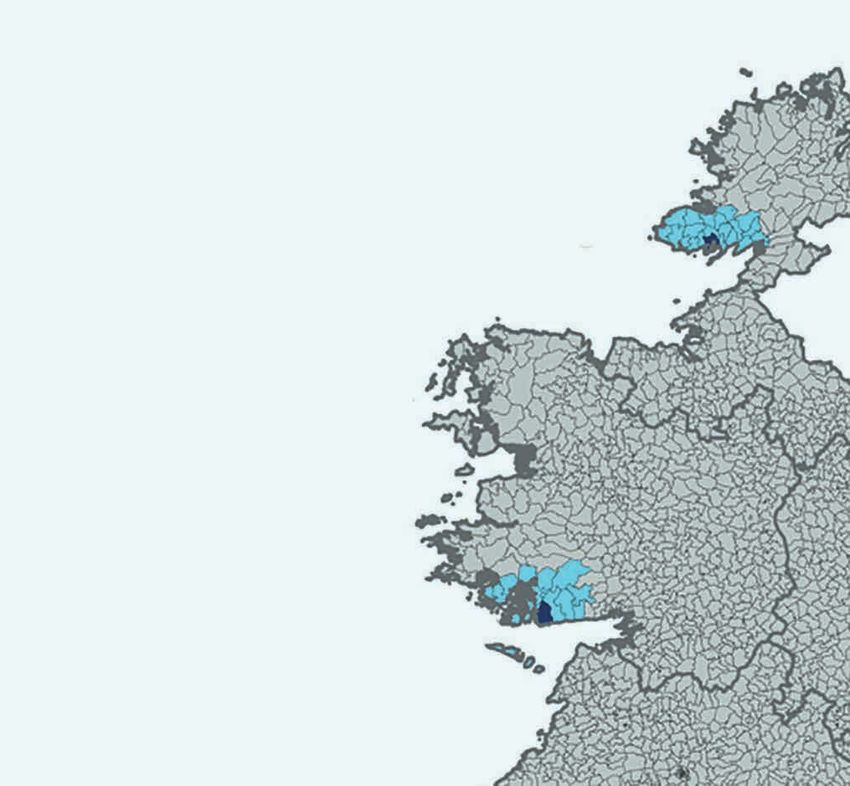
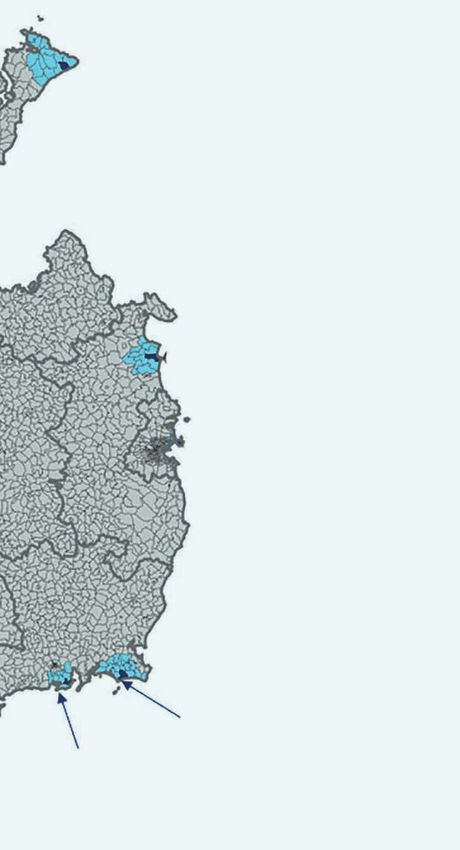
5Fig. 4: Port areas throughout Ireland
Port Hinterland DEDs
Port DED Greencastle, Border
Other
Killybegs, Border
Clogherhead, Mid-East
Howth, Dublin
Ros an Mhíl, West
An Daingean, South-West
Kilmore Quay, South-East
Dunmore East, South-East
Castletownbere, South-West
Union Hall, South-West
In total, there were close to 470 individual responses from seafood-related businesses across Ireland. Of this
total, close to 330 unique responses were recorded from seafood operators based within the 10 port areas – a
response rate of close to 40%, relative to the known seafood population.
Fig. 5: Survey participation by sub-sector
Commercial fishing Aquaculture Fish processing Total
Survey responses:
Port areas 280 21 27 328
Outside study areas 54 77 8 139
BIM seafood population 676 120 63 859
Ports’ response rate: 41% 18% 43% 38%
Source: Oxford Economics, Perceptive Insight, BIM
As one of the largest and more diverse seafood sub-sectors, it was important that the survey captured a broad
representation of the commercial fishing industry across the ports. Most fleet segment categories demonstrated
strong participation rates within the survey, with the pelagic and general polyvalent segments being particularly
well represented.
6 BIM The Economic Impact of the Seafood Sector at Ireland’s Main PortsFig. 6: Survey participation within commercial fishing by fleet segment
Fleet segment Survey responses Share of population
Aquaculture 0 0%
Beamer 1 33%
Pelagic 12 57%
Polyvalent general 199 40%
Polyvalent potting 26 30%
Specific 21 36%
Unknown 21 -
Total 280 41%
Source: Oxford Economics, Perceptive Insight, BIM
Furthermore, participation rates across vessel size categories were above a third in most instances. Indeed, the
survey response rates among the larger vessel businesses were the strongest across all length classes. Over 50%
of the ports’ 18 metre plus fishing population participated with the study.
Fig. 7: Survey participation within commercial fishing by length class
Length class Survey responses Share of population
VL0010 148 33%
VL1012 35 44%
VL1218 15 50%
VL1824 26 55%
VL2440 24 57%
VL40XX 11 58%
Unknown 21 -
Total 280 41%
Source: Oxford Economics, Perceptive Insight, BIM
1.3 The key elements of the seafood sector
In order to quantify the seafood sector’s contribution to both the regional and national economies, we first
need to understand its components. Our analysis, therefore, estimates the direct activity associated with the
commercial fishing, aquaculture and fish processing sub-sectors at each of the ports by drawing on the survey
findings and information held by BIM. We then estimate their wider impacts within their local NUTS3 regions and
the broader Irish economy. These wider impacts include those associated with the seafood sector’s supply chain
and the consumer spending of those employed as a result of the direct and indirect activity – see Box 1 for more
detail of our methodology.
7BOX 1: INTRODUCING ECONOMIC IMPACT ANALYSIS
The economic impact of a sector is measured using a standard means of analysis called an economic
impact assessment. The report quantifies the three ‘core’ channels of impact that comprise an
organisation/sector’s ‘economic footprint’:
l Direct impact, which is the economic activity the seafood sector generates because of its operations;
l Indirect impact, or supply chain impact, that occurs because the sector buys inputs of goods and
services from Irish businesses; and the
l Induced impact, which relates to the wider economic benefits that arise when employees of the local
seafood sector and its supply chain spend their wages in the consumer economy, for example, in local
retail establishments.
We analyse these channels of impact using three core metrics:
l Employment, measured on a Full-Time Equivalent (FTE) headcount basis. This is comprised of both full-
time employment and a proportion of part-time working component – where two part-time roles equate
to a full-time position;
l Gross value added contribution to GDP; and,
l Tax receipts generated by the Irish activity and employment supported by the seafood sector.
Fig. 8: Economic impact assessment
A company or sector employs lots
Direct
of staff. Its operations generate
Impact
GDP and tax for the authorities.
+
Indirect
Impact
It also spends money with
suppliers who employ staff,
generate GDP and pay taxes.
They use other suppliers in turn.
+
Induced
Impact
Employees (including of the
suppliers) spend their wages in the
wider economy, generating more
GDP, jobs and tax revenues.
Added together, these three effects: direct, indirect, induced – comprise the total economic impact of the company or sector.
Total
Impact
8 BIM The Economic Impact of the Seafood Sector at Ireland’s Main PortsOur analysis is also careful to identify where the three different seafood sub-sectors appear in the supply chains
of the other sub-sectors. The most obvious example is commercial fishing appearing within the supply chain of
processing. Our analysis has isolated the benefits to avoid instances of double-counting (see Appendix 1 of this
report).
1.4 Report structure
This report breaks down the characteristics of the collective seafood sector within the port areas. It then goes on
to show the economic impact this activity creates across the Irish economy.
The report takes the following structure:
l An analysis of the seafood activity across the 10 port economies;
l A breakdown of the economic benefits associated with the commercial fishing sub-sector at the national and
regional level;
l A breakdown of the economic benefits associated with the aquaculture sub-sector at the national and
regional level;
l A breakdown of the economic benefits associated with the fish processing sub-sector at the national and
regional level;
l A summary of the overall benefit associated with the ports’ seafood sector at the national and regional level;
and
l Finally, we present the report’s conclusions.
This report is accompanied by a further 10 reports that provide analysis for each individual port covered in the
study.
92. The seafood sector at the
ports
2.1 The port economies and the seafood sector
Before we present the total benefits associated with the ports’ seafood sector, it is important to first understand
the size and characteristics of the local port area economies. The latest Census (2016) provided workplace
employment data at a sectoral level for small area workplace zones across Ireland. By combining this employment
data with our regional productivity estimates we can quantify the economic footprint of the port economies. We
therefore estimate that the combined port economies made a GVA contribution to GDP of €4.1 billion in 2018.4
Howth was by far the largest of the port area economies. This Dublin based port area supported employment of
close to 9,600 people and an estimated €1.1 billion in GVA. This was close to twice that of Killybegs – the second
largest of the 10 port areas with 4,750 people employed locally and GVA of €555 million.
Fig. 9: Port economy size comparisons, 2018
Howth
Killybegs
Clogherhead
Ros an Mhíl
An Daingean
Greencastle
Castletownbere
Union Hall
Kilmore Quay
Dunmore East
0 200 400 600 800 1,000 1,200
GVA (€m)
Source: Oxford Economics, CSO, Perceptive Insight
As expected, the seafood sector accounts for a significant proportion of the local economy within each port
area. We estimate that the seafood sector across the 10 port areas directly generated €366 million in GVA in
2018. Seafood, therefore, directly accounted for approximately 9% of the economy across the ports, just behind
‘Professional services’ and the ‘Education, health & social work’ sector with shares of 16% and 13% respectively.
4 When estimating the size of the port economies we use the most recent workplace sectoral employment data from the 2016
Census. This employment data relates to workplace zones, which are slightly smaller than DEDs. The workplace zones are
therefore mapped across to closely represent the DEDs which cover to the port areas. We then supplement this data with the
current snapshot of the local seafood sector as estimated through the survey exercise. Finally, we subtract the commercial
fishing and aquaculture activity from the broader ‘Agriculture, forestry & fishing’ sector to get an indication of its prominence
locally. A similar approach is adopted with fish processing in relation to the ‘Manufacturing, mining & utilities’ sector.
10 BIM The Economic Impact of the Seafood Sector at Ireland’s Main PortsFig. 10: Collective port area’s estimated GVA by sector, 2018
2%
5% 5% Fishing/Aquaculture
4% Rest of Agriculture, forestry & fishing
13%
Fish processing/Seafood manufacturing
2%
Rest of Manufacturing, mining & utilities
Construction
SHARE OF 26%
Trade, hospitality & transport
TOTAL
16% Professional services
Public administration & defence
Education, health & social work
5%
Arts, entertainment & other services
22%
Source: Oxford Economics, Perceptive Insight, BIM, CSO
In employment terms, seafood is even more important within the port economies. Combined commercial fishing,
aquaculture and fish processing are estimated to directly sustain approximately 11% of workplace employment
across the port areas in 2018.5 Furthermore, fishing and aquaculture represented close to two-thirds of local
agriculture, forestry & fishing related employment and fish processing accounted for 30% of local Manufacturing,
mining & utilities jobs.
Fig. 11: Collective port areas’ employment by sector, 2018
6% Fishing/Aquaculture
7%
4% Rest of Agriculture, forestry & fishing
4% Fish processing/Seafood manufacturing
21%
Rest of Manufacturing, mining & utilities
9%
Construction
SHARE OF
Trade, hospitality & transport
3% TOTAL
9% Professional services
Public administration & defence
12%
Education, health & social work
Arts, entertainment & other services
24%
Source: Oxford Economics, Perceptive Insight, BIM, CSO
5 The latest available sectoral employment data for the port area economies was for 2016. Therefore, both the GVA and
employment estimates shown for the port economies combine this data with the current snapshot of the seafood sector.
112.2 Seafood’s main components
All three of the seafood sub-sector’s make a significant contribution within the port economies. Using the results
from the survey exercise and published sectoral data, we estimate that seafood related businesses directly
provided 4,775 jobs, €136 million in wages and generated €856 million in turnover within the port economies –
see Fig. 12.
Fig. 12: Seafood’s sub-sector activity, all port areas, 2018
Turnover (€m) Jobs Wages (€m)
Commercial fishing 287 2,275 63
Aquaculture 97 795 19
Fish processing 473 1,705 55
Total 856 4,775 136
Source: Oxford Economics, Perceptive Insight, BIM
2.2.1 Commercial fishing
Commercial fishing is the second largest seafood sub-sector across the 10 port areas. Fishing is estimated to
account for a third of the sector’s total turnover across the ports, less than the fish processing sub-sector (€473
million), but larger than aquaculture (€97 million).
Fig. 13: Seafood sector turnover, all port areas, 2018
287
Commercial fishing
€ MILLIONS Aquaculture
473
Fish processing
97
Source: Oxford Economics, Perceptive Insight, BIM
Commercial fishing activities are present across each of the 10 port areas. Killybegs has the largest commercial
fishing sector, generating an estimated €73 million of turnover in 2018 (or 25% of the total), followed by
Castletownbere (€61 million) and Kilmore Quay (€36 million).
Although it was the smallest in turnover terms, Dunmore East’s seafood sector has a strong reliance on
commercial fishing (€7.4 million) within its seafood sector. Almost two-thirds (65%) of all seafood sector activity
in this port is driven by commercial fishing. Only Greencastle showed a stronger dependency on this sub-sector
where it accounted for 67% of seafood related turnover.
12 BIM The Economic Impact of the Seafood Sector at Ireland’s Main PortsFig. 14: Commercial fishing turnover, port areas, 2018
15 8 An Daingean
9
Castletownbere
36 61 Clogherhead
Dunmore East
Greencastle
€ MILLIONS Howth
20
Killybegs
73 7 Kilmore Quay
Ros an Mhíl
31
Union Hall
26
Source: Oxford Economics, Perceptive Insight, BIM
The 2,275 direct jobs in commercial fishing across the 10 port areas equates to approximately 5% of overall
workplace employment.6 Although second to Killybegs in terms of turnover, Castletownbere is the largest
employer in commercial fishing activities, 560 jobs, or almost a quarter of the collective ports’ fishing total.
Castletownbere’s commercial fishing employment also accounts for the largest share of local workforce jobs
within its port area, the equivalent to 17% of the total. Kilmore Quay (10.4%) is the only other port where
commercial fishing accounts for a tenth or more of all local jobs.
At the other end of the scale, port area economies such as Howth (2%) and An Daingean (3%) are proportionately
less reliant on commercial fishing activities for employment.
Fig. 15: Commercial fishing as a share of overall employment, port areas, 2018
50%
700 Share of employment (%)
600 40%
500
30%
400
Jobs
300 20%
200
10%
100
0 0%
ea
n re
ea
d st tle th eg
s ay híl Ha
ll
be Ea as w Qu M
ing n rh
or
e c Ho lil yb e n ion
Da to
w
gh
e en K or sa Un
An le lo nm re lm Ro
s t C D u G Ki
Ca
Jobs (LHS) Share of employment (RHS)
Source: Oxford Economics, Perceptive Insight, BIM
6 Again, these estimates adopt workplace employment for the port area available as of the 2016 Census and supplemented
with our survey estimates of the seafood sector in 2018.
132.2.2 Aquaculture
We estimate that aquaculture directly provided 795 jobs across the 10 port areas in 2018. Aquaculture is the
smallest of the three seafood sector activities, and as such, the bulk of activity tends to be focussed on a few
ports. Castletownbere alone accounts for a third of total aquaculture turnover across the ports (€30 million).
When considered alongside Ros an Mhíl and Killybegs, these three port areas account for almost 80% of
aquaculture’s turnover total. Howth recorded the smallest aquaculture sub-sector among the ports, not including
Clogherhead, which did not support any aquaculture related activity.
Although Ros an Mhíl’s aquaculture sector was only the second largest in turnover terms, it was proportionately
the most important. Just over a half of Ros an Mhíl’s total seafood related turnover belonged to the aquaculture
segment – over twice the share realised in Castletownbere (19%).
Fig. 16: Aquaculture turnover, port areas, 2018
2 An Daingean
6
Castletownbere
25 Clogherhead
Dunmore East
30 Greencastle
€ MILLIONS Howth
Killybegs
4
Kilmore Quay
Ros an Mhíl
3
19 Union Hall
7
Source: Oxford Economics, Perceptive Insight, BIM
Unsurprisingly, aquaculture jobs as a share of total was largest in Castletownbere, equivalent to 6% of the local
employment total (or 21% of the local seafood sector). Killybegs aquaculture sub-sector was the next largest in
employment terms, but only accounted for 3% of employment in its wider port area economy.
Fig. 17: Aquaculture as a share of overall employment, port areas, 2018
250 20%
Share of employment (%)
200
15%
150
10%
Jobs
100
5%
50
0 0%
ea
n re
ea
d st
st
le th eg
s
ua
y híl Ha
ll
g be h Ea ca
w b Q M
in n r re Ho lly e n ion
Da to
w he o ee
n Ki or sa Un
tle og m
Gr lm Ro
An s Cl D un K i
Ca
Jobs (LHS) Share of employment (RHS)
Source: Oxford Economics, Perceptive Insight, BIM
14 BIM The Economic Impact of the Seafood Sector at Ireland’s Main Ports2.2.3 Fish processing
Fish processing activity is present across all 10 ports. Killybegs is the strongest base for this activity, supporting
€163 million in turnover – the equivalent to over a third of the fish processing total across the 10 port areas. The
next largest fish processing ports are Castletownbere (€72 million), Union Hall (€61 million) and Howth (€58 million).
Fig. 18: Fish processing turnover, port areas, 2018
25 An Daingean
61
Castletownbere
72
15 Clogherhead
Dunmore East
41
Greencastle
29
€ MILLIONS Howth
1
9 Killybegs
Kilmore Quay
58
Ros an Mhíl
163
Union Hall
Source: Oxford Economics, Perceptive Insight, BIM
Fish processing is significantly important to Union Hall as it accounts for close to 80% of local seafood related
turnover. We estimate that the processing sub-sector supported 180 jobs locally in Union Hall and accounted
for 6% of the port area’s workforce jobs.7 Fish processing forms the next highest shares of seafood turnover
at Howth (69%) and Killybegs (64%) – the second largest and largest port employers in this activity. While
Howth supports a greater number of processing jobs (240) compared to Union Hall (180), the sub-sector only
accounted for just 2% of overall local employment. As illustrated previously, this is a result of the comparative size
differences between Howth’s economy and that of the other port areas.
Fig. 19: Fish processing as a share of overall employment, port areas, 2018
700 70%
600 60%
Share of employment (%)
500 50%
400 40%
Jobs
300 30%
200 20%
100 10%
0 0%
ea
n re
ea
d st tle th eg
s ay híl Ha
ll
be Ea as w Qu M
ing n rh
or
e c Ho lil yb e n ion
Da to
w
gh
e en K or sa Un
An le lo nm re lm Ro
s t C D u G Ki
Ca
Jobs (LHS) Share of employment (RHS)
Source: Oxford Economics, Perceptive Insight, BIM
7 Once again, we are comparing 2018 seafood estimates against the latest available (2016) publishing employment data for
the local port areas.
152.3 Understanding the local seafood sector
2.3.1 Turnover and growth
Evidently, the seafood sector accounts for a significant share of economic activity taking place within the port
areas. That said, turnover growth has been difficult to achieve for local seafood businesses. Only 12% of port
seafood respondents reported their turnover had increased over the previous year. The vast majority (72%) said
that turnover levels remained unchanged and 15% had recorded a fall. However, the results show significant
variation within the seafood sector itself. Almost a third of processor respondents noted turnover growth over
the previous year, compared to just 10% and 13% in commercial fishing and aquaculture respectively. Meanwhile,
close to a fifth of fishing respondents noted a fall in turnover over the same period. A similar pattern was evident
when respondents were asked how their workforce had grown over the last year. Over a third of processors
recorded an increase, compared to only 5% and 9% of aquaculture and commercial fishing respondents
respectively.
Fig. 20: Turnover growth in the recent year, port’s seafood sub-sectors, 2018
Share of respondents (n=358)
Fish processing
Aquaculture
Commercial fishing
0% 20% 40% 60% 80% 100%
Increased Stayed the same Decreased
Source: Oxford Economics, Perceptive Insight
Close to 80% of all respondents said they did not expect their turnover to change over the next 12-month period,
while only 12% again expected to see an increase. When we break down these results by sub-sector, we find
that fish processors are much more optimistic about their sales outlook in comparison to the aquaculture and
commercial fishing segments. Over half of processor respondents recorded an expectation for growth over the
next year, compared to just 7% of respondents in the commercial fishing sector.
16 BIM The Economic Impact of the Seafood Sector at Ireland’s Main PortsFig. 21: Turnover growth expectations, port’s seafood sub-sectors, 2018-2019
Share of respondents (n=358)
Fish processing
Aquaculture
Commercial fishing
0% 20% 40% 60% 80% 100%
Increase Stay the same Decrease Not sure
Source: Oxford Economics, Perceptive Insight
As part of the survey exercise respondents were also asked to identify the greatest constraint to growth within
the local seafood sector. By far the greatest concern expressed by the ports’ respondents was the impact of
quotas and regulations on the ability to grow their business. Over 40% of respondents gave this issue as the
greatest constraint to growth in the local seafood sector, followed by competition in the market (11%) and
overfishing (10%).
Fig. 22: Main constraints to growth, port’s seafood sector, 2018
Share of respondents (n=358)
Quotas and regulations
Competition/market issues
Overfishing
Brexit uncertainty
Staffing issues
Fuel costs
Seal conservation
Lack of support
Harbour facilities
Fishing conditions (weather, disease etc.)
Access to finance
0% 10% 20% 30% 40% 50%
Source: Oxford Economics, Perceptive Insight
Opinions vary more widely when we break down responses by seafood sub-sector. Although ‘Quotas and
regulations’ remain the most widely referenced constraint to growth across the overall sector, this issue was
particularly prevalent within the aquaculture element, representing close to 50% of all responses. Equally,
although Brexit uncertainty ranked as only the fourth most common constraint to growth across the collective
seafood sector – it was the second most referenced issue for local fish processors. A quarter of respondents
given this as the main issue hindering their expansion.
17Fig. 23: Main constraints to growth, port’s seafood sub-sectors, 2018
Share of respondents (n=358)
Fish processing 39% 25%
Aquaculture 48% 2%
Commercial fishing 42% 10%
0% 20% 40% 60% 80% 100%
Access to finance Quotas and regulations
Brexit uncertainty Staffing issues
Fuel costs Harbour facilities
Fishing conditions (weather, disease etc.) Lack of support
Seal conservation Overfishing
Competition/market issues
Source: Oxford Economics, Perceptive Insight
To better understand how the seafood industry is impacted by changes in demand the survey asked the sector
whether they would be motivated to hire additional employees if fish quotas were increased by 20%. Only 35%
of respondents said this would lead to additional staff being taken on within their businesses. Responses to this
question were similar across the sub-sectors. For those who responded with a ‘no’, a follow-up question was then
asked to understand how much quotas would have to increase for additional staff to be employed. Almost 90%
of respondents said they could not quantify the increase required.
2.3.2 Investment
A third of seafood respondents stated that they had made capital investments in the last financial year. Just
30% of commercial fishing sector respondents said they made capital investments over this period – a slightly
smaller share than that found within the corresponding processing and aquaculture segments (39% and 43%
respectively). The survey also reveals that the average capital investment made was close to €0.39 million in
2018.
Fisheries typically invested the most with an average spend of €0.48 million – almost two-thirds more than the
average investment made by processors during the same year. Furthermore, the survey responses indicate that
close to half of the local seafood sector’s capital investment spend was retained within Ireland. The aquaculture
segment recorded both the highest share of investment spend retained within the broader region (46%) and the
lowest share spent outside of Ireland (31%).
18 BIM The Economic Impact of the Seafood Sector at Ireland’s Main PortsFig. 24: Capital investment spend, port’s seafood sub-sectors, 2018
Average annual capital investment expenditure spend (€) per business (n=117)
Fish processing 282,600
Aquaculture 158,600
Commercial fishing 478,200
0 100,000 200,000 300,000 400,000 500,000
Source: Oxford Economics, Perceptive Insight
Fig. 25: Capital investment spend, port’s seafood sub-sectors, 2018
Share of capital investment by supplier location (n=117)
Fish processing
Aquaculture
Commercial fishing
0% 20% 40% 60% 80% 100%
Region Nationally Internationally
Source: Oxford Economics, Perceptive Insight
2.3.3 Seafood markets
Local seafood respondents were then asked where their sales were typically based over the last year. The export
market accounted for the largest share of local seafood sales, representing 45% of the total. Following this a
third of sales were with customers in the local port area and the remaining 22% originated within the rest of
Ireland. The survey results suggest that the domestic market was most important for the fisheries segment –
accounting for over two-thirds of sales in the last year. Meanwhile, export sales were more important within the
fish processing and aquaculture sub-sectors, accounting for 59% and 80% of total respective sales.
19Fig. 26: Sales origin over the last year, port’s seafood sub-sectors, 2018
Share of sales by origin (n=358)
Fish processing
Aquaculture
Commercial fishing
0% 20% 40% 60% 80% 100%
Port areas Rest of ROI Export markets
Source: Oxford Economics, Perceptive Insight
Local seafood operators were asked what share of their export sales were sold in different markets across the
world. The survey responses show that the largest export market was by far the EU market (excluding the UK),
representing close to two-thirds of the total. This was followed by Asia and the UK – representing 15% and 12%
of international sales.
Fig. 27: Export markets, port’s seafood sector, 2018
Export sales by market (n=107)
1% 2%
7% 12%
UK
15%
EU (excluding the UK)
Asia
Africa
Middle East
Rest of the world
64%
Source: Oxford Economics, Perceptive Insight
The EU was the largest export market across the seafood sub-sectors, with aquaculture respondents having
a particularly high share of their sales based on the continent. The survey indicates that close to a fifth of
commercial fishing exports were sold within the UK, the highest share among the three seafood sub-sectors.
Meanwhile, fish processors export sales had more exposure to other markets outside the EU, with close to a third
belonging to Asia and Africa alone.
20 BIM The Economic Impact of the Seafood Sector at Ireland’s Main PortsFig. 28: Export markets, port’s seafood sub-sectors, 2018
Export sales by market (n=107)
Fish processing
Aquaculture
Commercial fishing
0% 20% 40% 60% 80% 100%
UK EU (excluding the UK) Asia
Africa Middle East Rest of the world
Source: Oxford Economics, Perceptive Insight
2.3.4 Seafood jobs and the labour force
We estimate that the seafood sector directly supported close to 4,800 jobs across the 10 port area economies
in 2018.8 Both the commercial fishing and aquaculture sub-sectors enjoy relatively high shares of the seafood
employment total given their turnover share. For example, fishing represents nearly half of seafood related jobs
across the ports, while it only accounts for a third of seafood related turnover. Similarly, fish processing represents
just over a third of seafood jobs, while accounting for over half of total seafood turnover. This observation is likely
to result in greater capital intensity within the fishing processing sub-sector, thereby reducing the need for labour.
Similarly, wages across the seafood sub-sectors more closely mirror the employment picture, with commercial
fishing representing the largest share. Collectively, we estimate that the local seafood sector paid its employees
€136 million in wages in 2018. Commercial fishing accounted for €63 million of the earnings total, equating to an
average full-time equivalent income of around €27,600 per job. Although the wage total associated with the fish
processing sector was lower at €55 million, average wages were higher than commercial fishing at €32,000 per
job on average. Finally, the aquaculture sector’s 795 jobs are estimated to have supported €19 million in employee
wages throughout 2018.
8 Jobs are expressed in Full-Time Equivalent term (FTE), where two part-time roles are taken to represent one full-time position.
21Fig. 29: Seafood related jobs, turnover and wages, port areas, 2018
7,000 700
6,000 600
5,000 500
4,000 400
Jobs
€m
3,000 300
2,000 200
1,000 100
0 0
Jobs Turnover Wages
Commercial fishing Aquaculture Fish processing
Source: Oxford Economics, Perceptive Insight, BIM
The earnings the local seafood sector supports are important because a high proportion of the sector’s labour
force live within the port areas. This in turn helps to retain consumer spending within the local economy and
supports local retail and hospitality-based sectors. The survey results indicate that 80% of the sector’s labour
tended to live within the local port areas. This was a common trend across all three seafood sub-sectors.
Although the processing segment is estimated to have the lowest share of employees living locally, this cohort
still accounted for nearly three-quarters of the workforce. Furthermore, the survey suggests that close to 5% of
the ports’ fishing workforce reside outside Ireland itself.
Equally, in terms of origin, the seafood related workforce is heavily embedded within the local community. On
average, respondents said that 63% of their employees hail from the local area, with an estimated 15% share
originating from the rest of Ireland and 18% share originated from elsewhere in the EU. Aquaculture businesses
typically employed a higher proportion of staff who originate from Ireland (88%). However, the processing and
fishing segments are more dependent on foreign labour generally, with EU workers typically filling close to a fifth
of positions.
Fig. 30: Employees by origin, ports seafood sub-sectors, 2018
Employee share by origin (n=358)
Fish processing
Aquaculture
Commercial fishing
0% 20% 40% 60% 80% 100%
Port hinterland Wider county Rest of ROI
EU Outside EU
Source: Oxford Economics, Perceptive Insight
22 BIM The Economic Impact of the Seafood Sector at Ireland’s Main Ports2.3.5 Seafood businesses
In 2018, there were close to 860 seafood related businesses operating across the 10 port areas. Although the
commercial fishing component accounted for less than half of the sector’s turnover, it represented a significantly
higher share (79%) of the local seafood related business base. Consequently, the average turnover of commercial
fishing businesses (€0.4 million) was relatively weaker than both the aquaculture and processing segments.
By contrast, fish processing firms are better able to exploit the economies of scale associated with industrialised
processes. While there were only 63 operators in this activity across the 10 ports, each had an average turnover
of €7.5 million per year, close to 18 times larger than the average for local commercial fisheries.
The aquaculture sub-sector is more in-line with the seafood sector average in turnover terms. The 120
aquaculture businesses generated an average turnover of €0.8 million in 2018. Although this was stronger than
the commercial fishing average (€0.4 million), it remains weaker than the seafood sector average of €1 million.
Fig. 31: Business numbers and turnover, ports seafood sub-sectors, 2018
800 8.0
700 7.0
600 6.0
Business numbers
500 5.0
€ millions
400 4.0
300 3.0
200 2.0
100 1.0
0 0.0
Commercial fishing Aquaculture Fish processing
Business numbers (LHS) Average turnover (RHS)
Source: Oxford Economics, Perceptive Insight, BIM
The survey results show that seafood sector at the ports tends to be relatively mature with few new entrants
overall. A significant majority (89%) of port respondents identified as operating in the sector for more than
10 years. This is a common characteristic across all three sub-sectors of the local seafood sector. Local fish
processors tended to have a slightly higher proportion of younger businesses. Close to 15% of these businesses
said they had been trading for less than 10 years, compared to just 9% and 11% of aquaculture and fisheries
respectively.
23Fig. 32: Seafood sector maturity, ports seafood sub-sectors, 2018
Share of respondents (n=358)
Fish processing
Aquaculture
Commercial fishing
0% 20% 40% 60% 80% 100%
Less than 3 years Between 3 to 10 years More than 10 years
Source: Oxford Economics, Perceptive Insight
24 BIM The Economic Impact of the Seafood Sector at Ireland’s Main Ports3. The impact of commercial
fishing
3.1 Ireland estimates
We estimate that commercial fishing at the 10 ports directly sustains 2,275 FTE jobs with wages of €63 million
and a €155 million GVA contribution to GDP (Fig. 33).9 These direct impacts are informed by both Perceptive
Insight’s seafood survey and BIM’s own business registration data for active fisheries in each port area.
Fig. 33: The estimated benefits of the ports commercial fishing sub-sector, 2018
Ports Commercial Fishing Ireland
GVA (€m) Employment Wages (€m)
Direct 155 2,275 63
Indirect 76 725 29
Induced 46 520 21
Total 277 3,520 112
Source: Oxford Economics, Perceptive Insight, CSO
Using the latest Supply and Use input-output tables for Ireland, we are then able to estimate both the supply
chain and consumer spending related impacts that this direct activity supports throughout the Irish economy.10
This approach was further refined by drawing on the seafood survey, which collected information regarding how
local fisheries sourced their supply chain by both sector and location.
We estimate the commercial fishing businesses across the 10 ports had a procurement spend of almost €131
million in 2018. Only 4% of this spend represented a ‘leakage’ from the Irish economy. In other words, they spent
€5.8 million on imported goods and/or services. At a sectoral level, the wholesale & retail trade sector benefited
most from the ports’ fishing related procurement spend in Ireland – to the tune of an estimated €46 million. The
majority of this spend (95%) was attributed to energy requirements of the sector.
Fig. 34: Procurement spend, ports commercial fishing sub-sector, 2018
Sector Procurement by source (€m) Total
Domestic Imported
Agriculture, forestry & fishing 14.6 1.3 15.9
Manufacturing 33.8 2.1 35.8
Wholesale & retail 45.9 1.0 46.9
Transportation & storage 7.5 0.9 8.4
Financial & insurance 10.0 0.3 10.3
Real estate 3.6 0.0 3.6
Professional, scientific & technical 10.0 0.3 10.3
Total 125.4 5.8 131.2
Source: Oxford Economics, Perceptive Insight, BIM
9 All euro values are quoted in current prices for the year 2018.
10 https://www.cso.ie/en/releasesandpublications/ep/p-sauio/supplyanduseandinput-outputtablesforireland2015/
25We estimate that fishing’s supply chain spending indirectly supported 725 jobs throughout the Irish economy.
This includes not only the fisheries own procurement spend, but that of the subsequent spend which flows
throughout the Ireland based supply chain network. These jobs supported €29 million in wages and generated a
GVA contribution to GDP of €76 million.11
Finally, the spending patterns of those employed directly and indirectly by the commercial fishing sector at the
ports creates additional consumer spending related impacts. These induced benefits are estimated to support
a further 520 jobs, €21 million in earnings and €46 million in GVA. Therefore, in total we estimate that 3,520 jobs,
€112 million in wages and €277 million of GVA are sustained within the Irish economy through the direct, indirect
and induced effects of fishing activity at the 10 ports.
This seafood sub-sector, therefore, has an employment multiplier of 1.5 throughout the Irish economy – meaning
that for every direct fishing job within the port areas, an additional half a job is supported elsewhere in the Irish
economy.
Outside the Agriculture, forestry & fishing sector, commercial fishing’s employment impact was strongest within
the Wholesale & retail and Accommodation & food sectors – collectively supporting 595 jobs across Ireland. In GVA
terms, the Wholesale & retail and Manufacturing sectors experienced some of the largest benefits, generating
GVA of €36.6 million and €18.2 million respectively.
Fig. 35: Sectoral benefits of the commercial fishing sub-sector, 2018
Ports Commercial Fishing Ireland
GVA (€m) Employment Wages (€m)
Agriculture, forestry & fishing 161.5 2,405 66.7
Mining & quarrying 0.1 0 0.0
Manufacturing 18.2 60 2.6
Electricity, gas, steam 2.3 5 0.3
Water supply 0.5 0 0.1
Construction 0.8 15 0.6
Wholesale & retail 36.6 480 18.3
Transportation & storage 6.4 70 2.9
Accommodation & food 4.1 115 3.1
Information & communications 1.7 5 0.3
Financial & insurance 6.8 25 1.4
Real estate 16.8 105 5.8
Professional, scientific & technical 9.5 75 3.7
Administration & support 2.4 10 0.4
Public administration 0.8 10 0.5
Education 2.5 40 2.0
Human health 3.3 50 2.2
Arts, entertainment & recreation 1.3 15 0.6
Other service activities 1.1 25 0.9
Total 277 3,520 112
Source: Oxford Economics, Perceptive Insight, CSO
Note: May not sum due to rounding
11 Gross Value Added (GVA) is the difference between the value of goods and services produced by a business or a sector, and
the cost of raw materials and other inputs which are used in production. It is essentially a measure of the value added to the
services or products provided by a sector or firm.
26 BIM The Economic Impact of the Seafood Sector at Ireland’s Main Ports3.2 Regional estimates
The port’s peripheral locations around Ireland’s coastline ensures that the resulting economic benefits are widely
spread across Ireland’s NUTS3 regions. Except for the mid-west and the midlands, all of Ireland’s regions had at
least one of the 10 ports based within their boundaries. However, these regions will still benefit indirectly from
the activity at the ports via supply chain and consumer spending. The border and south-west regions collectively
account for five of the 10 port areas and as a result record the largest number of fishing businesses – 173 and
202 respectively. Furthermore, the south-west region was home to Castletownbere, the largest fishing port in
employment terms, while Killybegs, the largest fishing port in turnover terms, is found in the border region.
Fig. 36: Port commercial fisheries by NUTS3 region, 2018
NUTS3 regions Number of Fisheries Turnover (€m)
Border 173 104
West 103 9
Mid-West 0 0
Mid-East 32 20
South-West 202 84
South-East 100 44
Dublin 66 26
Midlands 0 0
Ireland 676 287
Source: BIM, Perceptive Insight
The largest share of the ports’ direct fishing employment is therefore found in the south-west and border regions,
collectively accounting for over half of the fishing total. The south-west enjoys the largest total employment
benefits resulting from ports’ fishing activity. We estimate that 1,100 jobs were sustained in this region either
directly, via supply chain spending and through the resulting consumer spending benefits. However, the regional
employment multipliers associated with the ports’ fishing sector are found to be stronger within the other
regions.12 The border region’s employment multiplier was stronger than that of the south-west (1.6 compared to
1.4) and as a result both the level of indirect and induced employment benefits were higher.
Fig. 37: Employment benefits of the commercial fishing sub-sector, NUTS3 regions, 2018
Ports Commercial Fishing Employment
Direct Indirect Induced Total
Border 580 200 155 935
West 170 40 25 235
Mid-West 0 10 10 20
Mid-East 180 65 40 285
South-West 795 175 130 1,100
South-East 350 110 75 535
Dublin 200 105 75 375
Midlands 0 20 10 30
Ireland 2,275 725 520 3,520
Source: Oxford Economics, Perceptive Insight, CSO
Note: May not sum due to rounding
12 Multipliers measure the scale of indirect and induced impacts to direct activity by dividing total impact by the direct.
27An analysis of average wages within the commercial fishing sector at the ports show a strong relationship
between the relative size of the businesses and the wages paid to their employees. The survey results show that
Killybegs and Greencastle (both within the border region) represent much larger fishing enterprises (in turnover
terms) and at the same time they record some of the highest average wages. Meanwhile, Ros an Mhíl’s (west
region) fisheries are relatively small in comparison and record some of the lowest average wages.
Fig. 38: Average commercial fishing wages across the port areas, 2018
Average turnover per business (€m)
0.9
KILMORE QUAY
0.8
KILLYBEGS
0.7
0.6
0.5
0.4
GREENCASTLE
0.3
0.2
0.1
ROS AN MHÍL
0.0
5,000 10,000 15,000 20,000 25,000 30,000 35,000 40,000 45,000 50,000
Average wage (€) per employee
Source: Oxford Economics, Perceptive Insight
The above observations help explain the differences in average wages across the regions. It is estimated that
€24 million in wages were paid to fishing employees based at ports within the border region. This was the largest
value across the eight regions. Direct earnings in the border region were therefore larger than that of the south-
west which had higher employment levels. As touched on above, this was due to average wages paid to fishing
employees within the border region being significantly higher than that of the collective ports’ average. (€41,000
in border based ports versus €28,000 across all 10 ports). The wage benefits in the border region rose further to
€36 million after we include the indirect and induced wage benefits.
Fig. 39: Wage benefits of the commercial fishing sub-sector, NUTS3 regions, 2018
Ports Commercial Fishing Wages (€m)
Direct Indirect Induced Total
Border 23.7 7.1 5.4 36.1
West 1.6 1.6 1.1 4.4
Mid-West 0.0 0.5 0.4 0.8
Mid-East 4.5 2.6 1.6 8.7
South-West 17.5 7.0 5.1 29.6
South-East 9.1 4.3 3.1 16.6
Dublin 6.5 4.8 3.6 14.9
Midlands 0.0 0.8 0.4 1.2
Ireland 63 29 21 112
Source: Oxford Economics, Perceptive Insight, CSO
28 BIM The Economic Impact of the Seafood Sector at Ireland’s Main PortsYou can also read