Symbols Are Special: An fMRI Adaptation Study of Symbolic, Nonsymbolic, and Non-Numerical Magnitude Processing in the Human Brain
←
→
Page content transcription
If your browser does not render page correctly, please read the page content below
Cerebral Cortex Communications, 2021, 2, 1–13

                                                                             doi: 10.1093/texcom/tgab048
                                                                             Original Article

ORIGINAL ARTICLE

                                                                                                                                                        Downloaded from https://academic.oup.com/cercorcomms/article/2/3/tgab048/6326848 by guest on 12 September 2021
Symbols Are Special: An fMRI Adaptation Study
of Symbolic, Nonsymbolic, and Non-Numerical
Magnitude Processing in the Human Brain
H. Moriah Sokolowski                            1,   Zachary Hawes2 , Lien Peters3 and Daniel Ansari3
1 Rotman Research Institute, Baycrest Hospital, North York, ON M6A 2E1, Canada, 2 Ontario Institute for Studies
in Education, University of Toronto, Toronto, ON M5S1V6, Canada and 3 Numerical Cognition Laboratory,
Department of Psychology & Brain and Mind Institute, University of Western Ontario, London, ON N6A 3K7,
Canada
Address correspondence to H. Moriah Sokolowski, Rotman Research Institute, Baycrest Hospital, 3560 Bathurst St., North York, ON M6A 2E1. Email:
h.moriah.sokolowski@gmail.com

Abstract
How are different formats of magnitudes represented in the human brain? We used functional magnetic resonance imaging
adaptation to isolate representations of symbols, quantities, and physical size in 45 adults. Results indicate that the neural
correlates supporting the passive processing of number symbols are largely dissociable from those supporting quantities and
physical size, anatomically and representationally. Anatomically, passive processing of quantities and size correlate with
activation in the right intraparietal sulcus, whereas symbolic number processing, compared with quantity processing,
correlates with activation in the left inferior parietal lobule. Representationally, neural patterns of activation supporting
symbols are dissimilar from neural activation patterns supporting quantity and size in the bilateral parietal lobes. These
findings challenge the longstanding notion that the culturally acquired ability to conceptualize symbolic numbers is
represented using entirely the same brain systems that support the evolutionarily ancient system used to process quantities.
Moreover, these data reveal that regions that support numerical magnitude processing are also important for the processing
of non-numerical magnitudes. This discovery compels future investigations of the neural consequences of acquiring
knowledge of symbolic numbers.
Key words: fMRI, human uniqueness, magnitude processing, neural adaptation, nonsymbolic, numerical cognition, symbolic

                                                                             a preexisting, innate, and evolutionarily ancient abstract
Introduction
                                                                             numerical magnitude processing system used to process non-
As a species, humans are unique in our ability to repre-                     symbolic numerical magnitudes, often referred to as quantities
sent numerical magnitudes symbolically (e.g., “3” or “three”).               (e.g., three dots “•••”) (Pansky and Algom 2002; Dehaene et al.
The exceptional capacity to understand and manipulate                        2003; Brannon 2006; Dehaene 2007; Nieder and Dehaene 2009;
numerical symbols is necessary for mathematical thinking;                    Szkudlarek and Brannon 2017; Castaldi et al. 2019). However, a
a pillar of contemporary civilization. The ability to under-                 growing body of recent evidence suggests that brain regions used
stand symbolic numerical magnitudes is thought to be sup-                    to process symbolic and nonsymbolic numerical magnitudes are
ported by the same brain regions that are associated with                    more distinct than has been previously assumed (Ansari 2007;

Received: 8 June 2021; Revised: 13 July 2021; Accepted: 14 July 2021

© The Author(s) 2021. Published by Oxford University Press.
This is an Open Access article distributed under the terms of the Creative Commons Attribution License (http://creativecommons.org/licenses/by/4.0/),
which permits unrestricted reuse, distribution, and reproduction in any medium, provided the original work is properly cited.
                                                                                                                                                  1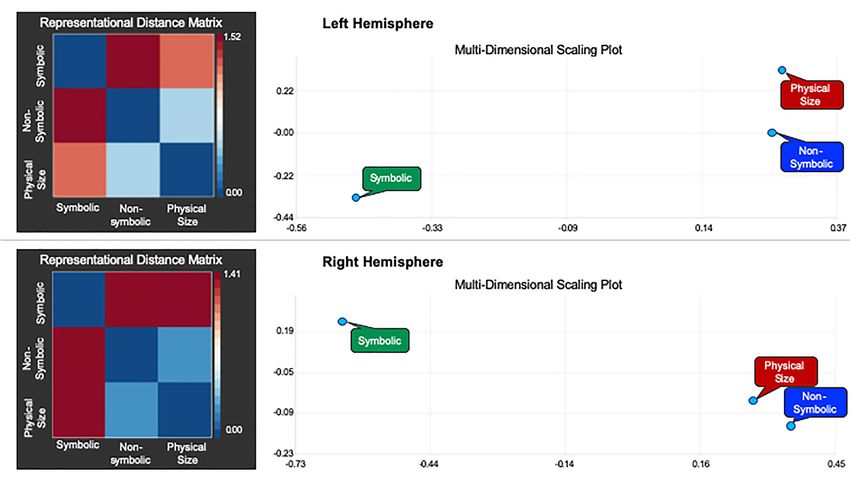
2     Cerebral Cortex Communications, 2021, Vol. 2, No. 3

Cohen Kadosh and Walsh 2009; Lyons et al. 2012; Lyons and                  participant is adapted to the symbolic number “6” the neural
Beilock 2013; Bulthé et al. 2014; Lyons et al. 2014; Sokolowski and        rebound effect associated specifically with magnitude process-
Ansari 2016), thus conflicting with the notion that numbers are            ing will be greater for a symbolic number deviant stimulus that
processed entirely abstractly. Despite years of research, and a            is farther from the adapted stimulus (e.g., “9”) compared with a
recent meta-analysis of neuroimaging papers (Sokolowski, Fias,             symbolic number that is closer to the adapted stimulus (e.g., “7”).
Mousa, et al. 2017), the degree of the dissociation in the way the         Therefore, calculating a “neural distance effect” by subtracting
brain processes symbolic compared with nonsymbolic numerical               activation in response to deviants with close numerical distances
magnitudes remains unknown (Cohen Kadosh and Walsh 2009;                   from activation in response to deviants with a far numerical
Piazza and Izard 2009; Piazza and Eger 2016; Wilkey and Ansari             distance allows us to identify regions specifically associated with
2019).                                                                     magnitude processing (Pinel et al. 2004; Lyons and Ansari 2009;
     Brain regions associated with numerical magnitude process-            Holloway et al. 2010; Notebaert et al. 2010; Notebaert et al. 2011).
ing are also activated during the processing of non-numerical                  Using fMR-A, researchers have discovered that regions in the

                                                                                                                                                     Downloaded from https://academic.oup.com/cercorcomms/article/2/3/tgab048/6326848 by guest on 12 September 2021
magnitudes such as physical size, duration, and luminance                  bilateral intraparietal sulcus (IPS) support symbolic and nonsym-
(Walsh 2003; Cohen Kadosh et al. 2008; Cantlon et al. 2009b;               bolic numerical magnitude processing (Piazza et al. 2004; Cohen
Sokolowski, Fias, Ononye, et al. 2017). This finding of common             Kadosh et al. 2007; Piazza et al. 2007; Roggeman et al. 2007;
brain regions supporting numerical and non-numerical mag-                  Notebaert et al. 2011; Damarla and Just 2013; Holloway et al. 2013;
nitude processing has been taken to suggest that the common                Demeyere et al. 2014; Vogel et al. 2017). A meta-analytic synthe-
brain regions used to process both symbolic and nonsymbolic                sis that included many of these passive fMR-A tasks revealed
numerical magnitudes (often referred to as an abstract number              convergent activation for the passive processing of numerical
processing system) may be a general system used to process both            symbols in the left inferior parietal lobule and convergent activa-
numerical and non-numerical magnitudes. Few neuroimaging                   tion for the passive processing of nonsymbolic numerical mag-
studies examining nonsymbolic stimuli sufficiently control for             nitudes in bilateral regions of the parietal lobes (Sokolowski,
continuous properties of the nonsymbolic stimuli (e.g., control-           Fias, Mousa, et al. 2017). This indicates that both overlapping
ling for the area of space taken up by objects with different quan-        and distinct brain regions support the processing of symbolic
tities). Therefore, the question of whether symbolic and nonsym-           and nonsymbolic numerical magnitudes in the absence of task
bolic numerical magnitudes are processed using the same brain              demands. However, the majority of the studies included in the
regions while controlling for brain regions associated with non-           passive viewing meta-analysis include only a symbolic (Cohen
numerical magnitude processing must still be addressed.                    Kadosh et al. 2007; Notebaert et al. 2011; Price and Ansari 2011;
     An additional challenge when addressing the question of               Holloway et al. 2013; Vogel et al. 2017) or a nonsymbolic condition
whether distinct formats of numerical magnitudes are supported             (Piazza et al. 2004; Ansari et al. 2006; Cantlon et al. 2006; Jacob
by overlapping neural systems is that the vast majority of studies         and Nieder 2009; Roggeman et al. 2011; Demeyere et al. 2014) but
that compared the neural correlates of symbolic and nonsym-                not both conditions. Without the inclusion of both a symbolic
bolic numerical thinking used active tasks. When using active              and nonsymbolic condition within a single controlled sample
tasks, it is notoriously difficult to discern whether neural activa-       of participants, it is challenging to determine the degree to
tion is associated with processing the magnitude of the stimulus           which the systems supporting symbolic and nonsymbolic num-
or with decision-making and motor processing required to com-              ber processing are overlapping. There are a few key studies that
plete the active task (Göbel et al. 2004). Additionally, it is challeng-   have developed innovative fMR-A paradigms that include both
ing to equate difficulty levels on active tasks, which means that a        symbols and quantities and use these paradigms to examine the
comparison of task effects of active tasks may reflect relative lev-       passive processing of both symbolic and nonsymbolic numerical
els of difficulty rather than representational differences between         magnitudes using fMR-A (e.g., Piazza et al. 2007; Roggeman et al.
the tasks. To overcome these limitations of active tasks, a small          2007; Cohen Kadosh et al. 2011; Damarla and Just 2013). The
subset of research has used functional magnetic resonance imag-            adaptation paradigms in these studies involved habituating par-
ing adaptation (fMR-A). fMR-A is a passive design that measures            ticipants to either symbolic or nonsymbolic numbers and then
the neural correlates associated with stimuli of interest without          presenting deviants in either the same format (e.g., habituate to a
requiring participants to make a decision or motor response.               symbolic numerical magnitude then present a symbolic deviant)
fMR-A relies on the principle that neural populations habituate            or distinct format (e.g., habituate to a symbolic numerical mag-
(i.e., adapt) their activity following repeated presentations of the       nitude then present a nonsymbolic deviant). This cross-format
same stimulus (Grill-Spector et al. 2006). In fMR-A paradigms, a           adaptation design allowed researchers to make inferences about
particular stimulus (i.e., the habituation stimulus) is repeatedly         whether semantic numerical representations of one format are
presented to evoke adaptation of brain regions associated with             generalizable to another. As with the studies that used active
encoding this stimulus. Following this period of adaptation, a             tasks, some studies suggest that numerical representation is sub-
stimulus that differs in some way from the habituation stimulus            served by entirely overlapping brain regions, suggested to reflect
(i.e., a deviant stimulus) is presented. The presentation of this          a single abstract number processing mechanism, instantiated in
deviant stimulus results in a rebound of activation in specific            the bilateral parietal lobes (e.g., Piazza et al. 2007), whereas others
brain regions that are associated with the attributes of the par-          indicate distinct brain regions support symbolic and nonsym-
ticular deviant. In other words, the brain regions that support            bolic numerical magnitudes (e.g., Cohen Kadosh et al. 2011).
the aspect of the stimulus that differs between the habituation                We address this fundamental question of whether the
and deviant stimulus exhibit a neural rebound of activation in             culturally acquired, uniquely human ability to process numbers
response to a deviant, referred to as the “neural rebound effect.”         symbolically is underpinned by the same brain regions that
The size of the neural rebound effect in response to a deviant is a        are activated during the processing of nonsymbolic quantities
function of the difference between the adapted stimulus and the            and physical size using a novel adaptation paradigm, inspired
deviant. Within the number domain, the neural rebound effect is            by cross-format adaptation. In the present preregistered study
dependent on the “numerical distance” between the habituation              (https://osf.io/jrmpf/register/5771ca429ad5a1020de2872e),           we
and deviant stimulus (e.g., Vogel et al. 2017). For example, if a          develop and implement “parallel fMR-A” to isolate and directly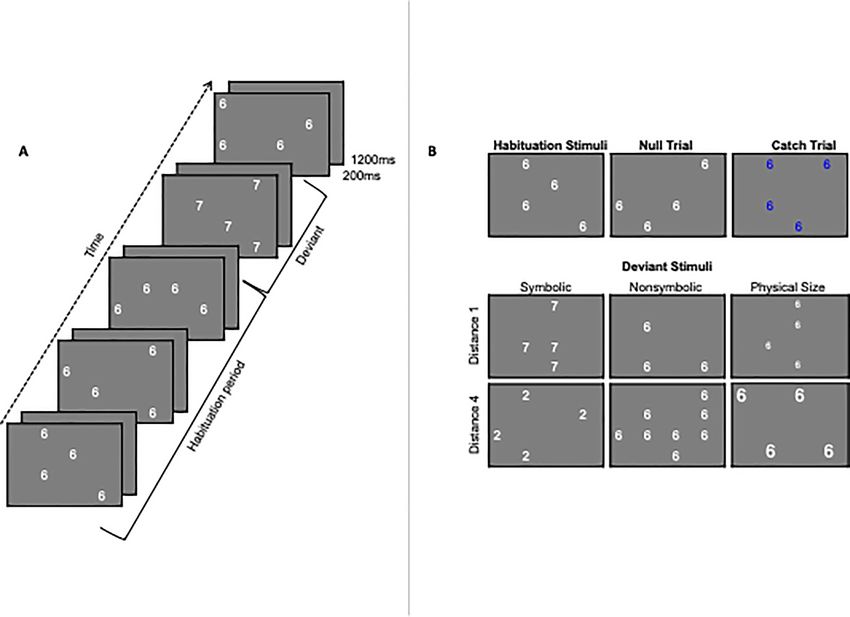
Magnitude Processing in the Human Brain           Sokolowski et al.        3

compare the neural representations of symbols, quantities,              to 3 aspects of the array: the numerical symbol (i.e., “6”), the
and physical size. Specifically, in our parallel fMR-A design,          quantity (i.e., the quantity of “6”s displayed), and the physical
participants are repeatedly presented with a specific quantity          size of the digits. Deviant stimuli (i.e., stimuli that differed from
of the same symbolic number in a white-colored font of a                the habituation stimuli in a particular way) were variations of
specific size. This set of symbols will be referred to as an            an array of white Arabic digits randomly positioned on a gray
“array.” Following this, one aspect of the array is changed             background (Fig. 1B). Catch trials (i.e., trials for which participants
(either the symbol, the quantity, or the size), whereas the other       were instructed to press a button) contained Arabic digits printed
aspects remain constant. As with other adaptation tasks, parallel       in blue on the same gray background. As previously stated, to
adaptation overcomes inherent confounds associated with                 meet our accuracy cutoffs, participants were required to “catch”
active tasks (Grill-Spector et al. 2006). However, our design adds      at least 5 out of the 7 trials per run (Vogel et al. 2015). Multiple
several important additional controls. In cross-format adaptation       versions of the array for each condition were generated to ensure
designs, assessing magnitude change across formats requires             that participants did not learn the position of the Arabic digits

                                                                                                                                                   Downloaded from https://academic.oup.com/cercorcomms/article/2/3/tgab048/6326848 by guest on 12 September 2021
that the magnitude and format deviate simultaneously. By                within the array. E-prime 2.0 presentation software (Schneider
adapting participants to multiple formats in parallel, the parallel     et al. 2002) was used to project the stimuli onto a computer screen
fMR-A paradigm disconfounds format from magnitude, allowing             (resolution = 800 × 600 pixels; color bit depth = 16). The paradigm
us to measure brain regions associated with format-specific             is available at https://osf.io/gx63r/. The participants viewed the
processing of magnitude rather than magnitude processing                computer screen using a mirror system that was attached to the
across formats. Additionally, the inclusion of a physical size          magnetic resonance imaging (MRI) head-coil.
condition in the parallel fMR-A task allows us to identify
whether the brain regions that support numerical magnitude
processing are number specific or associated with magnitude             Experimental Procedure
more generally. Finally, rather than using a region of interest (ROI)   The fMR-A task was modeled after previous adaptation studies
approach, the current study canvasses the whole brain in search         (Holloway et al. 2013; Vogel et al. 2015, 2017). Participants were
of brain regions that support the passive processing of numerical       instructed to attend to the screen and press a button when the
and non-numerical magnitudes. In summary, this design allows            digits on the screen turned blue (i.e., catch trials). The experiment
us to identify overlapping and distinct brain regions associated        included 3 fMR-A runs, each consisting of a stream of arrays of
with the passive processing of symbolic, nonsymbolic, and non-          Arabic digits in Helvetica font punctuated by blank gray screens
numerical magnitudes, in the adult brain.                               that were the same color as the background of the arrays. The
                                                                        arrays were presented for 200 ms and the blank gray screen
Methods                                                                 for 1200 ms (Fig. 1A). During habituation, participants were pre-
                                                                        sented with the digit “6” in 4 random locations of the screen
Participants
                                                                        in size 60 font between 5 and 9 times (average of 7 repeats).
Fifty-two healthy adult participants from London, Ontario,              This allowed for a natural oversampling of the hemodynamic
Canada participated in the fMR-A experiment. Our final sample           response function as the presentation of 1 trial (1400 ms) was
included 45 participants (meanage = 23.6, standard deviation            not synchronized with the scan repetition time (TR = 1000 ms).
[SD]age = 4.3, age range = 18–39; 30 women and 22 men), all of          At jittered intervals (i.e., after 5–9 habituation trials), participants
whom did not exceed our motion cutoffs (i.e., no overall deviation      were presented with either a deviant trial (48 total trials across
>3 mm from the first volume acquired within a run, and no               6 conditions), a null trial (9 total), or a catch trial (7 total). In
deviation >1.5 mm between subsequent volumes) and our                   deviant trials, one aspect of the array of sixes was changed a
accuracy cutoffs (Vogel et al. 2015). Accuracy was determined           small amount or a large amount. There were 6 conditions of
by asking participants to press a predefined button with their          deviant trial types (8 trials per deviant). Specifically, there were
right index finger when the numbers appeared in blue font.              3 types of deviants (symbolic, nonsymbolic, physical size), and
These trials are referred to as “catch trials.” The runs where          each type changed a large amount or a small amount (small
the participant did not “catch” at least 5 out of 7 trials were         change, large change). In the symbolic condition, the numerical
excluded from analyses. Participants with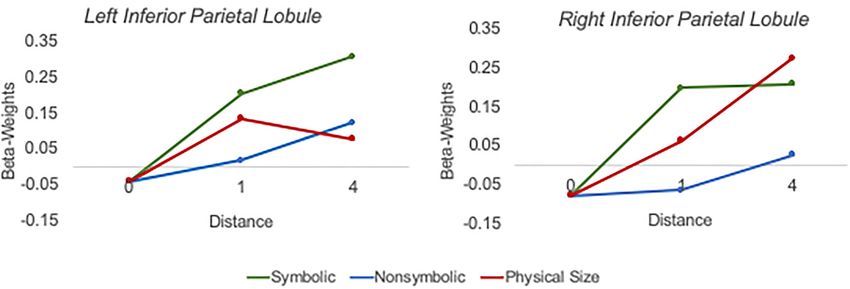
4      Cerebral Cortex Communications, 2021, Vol. 2, No. 3

                                                                                                                                                                               Downloaded from https://academic.oup.com/cercorcomms/article/2/3/tgab048/6326848 by guest on 12 September 2021
Figure 1. (A) Example of the parallel adaptation paradigm: including the continuous presentation of the adapted stimulus (habituation period) followed by a deviant
stimulus (in this case a symbolic deviant). (B) Illustrations of examples of the adaptation stimulus, six deviant stimuli types (symbolic distance 1, symbolic distance 4,
nonsymbolic distance 1, nonsymbolic distance 4, physical size small change, and physical size large change), and catch trial types (i.e., trials for which participants were
instructed to press a button, to assure a minimum degree of attentiveness toward the stimuli presentation in the scanner).

rebound effect. In the catch trials, participants were presented                         habituation and deviant stimuli, and so deviants can be greater or
with one of the six deviant trials or a null trial in blue font.                         smaller than the habituation stimulus. This habituation stimulus
Participants pressed a button with the index finger of their right                       also ensured that the numerical magnitudes in the habituation
hand when the digits on the screen turned blue (i.e., catch trials).                     condition were not the same across formats (e.g., displaying five
Catch trials were pseudorandomly dispersed throughout each                               of the digit “5”). This is necessary because participants respond
run and were not included in the modeling of the hemodynamic                             differently to congruent (i.e., symbolic and nonsymbolic are the
response function. Participants had to push the button for at                            same magnitude) and incongruent (i.e., symbolic and nonsym-
least five of the seven catch trials for the run to be included in                       bolic have different magnitudes) arrays of symbols (Pavese and
the statistical analyses. See Figure 1B for an illustration of the                       Umiltà 1998; Pavese and Umiltà 1999; Furman and Rubinsten
adaptation, deviant, null, and catch trials.                                             2012). This means that any automatic inhibition that occurs
                                                                                         due to the stimuli having two numerical dimensions that are
                                                                                         incongruent is consistent between the habituation and deviant
Method of Selection of Numerical Stimuli
                                                                                         stimuli. Thus, the habituation condition acts as a control for
Due to the trade-off between the variety of stimuli and atten-                           potential congruity effects within the stimuli.
tional time constraints, it was necessary to select a represen-
tative subset of stimuli that can be used to address our key                             Deviant Stimuli
questions. Numerical magnitudes included in the current study
                                                                                         Deviant stimuli included a deviant with a numerical distance
needed to be able to be represented with a single digit (i.e., 1–9),
                                                                                         that was close (i.e., distance 1) and far (i.e., distance 4) for each
as this experiment involved the presentation of an array of digits
                                                                                         condition. Specifically, in the symbolic small change condition,
as a condition of interest (nonsymbolic condition). Additionally,
                                                                                         the four sixes changed to four sevens; in the symbolic large
numerical magnitudes 1 and 9 were avoided as quantities at the
                                                                                         change condition, the four sixes changed to four twos; in the
edge of a set have been reported to behave differently than other
                                                                                         nonsymbolic small change condition, the four sixes changed to
numerical stimuli (e.g., Goldfarb et al. 2011).
                                                                                         three sixes; and in the nonsymbolic large change condition, four
                                                                                         sixes changed to eight sixes. In the symbolic condition, the small
Habituation Stimuli
                                                                                         and large conditions differed in whether they were increasing or
The stimuli four and six were chosen to be the habituation                               decreasing as compared with the nonsymbolic and physical size
stimuli. These numerical magnitudes are near the middle of the                           conditions. Tuning curves from previous empirical adaptation
range of possible single-digit numerical magnitudes (1–9), allow-                        studies consistently reveal that the neural rebound in response
ing for both a large and small numerical distance between the                            to deviant stimuli is greater for deviants that are numerically
Magnitude Processing in the Human Brain Sokolowski et al. 5
more distant from the adapted stimulus, for both symbolic and Wager 2014; Eklund et al. 2016). All statistical whole-brain maps
nonsymbolic numerical magnitudes, regardless of if the deviant were corrected for multiple comparisons at a statistical level of
is increasing or decreasing (e.g., Piazza et al. 2004; Cohen Kadosh P < 0.05 using the cluster-level correction plugin in BrainVoyager
et al. 2007; Jacob and Nieder 2009; Holloway et al. 2013). Based (Forman et al. 1995). The FWHM in units of functional voxels (i.e.,
on this consistent finding that increasing and decreasing sides the smoothness), as well as the minimum cluster size (P = 0.05)
of tuning curves are symmetrical, there is no strong prior that based on the log-linear intra/extrapolation in millimeters (i.e.,
this should influence or confound our analyses of interest in any the cluster extent), are reported for each contrast with clusters
meaningful way. However, we include several control analyses to of activation that reached a minimum threshold of P < 0.001,
explicitly assess whether neural rebound effects are influenced uncorrected and P < 0.05 cluster corrected at the whole-brain
by the direction of the deviant within these data. level (Woo and Wager 2014; Eklund et al. 2016).
fMRI Data Acquisition Whole-Brain Analyses
Downloaded from https://academic.oup.com/cercorcomms/article/2/3/tgab048/6326848 by guest on 12 September 2021
Structural and functional images were acquired using a 3 T Whole-brain random-effects analyses (RFX) were conducted
Siemens Prisma Fit whole-body MRI scanner, using a 32- using a general linear model to examine overlapping and distinct
channel receive-only head-coil (Siemens, Erlangen Germany). BOLD responses to symbolic numerical magnitudes, nonsym-
A whole-brain high-resolution T1-weighted anatomical scan bolic numerical magnitudes, and the magnitude of physical size.
was collected using an MPRAGE sequence with 192 slices and Stimulus conditions within contrasts were weighted to ensure
a scan duration of 5 min and 21 s (isovoxel resolution = 1 × 1 × 1; that the contrasts were balanced. For example, when comparing
TR = 2300 ms; TE 2.98 = ms; TI = 900 ms; FOV = 256 mm; flip symbolic to both nonsymbolic and physical size the symbolic
angle = 9◦ ). Functional MRI data were acquired using a blood condition was weighted by a factor of two. All primary analyses
oxygen level–dependent (BOLD) sensitive T2∗ echo-planar (EPI) were preregistered on the OSF (see https://osf.io/jrmpf/registe
sequence. The T2-weighted functional scan was collected using r/5771ca429ad5a1020de2872e for preregistration).
a bold sequence with 48 slices and a scan duration of 12 min and
58 s. The 48 slices were acquired in a sequential multi-slice inter-
leaved series with a multi-band accelerator factor of 4 (FIX voxel Results
size = 2.5 × 2.5 × 2.5 mm; slice thickness = 2.5 mm; TR = 1000 ms; Preregistered Analyses
TE 30.00 = ms; FOV = 208 mm; flip angle = 40◦ ). The scan has a base
The procedure and complete analysis plan for the current study
resolution of 84, a phase resolution of 100%, and a phase partial
were preregistered on the OSF (https://osf.io/jrmpf). The results
Fourier of 7/8. All defaced neuroimaging data are publicly avail-
presented follow this preregistered plan, in sequential order.
able at https://openneuro.org/datasets/ds001848/versions/1.0.1.
Neural distance effects (i.e., neural rebound in response to a
large distance deviant compared with a small distance deviant)
fMRI Data Preprocessing are used to address the core research questions as they allow
Structural and functional data were preprocessed and analyzed us to identify changes in magnitude independently from format
in Brain Voyager 20.6 (Brain Innovation, Maastricht, the Nether- changes.
lands) using the software’s preprocessing workflow (for work-
flow see: https://osf.io/3hr2g/). The structural brain data were Change Detection
extracted from the head tissue, and intensity inhomogeneities Preliminary contrast analyses were conducted to identify
were corrected to reduce the spatial intensity of the 3D vol- brain regions that responded to changes in different stimulus
umes. Functional data were corrected for slice-scan time acqui- dimensions. Regions that were associated with stimulus
sition (cubic-spline interpolation algorithm), high-pass filtered change detection were identified as regions associated with
(Fourier; cutoff value of 2 sines/cosines cycles), in which a Fourier the change of one stimulus type (at both distances) over the
basis set is used to filter the design matrix and corrected for in- change of the other two stimulus types (at both distances); for
scanner head motion (Trilinear/sinc interpolation). A Gaussian example, the symbolic change effect is calculated as [(symbolic
smoothing kernel of 6-mm full-width at half-maximum (FWHM) distance 1 + symbolic distance 4) > (nonsymbolic distance
was applied to smooth the images. Structural and functional 1 + nonsymbolic distance 4 + physical size distance 1 + physical
images were coregistered using a header-based initial alignment size distance 4)]. The stimulus conditions were weighted to
followed by a gradient-driven fine-tuning adjustment and nor- ensure that the contrast was balanced for all contrasts. Results
malized to MNI-152 space. A 2-gamma hemodynamic response from these change detection analyses cannot inform our primary
function was used to model the expected bold signal (Friston research questions, as they do not identify regions associated
et al. 1998). Baseline was calculated using the adaptation period with magnitude. Instead, these analyses were included as a
as well as the between trial fixation periods. Runs that had an preliminary assessment to examine if participants do exhibit
overall deviation >3 mm from the first volume acquired within a neural rebound effect after adapting to multiple aspects of an
the run, or deviation >1.5 mm between subsequent volumes array in parallel.
were removed from analyses, and therefore, motion parameters Results revealed that symbolic change detection (cluster-
were not included as predictors of no interest. Catch trials were level: smoothing = 2.49; extent = 462 mm) associated with
modeled as a predictor of no interest. activation in a widespread frontal–parietal–occipital network
(Table 1). There were no brain regions that were activated above
Data Analysis the threshold in response to nonsymbolic change detection.
Physical size change detection (cluster-level: smoothing = 2.25;
Statistical Threshold
extent = 373 mm) associated with activation in the right inferior
All of the statistical maps reported in the current study were parietal lobule, and left visual cortex (Table 1). Although these
thresholded with an uncorrected P value of 0.001 (Woo and preliminary analyses highlight regions that correlate with the6 Cerebral Cortex Communications, 2021, Vol. 2, No. 3
Table 1. Brain regions associated with change detection signal recovery from adaptation
Hemi-sphere Brain region Peak MNI coordinate t P Cluster size
Juelich histological Harvard–Oxford structural x y z (Number of
atlas atlas voxels)
Symbolic change detection
R Anterior intraparietal Superior parietal lobule, 33 −52 43 5.46 0.000002 5242
sulcus angular gyrus
R Callosal body, Cingulate gyrus 3 −34 28 4.46 0.00006 755
cingulum
L Cerebellum −6 −89 −32 4.45 0.00006 534
Downloaded from https://academic.oup.com/cercorcomms/article/2/3/tgab048/6326848 by guest on 12 September 2021
L Anterior intraparietal Lateral occipital cortex, −30 −61 46 4.44 0.00006 836
sulcus, superior superior parietal lobule,
parietal lobule angular gyrus
L Temporal occipital fusiform −36 −55 −23 4.58 0.0004 643
cortex, inferior temporal
gyrus
L Visual cortex V4 Lateral occipital cortex, −45 −76 −17 5.80 0.000001 891
occipital fusiform gyrus
Nonsymbolic change detection
— — — — — — — — —
Physical size change detection
R Inferior parietal Supramarginal gyrus 60 −37 22 4.46 0.00006 432
lobule
L Visual cortex Lateral occipital cortex, −30 −88 −2 4.51 0.00005 591
occipital pole
passive perception of change detection within each format, voxels) and left lateral occipital cortex (peak MNI coordinate: −45,
these brain regions are not specifically associated with the −67, −11; t = 4.79, P = 0.00002; cluster size = 1076 voxels) (Fig. 2).
magnitude processing of symbols, quantities, and physical Reverse distance effects (i.e., distance 1 > distance 4) for each
size. The critical analyses to address how the human brain condition were also examined as control analyses to ensure
processes the magnitude in different formats require assessing that the distance-dependent activation correlated with greater
neural rebound effect at distance 4–distance 1 (i.e., distance magnitude. Results revealed that no brain regions were more
effects). activated in response to distance 1 compared with distance 4
for the symbolic and physical size conditions and 1 brain region
associated with nonsymbolic distance 1 > nonsymbolic distance
Neural Distance Effects 4 in the visual cortex (peak MNI coordinate: 0, −79, 22; t = −4.18,
Neural distance effects allow us to compare the brain regions that P = 0.0001; cluster size = 466 voxels).
repond to magnitude in the three different formats. We exam- Following our preregistered analysis plan, we next used a
ined neural distance effects (i.e., distance 4 > distance 1) to iso- conjunction (∩) of RFX to assess whether the brain regions
late brain regions associated with magnitude processing, of each associated with symbolic, nonsymbolic, and physical size
deviant stimulus type (symbolic, nonsymbolic, physical size). magnitude processing overlapped. This analysis [(symbolic
Specifically, we statistically compared distance 4 to distance distance 4 > symbolic distance 1) ∩ (nonsymbolic distance
1 for the symbolic condition (symbolic distance 4 > symbolic 4 > nonsymbolic distance 1) ∩ (physical size large change > physical
distance 1), the nonsymbolic condition (nonsymbolic distance size small change)] revealed that there are no brain regions
4 > nonsymbolic distance 1), and the physical size condition commonly activated by symbolic, nonsymbolic, and physical
(physical size large change > physical size small change). Sym- size magnitude processing.
bolic magnitude processing was associated with small clusters To identify which brain regions support numerical magni-
of activation in the left inferior parietal lobule (peak MNI coor- tude processing specifically, the conjunction of the symbolic
dinate: −57, −64, 22) and the left frontal orbital cortex (peak and nonsymbolic distance effects were contrasted against the
MNI coordinate: −36, 35, −14), but these clusters did not survive physical size distance effect [(symbolic distance 4 ≥ symbolic
cluster correction. Distinct from this, nonsymbolic magnitude distance 1) ∩ (nonsymbolic distance 4 > nonsymbolic distance
processing (cluster-level: smoothing = 2.26; extent = 375 mm) was 1) > (physical size large change > physical size small change)]. No
associated with activation spanning the right intraparietal sul- brain regions were significantly activated for numerical mag-
cus and superior parietal lobule (peak MNI coordinate: 27, −67, nitude processing (symbolic and nonsymbolic) over and above
40; t = 4.05, P = 0.0001; cluster size = 417 voxels) (Fig. 2). Physi- brain regions associated with physical size processing.
cal size magnitude processing (cluster-level: smoothing = 2.45; For the final set of preplanned analyses we examined
extent = 442 mm) associated with activation spanning the right the conjunction of each distance effect compared with the
intraparietal sulcus and inferior parietal lobe (peak MNI coordi- distance effects of the other conditions to identify specific brain
nate: 33, −52, 43; t = 5.49, P = 0.000002; cluster size = 2718 voxels) regions associated with the processing of symbolic, nonsymbolic,
and regions in the right occipital fusiform gyrus (peak MNI and physical size magnitudes; for example, for symbolic
coordinate: 42, −61, −11; t = 5.87, P = 0.000001; cluster size = 9191 specific magnitude processing: [(symbolic distance 4 > symbolicMagnitude Processing in the Human Brain Sokolowski et al. 7
Downloaded from https://academic.oup.com/cercorcomms/article/2/3/tgab048/6326848 by guest on 12 September 2021
Figure 2. The neural rebound effects for nonsymbolic numerical magnitude processing (nonsymbolic distance 4 deviant > nonsymbolic distance 1 deviant), shown in
blue, physical size magnitude processing (physical size large change deviant > physical size small change deviant), shown in red, and symbolic numerical magnitude pro-
cessing > nonsymbolic numerical magnitude processing [(symbolic distance 4 deviant > symbolic distance 1 deviant) > (nonsymbolic distance 4 deviant > nonsymbolic
distance 1 deviant)], shown in green. This reveals the brain regions associated with the processing of nonsymbolic and physical size magnitude and a region that reflects
spatial separation for symbolic numerical magnitude processing.
distance 1) > (nonsymbolic distance 4 > nonsymbolic distance Numerical Magnitude Processing
1) ∩ (symbolic distance 4 > symbolic distance 1) > (physical size
Exploratory contrast analyses were computed to directly
large change > physical size small change)]. These analyses
compare brain modulation by distance for symbolic compared
resulted in no significant brain regions.
with nonsymbolic numerical magnitudes; that is, [(symbolic
distance 4 > symbolic distance 1) > (nonsymbolic distance
4 > nonsymbolic distance 1)] and its symmetrical cluster-level:
Exploratory Analyses
smoothing = 2.28; extent = 377 mm. Results revealed two brain
Findings from preregistered analyses hint that symbols might regions that exhibited greater activation for the symbolic
be processed partially distinctly from quantities and physical distance effect compared with the nonsymbolic distance effect,
size in the parietal lobes. It is notable that preregistered analy- namely the left superior frontal gyrus (peak MNI coordinate:
ses that addressed key predictions of overlap were all conjunc- −21, 32, 43; t = 4.13, P = 0.0002; cluster size = 499 voxels) and
tion analyses that included all three conditions. More specifi- left inferior parietal lobule, including the angular gyrus (peak
cally, for any region to be considered distinct, our preregistered MNI coordinate: −48, −64, 28; t = 4.45, P = 0.00006; cluster
analyses required that condition to be more strongly activated size = 908 voxels) (Fig. 2). There were no brain regions that
in a given brain region than the other two conditions. Simi- exhibited greater activation for the nonsymbolic compared
larly, for two regions to be considered overlapping, the overlap with the symbolic distance effect. An exploratory conjunction
had to be significant over and above activation of the third analysis used to compute overlap between the symbolic and
condition. nonsymbolic distance effects [(symbolic distance 4 > symbolic
Given that our preregistered analysis revealed substantial distance 1) ∩ (nonsymbolic distance 4 > nonsymbolic distance
overlap between physical size and nonsymbolic numerical 1)] resulted in no brain regions of significant overlap.
magnitude processing, we wanted to investigate the similarities
and difference between symbolic and nonsymbolic numerical
General Magnitude Processing
magnitude processing in the absence of the physical size
condition. Additionally, these preregistered findings highlight Exploratory conjunction and contrast analyses were also run to
the need to explore the similarities and differences between identify overlapping and distinct brain regions associated with
nonsymbolic numerical magnitude processing and physical size nonsymbolic and physical size distance effects. The contrast
in the absence of the symbolic number processing. Therefore, we analyses revealed no brain regions that were significantly
include follow-up contrast analyses to further probe overlapping associated with nonsymbolic distance effect > physical size dis-
and distinct brain regions associated with 1) symbolic and tance effect or with physical size distance effect > nonsymbolic
nonsymbolic distance effects and 2) nonsymbolic and physical distance effect. The conjunction analysis examining overlap-
size distance effects. ping activation between nonsymbolic magnitude processing8 Cerebral Cortex Communications, 2021, Vol. 2, No. 3
and physical size magnitude processing [(nonsymbolic distance represents a number that reflects the dissimilarities between the
4 > nonsymbolic distance 1) ∩ (physical size large change > physical activity patterns associated with the two experimental condi-
size small change)] resulted in small clusters in the right tions. Specifically, a Pearson correlation coefficient was calcu-
intraparietal sulcus (peak MNI coordinate: 30, −67, 40; t = 3.71, lated and subsequently transformed to a distance measure using
P = 0.0007; cluster size = 61 voxels) and right inferior temporal the equation: d = 1 − r. These calculated d values, thus, range
gyrus (peak MNI coordinate: 48, −58, −14; t = 4.04, p = 0.0002; from 0.0 (minimum distance) to 2.0 (maximum distance) with the
cluster size = 49 voxels), but these clusters did not survive cluster value “1.0” in the middle representing no correlation. These data
correction. are further visualized using multi-dimensional scaling (MDS)
Together, the preplanned combined with post hoc univariate plots, which depict the similarity between the conditions in a
analyses suggest that nonsymbolic magnitudes and physical size 2D representation (Fig. 3). Specifically, the conditions that are
are processed in the right intraparietal sulcus, whereas symbols positioned closer together on the MDS plot have more similar
are processed in the left inferior parietal lobule, when con- neural activation patterns. Notably, results from this multivariate
Downloaded from https://academic.oup.com/cercorcomms/article/2/3/tgab048/6326848 by guest on 12 September 2021
trasted against nonsymbolic numerical magnitude processing. analysis revealed that nonsymbolic magnitude processing and
While these analyses suggest some spatial distinction between physical size processing correlate more strongly at the multivari-
symbolic and nonsymbolic numerical magnitude processing, the ate level than either do with symbolic magnitude processing in
symbolic distance effect alone was not significant, and the right both the right and the left hemispheres. Notably, this pattern
IPS was not significant for nonsymbolic numerical magnitude of greater similarity between nonsymbolic and physical size
processing over and above symbolic numerical magnitude pro- compared with symbols is especially strong in the right hemi-
cessing. Therefore, while symbolic and nonsymbolic numeri- sphere. In sum, these multivariate results revealed a dissimilar
cal magnitude processing seems to be somewhat lateralized in normalized pattern of activation for symbolic compared with
the parietal cortex both formats may still activate overlapping nonsymbolic numerical magnitude processing in both the left
regions in the right IPS. Moreover, while nonsymbolic and phys- and right parietal lobes. Together the converging evidence from
ical size magnitudes appear to overlap in the right IPS the sta- the univariate and multivariate analyses show that, in the adult
tistical conjunction of nonsymbolic and physical size processing human brain, symbols are processed using distinct brain regions,
did not survive cluster correction and was not significant above and distinct patterns of activation, compared with nonsymbolic
symbolic numerical magnitude processing. This suggests that and non-numerical magnitudes.
while symbolic and nonsymbolic numerical magnitude process-
ing seems to be lateralized in the parietal cortex, both formats
Assessing the Symmetry of Distance Effects
may still activate overlapping regions.
Univariate analyses do not allow us to conclude that the The priority for the current study was to include a distance
underlying representations are unrelated. To address this out- of 1 and 4 without having a double-digit deviant or a deviant
standing issue, we used a multivariate approach to identify simi- of “zero” and avoiding the inclusion of any stimuli that were
larities and differences in the patterns of neural activity for sym- “congruent” (i.e., the symbolic and nonsymbolic stimuli being
bolic numerical magnitude processing, nonsymbolic numerical the same numerical magnitudes). This resulted in stimuli where
magnitude processing, and the processing of physical size. More the symbolic trials small change deviant is greater than the
specifically, we used the multivariate method representational habituation stimulus, whereas the large change deviant is less
similarity analysis (RSA) to extract information about distributed than the habituation stimulus, whereas for nonsymbolic and
patterns of representations within ROIs in the brain. This method non-numerical trials the paradigm is the reverse (large change is
is valuable in advancing our understanding of similarities and greater and small change is less than). This raises the legitimate
differences in the underlying representations of symbolic, non- question of whether or not the distance effects were symmetri-
symbolic, and non-numerical magnitudes, rather than coarsely cal, despite the asymmetry of the directions of change. Analyses
estimating spatial overlap. of reverse distance effects revealed no brain regions associated
with magnitude processing responded to distance 1 > distance 4
for any condition. To further probe this potential confound, we
Representational Similarity Analyses plotted the beta-weights within the 10-mm spheres generated
We implemented RSA using Brain Voyager 20.6 (Brain Innovation, from the numerical passive viewing map from Sokolowski, Fias,
Maastricht, the Netherlands) to analyze the similarity between Mousa, et al. (2017). These plots (Fig. 4) provide additional evi-
evoked functional magnetic resonance imaging (fMRI) responses dence that the distance 4–distance 1 contrast from the current
for the symbolic distance effect, the nonsymbolic distance effect, paradigm does indeed reflect magnitude processing in all condi-
and the physical size distance effect in select ROIs. The ROIs tions.
were constructed by creating a sphere with a radius of 10 mm
around the weighted centre of the bilateral parietal clusters
Discussion
in the numerical passive viewing map from Sokolowski, Fias,
Mousa, et al. (2017). The coordinates for the weighted centre of The goal of the current study was to examine whether the
the parietal clusters are 1) right hemisphere: MNI coordinates uniquely human capacity to process symbolic numerical mag-
(x, y, z): 26, −55, 53; 2) left hemisphere: MNI coordinates (x, y, z): nitudes relies on the same brain regions that support the pro-
−28, −67, 43. For each ROI, a representational distance (or dissim- cessing of nonsymbolic numerical magnitudes (i.e., quantities)
ilarity) matrix (RDM) was computed to assess the dissimilarity and/or non-numerical magnitudes (i.e., physical size). Parallel
between the symbolic distance effect, the nonsymbolic distance fMRI adaptation was used to isolate and directly compare the
effect, and the physical size distance effect (Fig. 3). Note that the semantic representations of symbols, quantities, and physical
correlation calculated between patterns reflects the similarity size while controlling for neural activation associated with other
of the spatial patterns since this measure abstracts from the conditions as well as for inherent confounds of active tasks
mean (and SD) of the original values. The RDM contains a cell (Grill-Spector et al. 2006). Key results revealed that nonsym-
for each pair of experimental conditions. The color of each cell bolic numerical magnitudes and non-numerical magnitudes (i.e.,Magnitude Processing in the Human Brain Sokolowski et al. 9
Downloaded from https://academic.oup.com/cercorcomms/article/2/3/tgab048/6326848 by guest on 12 September 2021
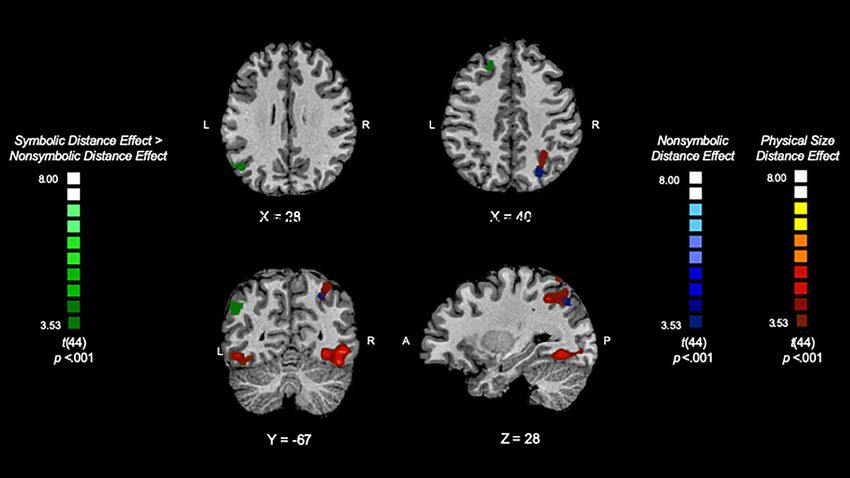
Figure 3. The left side of this figure illustrates the RDMs between the symbolic distance effect, the nonsymbolic distance effect, and the physical size distance effect in
the left (top) and right (bottom) hemispheres. The numerical values that correspond to colors in the RDM refer to the distance measure calculated using the equation:
d = 1 − r. Therefore, the values can range from 0.0 (minimum distance) to 2.0 (maximum distance) with the value “1.0” in the middle representing no correlation. The
right side of this figure depicts the MDS plots, which are visualizations of the similarity between the 3 distance effects (symbolic, nonsymbolic, physical size) in 2D
space. The MDS plot is a visualization of the distances between conditions in a 2D space that maximally satisfies the pairwise distances to all other conditions. The
left and right parietal ROIs were derived from the weighted centre of the bilateral parietal clusters in the numerical passive viewing map (Sokolowski, Fias, Mousa, et al.
2017).
Figure 4. Plotted beta-weights for all deviants (null, symbolic distance 1, symbolic distance 4, nonsymbolic distance 1, nonsymbolic distance 4, physical size distance 1,
physical size distance 4) in ROIs in the left inferior parietal lobule (left plot) and right inferior parietal lobule (right plot). ROIs were derived from the weighted centre of
the bilateral parietal clusters in the numerical passive viewing map from Sokolowski, Fias, Mousa, et al. (2017).
physical size) correlate with activation in the right intraparietal intraparietal sulcus is activated during nonsymbolic magnitude
sulcus, whereas symbolic numerical magnitudes are specifically processing but also potentially to a lesser degree during symbolic
associated with a region in the left inferior parietal lobule, but numerical magnitude processing (Sokolowski, Fias, Mousa, et al.
only when contrasted against nonsymbolic numerical magni- 2017). These findings align with previous research indicating
tudes. There were no brain regions that were significantly acti- that different number formats (symbolic and nonsymbolic) are
vated by magnitude processing of both symbols and quantities. lateralized within the parietal cortex (for review see: Sokolowski
The right IPS associated with nonsymbolic numerical magni- and Ansari 2016). At the multivariate level, normalized patterns
tude processing but was not activated over and above sym- of activation for symbolic numerical magnitude processing in
bolic numerical magnitude processing. The findings from the both the left and right parietal lobes were distinct from pat-
current study suggest that activation in the left parietal lobule terns of activation for nonsymbolic magnitude processing. These
is specific to symbolic number processing, whereas the right findings align with conclusions from some previous studies that10 Cerebral Cortex Communications, 2021, Vol. 2, No. 3
reveal qualitatively different coding of symbols compared with and Landauer 1967; Dehaene et al. 1998; Dehaene 2007; Cantlon
quantities in the brain (e.g., Bulthé et al. 2014; Lyons et al. 2014) 2012) the processing of symbols may be supported by a different,
but conflict with evidence revealing between-format generaliza- more exact system. It has been suggested that symbols are
tion (e.g., Eger et al. 2009; Damarla and Just 2013; Wilkey et al. understood based on their exact associations with other symbols
2020). Therefore, the findings from the current study challenge (e.g., a symbol’s position in the counting row; “3” comes after
the longstanding idea that symbolic numerical magnitudes are “2” and before “4”) (for review see, Núñez 2017). The few behav-
represented using entirely the same regions associated with the ioral and neuroimaging studies that have focused on uncovering
processing of nonsymbolic numerical magnitudes. Moreover, the the structure of the symbolic system propose that the system
findings from the current study suggest that a general magnitude supporting the processing of symbolic numerical magnitudes
system supports the processing of both discrete and continuous may be best characterized by relational properties between sym-
magnitudes, which is potentially also activated during the pro- bols (Krajcsi et al. 2016; Lyons and Beilock 2018). Conceptually,
cessing of symbols. this means that the symbolic number processing system might
Downloaded from https://academic.oup.com/cercorcomms/article/2/3/tgab048/6326848 by guest on 12 September 2021
Broadly, findings from the current study contradict the resemble a conceptual network or mental lexicon, rather than an
longstanding, predominant view in the field that symbolic analogue magnitude processing system. A related outstanding
and nonsymbolic numerical magnitudes are supported by a question that emerges from the current findings is “how did
single abstract number processing system (Dehaene et al. this unique symbolic system emerge across evolutionary and
1998; Brannon 2006; Piazza and Izard 2009; Cantlon et al. developmental time?” An alternate theory to the mapping of
2009a), and instead align with the view that symbolic and symbols onto an evolutionarily ancient abstract number process-
nonsymbolic numbers are processed using overlapping as well ing system is that a general magnitude system (that evolved
as distinct neural mechanisms (for review see: Cohen 2008; to compute continuous magnitudes [e.g., physical size]) was
Sokolowski and Ansari 2016; Sokolowski, Fias, Mousa, et al. exploited for the emergence of the numerical system (Cantlon
2017). Moreover, the findings from the current study support et al. 2009b; Henik et al. 2011; Leibovich et al. 2016). Based on
this idea without typical confounds present in other studies. evidence indicating that objects are organized within the visual
The parallel adaptation paradigm developed and employed cortex according to their real-world size (Konkle and Oliva 2012;
in the present study overcomes major confounds of previous Konkle and Caramazza 2013), it has been hypothesized that
research that use active tasks such as decision-making and conceptual size might serve as a bridge between continuous
motor processing for these active tasks (Grill-Spector et al. 2006). magnitudes and discrete quantities, including those represented
Indeed, previously reported overlapping activation during the by symbols (Gabay et al. 2016). However, future research is needed
processing of symbolic and nonsymbolic numerical magnitudes to uncover the exact structure of a symbolic specific system
could have resulted from overlapping task demands or the across development and subsequently discover how this system
effortful process of mapping symbols onto quantities in the case emerges.
of cross-format designs. Using our parallel adaptation approach, Here, we suggest the differences observed in the current study
we discovered that the underlying brain systems supporting on the neural correlates supporting the processing of symbols
symbolic number processing differ from those that correlate with and quantities are a consequence of these different formats
nonsymbolic magnitude processing in human adults, but not being supported by distinct systems. However, it must be noted
the reverse. Indeed, these data suggest that there is something that within these systems these differences could be attributed
special about symbols. to differences in representations, processing, or automaticity
Results from the current study also show that the brain of the formats. While the current study cannot identify with
regions that are activated in response to nonsymbolic numerical certainty which of these potential explanations explains these
magnitudes are highly similar to the regions that support the findings, we believe that the results from the current study do
processing of non-numerical magnitudes, specifically physical highlight the need to consider these differences and develop
size in the parietal lobe. Again, this finding that nonsymbolic novel paradigms that will enhance our understanding of what
numerical magnitudes and non-numerical magnitudes are drives the difference in neural representations of symbols com-
supported by the same neural substrates directly contradicts pared with quantities.
the prevailing view in numerical cognition that symbolic and
nonsymbolic numerical magnitudes are supported using an
abstract number processing system that is specifically attuned
Limitations
to the processing of discrete quantities (Dehaene et al. 1998; The current study has several limitations. First, as the stimuli
Dehaene et al. 2003; Brannon 2006; Nieder and Dehaene 2009; consist of arrays that include both symbolic and nonsymbolic
Cantlon 2012). Instead, our findings indicate that the system numerical magnitudes, the possibility that these different for-
used to process nonsymbolic numbers may be part of a general mats automatically influence each other during processing (e.g.,
magnitude processing system used to process both discrete as Morton 1969; Pansky and Algom 2002; Naparstek and Henik 2010)
well as continuous magnitudes (Walsh 2003; Cohen Kadosh et al. cannot be ruled out. However, the fact that a neural distance
2008; Lyons et al. 2012, 2014; Sokolowski, Fias, Ononye, et al. effect was found for both symbolic and nonsymbolic deviants,
2017). in distinct brain regions for symbolic, suggests that the paradigm
Findings from the current study support the idea that sym- captured elements of magnitude processing that were specific to
bolic number processing is supported by a partially dissociable each format. Second, due to attentional time constraints of the
system. Thus, we must consider the conceptual structure of participants, it was not possible to include multiple numerical
a symbolic specific system. A key element that differentiates values for the habituation stimulus and within deviant cate-
symbols from quantities is that without symbols, large quan- gories. Thus, the results from this study are specific to the par-
tities can only be represented approximately, whereas symbols ticular magnitudes we included and should not be generalized
can and in fact must be represented exactly. Therefore, while to all numerical magnitudes. Notably, previous single-format
quantities may be processed using an analogue number system, adaptation studies that include a single stimulus type for the
in which the representations are noisy or approximate (Moyer habituation stimulus that differ from the stimuli in the currentMagnitude Processing in the Human Brain Sokolowski et al. 11
study report highly similar adaptation effects (e.g., Notebaert (NSERC) (Grant no. 342192); Canada Research Chairs Program
et al. 2011; Holloway et al. 2013; Vogel et al. 2017). Relatedly, (CRC); Advanced Research Fellowship from the Klaus J. Jacobs
for the symbolic trials, small change deviant is greater than the Foundation (to D.A.); NSERC Doctoral Scholarship (to H.M.S.);
habituation stimulus, whereas the large change deviant is less SSHRC Doctoral Scholarship (to Z.H.).
than the habituation stimulus, whereas for nonsymbolic and
non-numerical trials the paradigm is the reverse (large change is
greater and small change is less than). This decision was made
to ensure that it was possible to include a distance of 1 and 4 References
without having a double-digit deviant or a deviant of “zero” and Ansari D. 2007. Does the parietal cortex distinguish
avoiding the inclusion of any stimuli that were “congruent” (i.e., between “10,” “ten,” and ten dots? Neuron. 53(2):165–167.
the symbolic and nonsymbolic stimuli being the same numerical 10.1016/j.neuron.2007.01.001.
magnitudes). Given the many behavioral, neurophysiological, Ansari D, Dhital B, Siong SC. 2006. Parametric effects of numer-
Downloaded from https://academic.oup.com/cercorcomms/article/2/3/tgab048/6326848 by guest on 12 September 2021
and neuroimaging studies suggesting symmetries in distance ical distance on the intraparietal sulcus during passive view-
effects, ratio effects, and tuning curves (e.g., Piazza et al. 2004; ing of rapid numerosity changes. Brain Res. 1067(1):181–188.
Jacob and Nieder 2009; Holloway et al. 2013), there is no strong 10.1016/j.brainres.2005.10.083.
prior for this being a confounding variable. Moreover, control Brannon EM. 2006. The representation of numerical magnitude.
analyses of the current data reveal that activation in magnitude Curr Opin Neurobiol. 16(2):222–229. 10.1016/j.conb.2006.03.002.
relevant regions increases as a function of numerical distance, Bulthé J, De Smedt B, Op de Beeck HP. 2014. Format-dependent
regardless of whether the stimulus is increasing or decreasing. representations of symbolic and non-symbolic numbers in the
Future research is needed to examine whether the key findings human cortex as revealed by multi-voxel pattern analyses.
from the current study that used parallel adaptation remain Neuroimage. 87:311–322. 10.1016/j.neuroimage.2013.10.049.
when including multiple different stimuli for the conditions for Cantlon JF. 2012. Math, monkeys, and the developing brain. Proc
both habituation and deviant stimuli. Natl Acad Sci. 109:10725–10732. 10.1073/pnas.1201893109.
Cantlon JF, Brannon EM, Carter EJ, Pelphrey KA. 2006. Functional
imaging of numerical processing in adults and 4-y-old children.
Conclusions
PLoS Biol. 4(5):e125. 10.1371/journal.pbio.0040125.
This study provides evidence in support of the idea that the Cantlon JF, Libertus ME, Pinel P, Dehaene S, Brannon EM,
human adult brain processes symbolic numerical magnitudes Pelphrey KA. 2009a. The neural development of an abstract
using some brain regions that are quite distinct from those concept of number. J Cogn Neurosci. 21(11):2217–2229.
that support the processing of nonsymbolic numerical magni- 10.1162/jocn.2008.21159.
tudes. Specifically, symbols, as compared with quantities, are Cantlon JF, Platt ML, Brannon EM. 2009b. Beyond the number
passively processed in the left parietal lobe, whereas quantities domain. Trends Cogn Sci. 13(2):83–91. 10.1016/j.tics.2008.11.007.
are processed the right parietal lobe, but not over and above Castaldi E, Piazza M, Dehaene S, Vignaud A, Eger E. 2019. Atten-
symbols. The non-numerical magnitude, physical size, is also tional amplification of neural codes for number independent
associated with brain activation in the right parietal lobe. RSA of other quantities along the dorsal visual stream. Elife. 8.
in the parietal lobes reveal that symbols are represented quite 10.7554/eLife.45160.
differently from quantities and physical size, which have similar Cohen KR. 2008. Numerical representation: abstract or
patterns of activation to each other. These findings conflict with nonabstract? Q J Exp Psychol (Hove). 61(8):1160–1168.
the dominant view in the field that symbolic and nonsymbolic 10.1080/17470210801994989.
numerical magnitudes are solely supported by a single abstract Cohen Kadosh R, Bahrami B, Walsh V, Butterworth B, Popescu
number processing system (Dehaene et al. 1998; Dehaene 2007; T, Price CJ. 2011. Specialization in the human brain: the
Nieder and Dehaene 2009; Cantlon 2012). Instead, data from case of numbers. Front Hum Neurosci. 5(July):62. 10.3389/fn-
the current study indicate that the human adult brain supports hum.2011.00062.
culturally acquired symbolic representations in a manner that is Cohen Kadosh R, Cohen Kadosh K, Kaas A, Henik A, Goebel
distinct from how the brain supports the evolutionarily ancient R. 2007a. Notation-dependent and-independent represen-
capacity to process nonsymbolic numerical magnitudes and the tations of numbers in the parietal lobes. Neuron. 53(2):
non-numerical magnitude, physical size. Our data highlight the 307–314.
need for the field of numerical cognition to shift away from con- Cohen Kadosh R, Lammertyn J, Izard VV. 2008. Are numbers
ducting research with the goal of canvassing the brain in search special? An overview of chronometric, neuroimaging, develop-
of an abstract number processing system. Instead, efforts should mental and comparative studies of magnitude representation.
be directed toward uncovering the multifaceted behavioral and Prog Neurobiol. 84(2):132–147. 10.1016/j.pneurobio.2007.11.001.
neural consequences of learning the complex, uniquely human Cohen Kadosh R, Walsh V. 2009. Numerical representation in
skill of symbolic abstraction. the parietal lobes: abstract or not abstract? Behav Brain Sci.
32:313–373.
Damarla SR, Just MA. 2013. Decoding the representation of
Notes
numerical values from brain activation patterns. Hum Brain
The researchers also acknowledge the Canada First Research Mapp. 34(10):2624–2634. 10.1002/hbm.22087.
Excellence Fund to BrainsCAN award. We would also like to thank Dehaene S. 2007. The number sense: how the mind creates mathemat-
the participants who volunteered their time to participate in this ics. New York, NY, USA: Oxford University Press. p. 1–267.
study. Conflict of Interest: None declared. Dehaene S, Dehaene-Lambertz G, Cohen L. 1998. Abstract repre-
sentations of numbers in the animal and human brain. Trends
Neurosci. 21(8):355–361.
Funding Dehaene S, Piazza M, Pinel P, Cohen L. 2003. Three parietal cir-
Canadian Institutes of Health Research (CIHR) (Grant no. 93609); cuits for number processing. Cogn Neuropsychol. 20(3):487–506.
National Sciences and Engineering Research Council of Canada 10.1080/02643290244000239.You can also read