Brain Structure Variation in Great Apes, With Attention to the Mountain Gorilla (Gorilla beringei beringei )
←
→
Page content transcription
If your browser does not render page correctly, please read the page content below
American Journal of Primatology 63:149–164 (2004)

RESEARCH ARTICLE
Brain Structure Variation in Great Apes, With Attention to
the Mountain Gorilla (Gorilla beringei beringei )
         CHET C. SHERWOOD1,2n, MICHAEL R. CRANFIELD3–5, PATRICK T. MEHLMAN2,6,8,
         ALECIA A. LILLY2,6,8, JO ANNE L. GARBE2,3, CHRISTOPHER A. WHITTIER3,7,
         FELICIA B. NUTTER3,7, THOMAS R. REIN9, HARLAN J. BRUNER9, RALPH L.
         HOLLOWAY10,11, CHEUK. Y. TANG12, THOMAS P. NAIDICH12, BRADLEY N.
         DELMAN12, H. DIETER STEKLIS6,13, JOSEPH M. ERWIN2, and PATRICK R.
         HOF2,9,11
         1
          Department of Anthropology and School of Biomedical Sciences, Kent State University,
         Kent, Ohio
         2
          Foundation for Comparative and Conservation Biology, Hagerstown, Maryland
         3
          Mountain Gorilla Veterinary Project, Ruhengeri, Rwanda
         4
          Medical Department, Baltimore Zoo, Baltimore, Maryland
         5
          Division of Comparative Medicine, School of Medicine, Johns Hopkins University,
         Baltimore, Maryland
         6
          Dian Fossey Gorilla Fund International, Atlanta, Georgia
         7
          Environmental Medicine Consortium and Department of Clinical Sciences, College of
         Veterinary Medicine, North Carolina State University, Raleigh, North Carolina
         8
          Department of Anthropology, SUNY at Stony Brook, New York, New York
         9
          Department of Neuroscience, Mount Sinai School of Medicine, New York, New York
         10
           Department of Anthropology, Columbia University, New York, New York
         11
           New York Consortium in Evolutionary Primatology, New York, New York
         12
           Department of Radiology, Mount Sinai School of Medicine, New York, New York
         13
           Department of Anthropology, Rutgers University, New Brunswick, New Jersey

         This report presents data regarding the brain structure of mountain
         gorillas (Gorilla beringei beringei) in comparison with other great apes.
         Magnetic resonance (MR) images of three mountain gorilla brains were
         obtained with a 3T scanner, and the volume of major neuroanatomical
         structures (neocortical gray matter, hippocampus, thalamus, striatum,
         and cerebellum) was measured. These data were included with our
         existing database that includes 23 chimpanzees, three western lowland
         gorillas, and six orang-utans. We defined a multidimensional space by
         calculating the principal components (PCs) from the correlation matrix of
         brain structure fractions in the well-represented sample of chimpanzees.
         We then plotted data from all of the taxa in this space to examine phyletic
         variation in neural organization. Most of the variance in mountain
         gorillas, as well as other great apes, was contained within the chimpanzee
         range along the first two PCs, which accounted for 61.73% of the total
         variance. Thus, the majority of interspecific variation in brain structure

Contract grant sponsor: Leakey Foundation; Contract grant sponsor: Wenner-Gren Foundation for
Anthropological Research; Contract grant sponsor: NSF; Contract grant number: BCS-0121286;
Contract grant sponsor: Mount Sinai School of Medicine.
n
 Correspondence to: Chet C. Sherwood, Department of Anthropology, Kent State University, 226
Lowry Hall, Kent, OH 44242-0001. E-mail: csherwoo@kent.edu
Received 2 February 2004; revised 25 May 2004; revision accepted 3 June 2004
DOI 10.1002/ajp.20048
Published online in Wiley InterScience (www.interscience.wiley.com).

r   2004 Wiley-Liss, Inc.
150 / Sherwood et al.
observed among these ape taxa was no greater than the within-species
variation seen in chimpanzees. The loadings on PCs indicated that the
brain structure of great apes differs among taxa
mostly in the relative sizes of the striatum, cerebellum, and hippocampus.
These findings suggest possible functional differences among taxa in
terms of neural adaptations for ecological and locomotor capacities.
Importantly, these results fill a critical gap in current knowledge
regarding great ape neuroanatomical diversity. Am. J. Primatol.
63:149–164, 2004. r 2004 Wiley-Liss, Inc.
Key words: gorilla; chimpanzee; orang-utan; great ape; comparative
neuroanatomy; magnetic resonance imaging
INTRODUCTION
The genus Gorilla occurs in two geographically discontinuous forest habitats,
in the west and east of equatorial Africa. Across their range of distribution, gorilla
populations display considerable diversity in their morphology [Groves, 2001;
Leigh et al., 2003], ecology, and behavior [Doran & McNeilage, 2001].
Furthermore, some researchers believe that mtDNA variation among gorilla
populations is sufficient to recognize separate eastern (Gorilla beringei) and
western (Gorilla gorilla) species, based on reproductive isolation between these
populations that may date back as far as 2 or 3 million years [Garner & Ryder,
1996; Ruvolo et al., 1994].
With the advent of magnetic resonance imaging (MRI), considerable data
have been amassed regarding the macrostructural organization of the brain in
great apes [e.g., Rilling & Insel, 1999; Semendeferi & Damasio, 2000]. Virtually
nothing is known, however, about how neuroanatomical structure in great ape
taxa varies with sex, age, or geographic origin. To date, brain structure volumes
have been reported for several western lowland gorillas (Gorilla gorilla gorilla)
[MacLeod et al., 2003; Rilling & Insel, 1999; Semendeferi & Damasio, 2000] and a
single eastern lowland gorilla (Gorilla beringei graueri) individual [Stephan et al.,
1981] (H.D. Frahm, personal communication). In this context, it is of interest to
know whether neuroanatomical structure varies between the distinct gorilla
populations of western and eastern Africa.
As part of an ongoing effort to document the behavior and biology of the
gorillas living in the east African volcanic highlands of the Virunga mountains
(Gorilla beringei beringei), we present neuroanatomical data from brains
obtained postmortem at the Parc National des Volcans, Rwanda. As an initial
step in examining neuroanatomical organization in the members of this critically
endangered mountain gorilla population, we obtained high-resolution MRI scans
and measured volumes of major brain structures. The purpose of this study was to
compare the brain structure of mountain gorillas with that of other great apes,
and to examine patterns of phyletic variation.
MATERIALS AND METHODS
Specimens and Preparation
A total of 35 postmortem great ape brains were used in the present study
(Table I). Brain specimens of G. g. gorilla, Pan troglodytes, and Pongo pygmaeus
were collected in the context of the Great Ape Aging Project and derived fromBrain Structure of Mountain Gorillas / 151
TABLE I. Structure Volumes From Formalin-Fixed Brains (Volumes in cm3)
Species Sex Age Whole Neo- Hippo- Striatum Thalamus Cerebellum
Brain cortex campus
Gorilla beringei F B2.5 401.6 182.5 2.4 9.0 8.2 51.6
beringei M 5 460.6 214.9 3.4 8.2 8.3 52.3
M 25–30 486.7 208.4 3.7 8.0 10.2 59.5
Gorilla gorilla F 50 490.2 224.0 3.5 6.3 9.9 64.5
gorilla M 25 459.4 225.6 3.4 8.6 11.4 76.6
M 42 564.3 228.8 4.3 7.3 11.0 78.0
Pongo pygmaeus F 17 311.2 149.8 2.0 5.5 6.3 46.4
F 23 394.1 170.1 3.1 9.6 9.7 50.2
F 33 298.6 138.6 2.2 5.6 6.8 36.2
M 11 374.1 170.8 2.6 9.0 8.5 46.2
M 24 344.7 144.2 2.5 7.5 7.5 46.4
M 37 370.3 174.3 3.0 6.8 7.2 43.8
Pan troglodytes F 13 299.0 142.8 2.7 6.8 6.7 42.0
F 15 262.0 108.0 2.0 5.8 7.2 43.8
F 18 343.9 154.7 2.5 6.3 7.6 44.4
F 19 229.2 142.1 2.5 4.6 5.9 35.6
F 25 354.3 166.6 3.1 7.9 6.8 44.2
F 27 314.3 154.0 3.1 6.4 7.4 45.2
F 33 373.5 165.6 3.1 7.9 7.7 50.2
F 35 348.1 184.8 2.9 6.2 9.0 50.6
F 36 355.9 166.6 2.3 6.6 6.5 48.0
F 37 297.7 129.5 2.5 5.5 6.4 40.0
F 38 370.7 174.3 3.3 6.7 7.7 42.8
F 40 345.3 155.4 3.6 7.5 6.8 43.6
F 41 327.8 152.6 2.9 6.8 9.1 47.8
F 42 324.2 149.1 3.4 5.8 7.4 48.8
F 44 332.9 163.1 3.4 6.4 7.0 50.8
F 45 312.9 168.7 2.8 5.2 6.7 41.0
F 50 344.6 159.6 3.1 6.5 6.8 45.2
M 10 353.5 162.4 3.0 7.7 7.4 47.8
M 17 384.0 200.9 3.1 7.5 7.9 59.8
M 19 364.6 172.9 3.2 6.5 8.4 60.6
M 20 414.3 180.6 2.7 9.6 11.0 58.6
M 39 345.4 149.8 3.0 6.4 7.7 50.4
M 40 341.2 155.4 3.2 7.2 8.0 41.4
M 41 377.2 167.3 3.5 7.6 7.5 46.8
captive animals housed in zoological and research facilities. Mountain gorilla
brains were collected postmortem by staff of the Mountain Gorilla Veterinary
Project and the Dian Fossey Gorilla Fund International from wild animals located
at the Parc National des Volcans, Rwanda. A total of eight mountain gorilla
brains were obtained; however, only three specimens were preserved entirely free
of morphologic distortion (Fig. 1).Volumetric data from these three G. b. beringei
(a B25–30-year-old male, a 5-year-old male, and a B2.5-year-old female)
specimens were included with our database of three G. g. gorilla, 23 Pan
troglodytes troglodytes, and six Pongo pygmaeus pygmaeus. Only brains from152 / Sherwood et al. Fig. 1. External morphology of western lowland (G. g. gorilla) and mountain gorilla (G. b. beringei) brains. An adult male western lowland gorilla brain is shown in right lateral (A), left lateral (B), dorsal (C), and ventral (D) views. An adult male mountain gorilla brain is shown in right lateral (E), left lateral (F), dorsal (G), and ventral (H) views.
Brain Structure of Mountain Gorillas / 153

individuals 410 years of age were included, with the exception of the 2.5-year-old
female and 5-year-old male mountain gorillas. Adult brain size is attained by 7
years of age in chimpanzees [Herndon et al., 1999] (the only great ape for which
there are significant data) several years prior to sexual maturation [Harvey et al.,
1987]. Since gorillas and orang-utans reach sexual maturity approximately 3
years earlier than chimpanzees [Harvey et al., 1987], the brain of the 5-year-old
male mountain gorilla is probably very close to adult size. The brain of the 2.5-
year-old female mountain gorilla should be considered that of a juvenile.
Nonetheless, given the rarity of mountain gorilla brains in comparative
neuroanatomic studies, we deemed it valuable to retain this individual in our
analysis. Furthermore, the statistical results we report were not significantly
affected by the inclusion of this specimen.
     All animals used in this study had died of non-neurological causes, and all
brains were screened for pathology upon radiological assessment. Whole
mountain gorilla brains were removed 24–36 hours after death and immediately
fixed by immersion in 4% paraformaldehyde. The brains of the other great apes
were removed within 12 hr after death and immersion-fixed in 4% paraformalde-
hyde. All of the brains remained in fixative for a minimum of 2 weeks prior to the
MRI acquisitions. Whenever possible, the brains were transferred from fixative to
0.1 M phosphate-buffered saline (PBS) + 0.1% sodium azide after 2 weeks to
prevent excessive tissue shrinkage. We accounted for differences among speci-
mens in shrinkage due to fixation by analyzing only relative measures of brain
structure volumes as a fraction of whole-brain volume (described below). We did
not correct the data for within-brain differential shrinkage of regions or tissue
types (gray matter vs. white matter). Studies of formalin-fixed and embedded
brains have shown that differential shrinkage of regions and tissue types is
minimal. Kretschmann et al. [1982] found a greater amount of shrinkage (mean
= 9%) of gray matter compared to white matter in brains that had been embedded
in paraffin. Bush and Allman [2004] reported a 0.5–1.6% difference in shrinkage
between regions of the neocortex in celloidin-embedded specimens. The error in
our data due to differential shrinkage is likely to be even less than that in the
previous reports because the brains were not subjected to further processing for
embedding. In preparation for scanning, the brain specimens were submerged in
a plastic container filled with 0.1 M PBS, vacuumed to remove air bubbles, and
packed tightly with gauze to reduce movement artifacts.

MRI Acquisitions
     MR images of mountain gorilla brains were acquired on a Siemens 3T Allegra
(Siemens Medical System, Erlangen, Germany) running Syngo 2002B software.
Coronal T1-weighted MR images were acquired through the entire brain with
repetition time (TR) ¼ 2500 ms and echo time (TE) ¼ 4.4 ms with an echo-train of
1. Slices were obtained as 0.7-mm-thick contiguous sections with a matrix size of
256  256 and a field of view (FOV) of 18.0 cm  18.0 cm, resulting in a final voxel
size of 0.7  0.7  0.7 mm. MRI scans of other great ape specimens were acquired
on a commercial 1.5T GE high-gradient MRI scanner equipped with 8.3 software
(GE Medical Systems, Milwaukee, WI). Coronal T1-weighted MR images were
acquired through the entire brain with TR ¼ 666.7 ms and TE ¼ 14.5 ms with an
echo-train of 2. Slices were obtained as 1.5-mm-thick contiguous sections with a
matrix size of 256  256 and an FOV of 16.0 cm  16.0 cm, resulting in a final
voxel size of 0.625  0.625  1.5 mm. Due to logistical constraints, different
scanners and protocols were used for the mountain gorilla specimens compared to
154 / Sherwood et al.
Fig. 2. Coronal T1-weighted MRI sections through great ape brains at the level of the substantia
nigra.
other great apes. However, in-plane effective resolution was similar between the
samples (0.7 0.7 mm vs. 0.625 0.625 mm), and there was sufficient contrast in
all of the images to clearly identify the boundaries of the anatomical structures
measured (Fig. 2). All brains were scanned in standard anatomical orientation
with the transaxial plane parallel to the anterior commissure-posterior
commissure (AC-PC) line and perpendicular to the interhemispheric fissure
[Talairach & Tournoux, 1988]. We obtained initial localizing MR images in three
orthogonal planes to visualize specimen orientation. We then planned the true
coronal scans by orienting the imaging plane perpendicular to the AC-PC line
calculated from the localizing images. Data were transferred electronically to
eFilm software (version 1.5.3; eFilm Medical, Toronto, Canada) for offline
processing. Computer files were numerically coded prior to measurement to
prevent observer bias.
ROI Segmentation
All acquired slices were converted into the ANALYZE 3D volume file format,
and measurements were performed with the use of MRIcro software version 1.27
[Rorden & Brett, 2000] on a PC workstation. With the MRIcro software package,
one can interactively define and edit regions of interest (ROIs) in three
orthogonal planes, and accurately segment structures based on visualization ofBrain Structure of Mountain Gorillas / 155 several anatomical views. We measured the ROI volumes by manually tracing the anatomical boundaries of structures in two-dimensional slices. We calculated the total ROI volume by multiplying the sum of the contour areas in each slice by the interval distance. The caudate nucleus, putamen, thalamus, and hippocampus were measured in all slices in which they appeared. The cerebellum was measured in every other section, and the neocortex was measured in every sixth slice. For ROIs that were not measured in every slice, the slices were sampled in a systematic random fashion. This approach resulted in measurements of at least 12 equidistant slices for each ROI (Fig. 3). Each structure was measured by a single observer who was blind to the identity of the specimen. A subset of five randomly-selected individuals was used to determine measurement reliability for each ROI. Across this set of 30 measurements, intra-rater measurement error was calculated as the percent difference between repeated measurements. Inter- rater measurement error was calculated as the percent difference between measurements by two separate observers. The mean intra-rater measurement error was 4.29%73.38% (mean7standard deviation (SD)), and the inter-rater Fig. 3. Coronal T1-weighted MRI sections through the brain of a mountain gorilla. Sections are arranged rostral to caudal (A–F). Boundaries of ROI segmentation are shown on the left hemisphere.
156 / Sherwood et al.

measurement error was 8.61%76.34%. The level of measurement error was not
correlated with structure size.
     The ROIs were segmented according to protocols described in previous
volumetric MRI studies of human and nonhuman primate brains [Honeycutt
et al., 1998; Lemieux et al., 2000; Matochik et al., 2000; Rilling & Insel, 1999; van
Der Werf et al., 2001], so they are described here only in brief. The volume of the
striatum was calculated as the sum of the caudate nucleus and the putamen. The
caudate nucleus was bounded medially by the lateral ventricle, and laterally by
the anterior limb of the internal capsule. To exclude the nucleus accumbens from
the caudate measurements, the inferior boundary of the caudate was consistently
set as the transaxial level immediately superior to the appearance of the AC. The
tail of the caudate nucleus was not included. The putamen was bounded by the
external capsule laterally, and the internal capsule and globus pallidus medially.
Segmentation of the cerebellum included cerebellar gray matter, white matter,
deep nuclei, and peduncles. The main body of the thalamus was bordered
medially by the third ventricle, dorsally by the lateral ventricles, and laterally
by the internal capsule. The medial and lateral geniculate nuclei were included
in outlines of the thalamus. The images had adequate contrast and resolution for
us to clearly identify the zona incerta, subthalamic nucleus, substantia nigra,
and red nucleus. Therefore, we were able to define the ventral boundary of the
thalamus to exclude hypothalamic and midbrain regions. The hippocampal
formation, including the dentate gyrus, hippocampus proper, and subiculum,
was measured as a single structure. The mesial boundary of the hippocampus was
defined where the subiculum transitions into the parahippocampal gyrus.
This boundary was delimited as a line running from the underlying white matter
to the crown of the parahippocampal gyrus. Tissue located mesial to the
uncal notch was excluded from the hippocampal measurement. Finally,
neocortical (isocortical) gray matter measurements included the entire cortical
mantle, excluding cortex located mesial to the rhinal sulcus. According to these
criteria, our definition of neocortical gray matter also includes the proisocortex
(cingulate gyrus, rostral insula, and temporal pole), but does not include
the periallocortex (entorhinal cortex) or allocortex (olfactory cortex and
hippocampus).
     Since the sample sizes for the gorillas and orang-utans were small, we did not
analyze interhemispheric asymmetry. We added the volumes of bilateral
structures to obtain a total ROI volume. For a few cases in which only one brain
hemisphere was available (one G. g. gorilla and two P. troglodytes), we doubled
the measurement results to obtain the total ROI volume.

Whole-Brain Volume Measurement
    Whole-brain volume was measured with the use of ImageJ software version
1.26t (http://rsb.info.nih.gov/ij/). In each slice, we identified voxels representing
gray matter, white matter, and ventricular space, and separated them from
the surrounding gauze using a combination of semiautomated thresholding
and observer judgment to define the brain’s outer margin. The entirety of the
cerebral hemispheres, cerebellum, midbrain, and brainstem were included in
the measurement of brain volume. The volume corresponding to these voxels
was calculated for each slice and summed for the whole-brain volume. Because of
the high level of contrast between brain tissue and the surrounding medium,
this method yielded reliable estimates of brain volume, with an intra-rater
Brain Structure of Mountain Gorillas / 157
measurement error of 1.03%70.57%, and an inter-rater measurement error of
2.92%75.12%.
Statistical Methods
To compare brain composition among the taxa, we calculated the fraction of
total brain volume comprised by each brain structure. Previous studies of relative
brain structure volumes normalized in this manner have demonstrated
correlations with behavioral traits across mammals and birds [Burish et al.,
2004; Clark et al., 2001]. We chose this method because our goal in this study was
to assess phyletic variation in the overall organization of brain structures using
principal components analysis (PCA) as a data reduction and visualization
method. For this purpose, the composite of brain structure fractions represents a
trade-off between the relative sizes of the structures that comprise the total brain
volume. For the current study, this method was favored over adjusting structure
sizes for allometric scaling effects by using residuals from the best-fit line relative
to brain volume. The residuals method of normalization has several drawbacks
(for discussion see Burish et al. [2004]) that are especially problematic for the
current data. In particular, an empirical estimation of the best-fit line is
dependent upon the line-fitting method used, as well as the taxonomic level and
composition of the reference group [Harvey & Krebs, 1990; Holloway & Post,
1982]. This can lead to idiosyncratic artifacts based on sampling that are difficult
to interpret in a strictly biological sense. Since the current data set consists of
only a few closely related taxa, with uneven samples of individuals within each
taxon, it is unclear how a best-fit line to these data would afford an unbiased
correction of allometric scaling. In contrast, when one normalizes structure sizes
to overall brain size by taking a simple fraction, their values are not affected by
the ambiguities associated with estimating interspecific scaling relationships. In
addition, a further advantage of using ratio values is that they serve as an
internal correction for variation in shrinkage due to fixation differences across
specimens. Despite these advantages, however, ratio measures have been
criticized for being prone to autocorrelation, with the largest structure in the
brain (e.g., neocortex) disproportionately determining the other ratio values. In
our data set, however, the neocortex fraction was not correlated with the total
brain volume (r ¼ 0.239, P ¼ 0.167).
RESULTS
As previously observed, the overall shape of the brain in both western
lowland and mountain gorillas is dorsoventrally flattened, with a less globular
frontal lobe than that in other great apes [Connolly, 1950]. The external sulcal
patterns of mountain gorillas (n ¼ 8) also closely resemble those of western
lowland gorillas (Fig. 1). In specific, both taxa tend to have a continuous inferior
precentral sulcus that runs parallel to the central sulcus. Chimpanzees, on the
other hand, exhibit a greater degree of variation in the pattern of sulci in the
region of the inferior frontal gyrus, with more frequent bifurcations and
discontinuities of the inferior precentral sulcus [Sherwood et al., 2003]. Other
aspects of mountain gorilla sulcal anatomy closely resemble patterns observed in
other great ape species. The superior parietal lobule is highly fissurated, and the
lunate sulcus can be seen on the dorsolateral surface of the occipital lobe in the
typical anterior location of most anthropoid species. Unfortunately, postmortem158 / Sherwood et al.
gross anatomic distortion prohibited examination of petalia patterns in the
majority of the specimens.
The results of volumetric measurements based on MRI of postmortem
formalin-fixed specimens are provided in Table I. Species mean brain volumes in
the present study fall within the range of species means found in the published
literature based on fresh postmortem tissue, in vivo MRI, and cranial capacity
[Herndon et al., 1999; MacLeod et al., 2003; Rilling & Insel, 1999; Stephan et al.,
1981; Tobias, 1971; Zilles & Rehkämper, 1988]. It should be emphasized,
however, that the volumetric data reported in Table I are subject to shrinkage
artifacts from fixation effects in individual cases. Therefore, our analyses were
performed on brain structure volume fractions, which take overall brain volume
shrinkage into account. Figure 4 shows the distribution of brain structure
fractions in each taxon. Across all specimens, the sum total of regional brain
0.56 0.011
0.54
0.010
0.52
Hippocampus fraction
Neocortex fraction
0.50 0.009
0.48
0.008
0.46
*
0.44 0.007
0.42
0.006
0.40 *
0.38 0.005
Gbb Ggg Pp Pt Gbb Ggg Pp Pt
0.030 0.026 0.17
0.028 0.024
0.16
0.026 0.022 *
Cerebellum fraction
0.15
Striatum fraction
Thalamus fraction
0.024 0.020
0.14
0.022 0.018
0.13
0.020 * 0.016 *
0.12
0.018 0.014
0.016 0.012 0.11
Gbb Ggg Pp Pt Gbb Ggg Pp Pt Gbb Ggg Pp Pt
Fig. 4. Distribution of brain structure fractions. Means are indicated by horizontal lines. Gbb,
Gorilla beringei beringei; Ggg, Gorilla gorilla gorilla; Pp, Pongo pygmaeus; Pt, Pan troglodytes. The
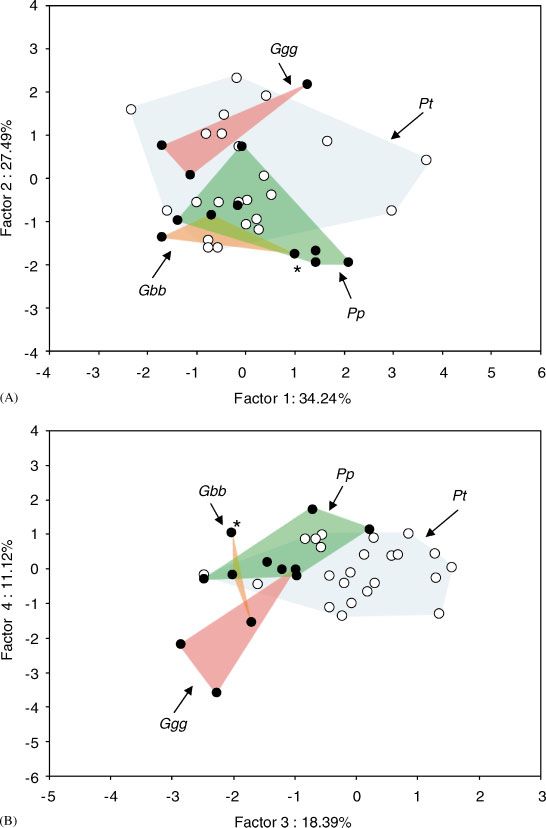
2.5-year-old female mountain gorilla data are indicated by an asterisk.Brain Structure of Mountain Gorillas / 159 Fig. 5. PCA plots of brain structure fractions (shown in Fig. 3). The PC axes were calculated from only P. troglodytes data. All great ape data are plotted in the vector space defined by chimpanzees. Gbb, Gorilla beringei beringei; Ggg, Gorilla gorilla gorilla; Pp, Pongo pygmaeus; Pt, Pan troglodytes. The 2.5-year-old female mountain gorilla data are indicated by an asterisk.
160 / Sherwood et al.

TABLE II. Principal Components Analysis (PCA) Loadings: Based on the P. troglodytes
sample

Variable                         Factor 1              Factor 2             Factor 3
Neocortex fraction                0.551                0.633               0.051
Hippocampus fraction              0.449                0.071                0.880
Striatum fraction                  0.607               0.525                0.332
Thalamus fraction                  0.750                0.439                0.138
Cerebellum fraction                0.525                0.707                0.118
Percent of variance               34.24%               27.49%               18.39%

structure volumes constituted 66% 7 5% of brain volume. Of note, for every
brain structure, the range of values in the chimpanzee sample encompassed much
of the range of variation found in all other species. A one-way analysis of variance
(ANOVA) of genus-level differences in brain structure fractions revealed that
chimpanzees have a significantly larger hippocampus fraction than the other apes
(F2,32 ¼ 9.79, Po0.001; Bonferroni post hoc: Po0.01), and gorillas have a smaller
striatum fraction (F2,32 ¼ 4.69, P ¼ 0.016; Bonferroni post hoc: Po0.05). No other
comparisons were significant.
     We defined a multidimensional space by calculating the PCs from the
correlation matrix of brain structure fractions in the sample of 23 chimpanzees.
Only the chimpanzee sample was used to compute the PCs. Because of its
relatively large sample size, it is assumed that the chimpanzee sample best
captures the variance structure among brain parts. Brains from young as well as
elderly adults of both sexes were included in the chimpanzee sample. Therefore,
our calculation of variation in the chimpanzee data includes potential sex- and
age-related differences in brain composition. To determine whether there were
systematic age or sex differences in our data, we replotted points in the
multivariate space and labeled them according to age class and sex (data not
shown). Individuals were not differentiated on the PC functions according to
these denominations. Data from all great ape taxa were then plotted onto the
vector space defined by chimpanzees, and minimum convex polygons were
constructed to illustrate morphometric distances (Fig. 5).
     The first three PCs accounted for 80.12% of the total variance in the
chimpanzee data, and were used for further data interpretation. Table II displays
the factor loadings of these PCs, as well as the percentage of the variance in
chimpanzees accounted for by each PC axis.
     PC 1 shows marked overlap among gorilla and orang-utan individuals, and
contains all the variance of these great ape species within the subspace defined by
chimpanzees. This factor loads fairly equally on all variables. It is positively
correlated with subcortical structures (i.e., the thalamus, striatum, and
cerebellum), and negatively correlated with cortical structures (i.e., the neocortex
and hippocampus), indicating the reciprocal nature of the largest dimension of
variation in great ape brain composition.
     PC 2 has positive loadings on the cerebellum, thalamus, and neocortex, and
loads negatively on the striatum. Like PC 1, this important axis also captures
most of the variance in other great apes within the range of chimpanzees,
although a few orang-utans fall outside this region in the negative direction. Of
note, G. g. gorilla and G. b. beringei occupy opposite poles along PC 2,
with no overlap between them. Orang-utan data points on this axis are located
Brain Structure of Mountain Gorillas / 161
across the range defined by both gorilla taxa, with the bulk clustering with G. b.
beringei.
PC 3, which loads predominantly on the hippocampus, separates a large cloud
of chimpanzee data from the data of other great apes. On this PC, the G. b.
beringei points are contained within the range of G. g. gorilla. As already
indicated, chimpanzees have a larger hippocampus fraction than other great apes.
DISCUSSION
This study reports a comparison of brain structure composition in mountain
gorillas and other great ape species based on volumetric MRI and PCA. We used a
well-represented chimpanzee sample to calculate the PC axes, and plotted the
other great ape data within this multidimensional space. Overall, this analysis
shows marked commonalities across great ape taxa in terms of brain structure.
Nonetheless, subtle anatomic differences may distinguish the brains of mountain
gorillas and other taxa.
Levels of Variation
We found that most of the variance in mountain gorillas, as well as western
lowland gorillas and orang-utans, is contained within the chimpanzee range along
the first two PC axes, which together account for 61.73% of the variance. This
suggests that there is a common Bauplan to great ape brain macrostructural
organization, and most of the observed interspecific variation does not extend
beyond the level of normal interindividual within-species variation, as seen in
chimpanzees. This result is also interesting considering that our sample
represents the added variance of including both wild and captive animals.
Unfortunately, the possible effects of impoverished captive environments cannot
be disentangled from phylogenic differences because the only wild individuals in
the sample were of the same taxon, G. b. beringei. However, it is worth noting that
the data points from these wild mountain gorillas were found within the range of
variation defined by the captive chimpanzee and orang-utan polygons in
multivariate space.
An important feature of the present study was the inclusion of a fairly large
sample of chimpanzee brains (n ¼ 23). To date, these data represent the largest
sample of volumetric brain proportions available for any great ape species.
Therefore, our findings call attention to potential sampling errors that may
confound other studies based on limited sample sizes. For example, the data on
hominoid brain structure volumes reported by Stephan and colleagues [1970,
1981] were derived from a single individual representing each of the following
species: Hylobates lar, Gorilla gorilla (Gorilla beringei graueri), Pan troglodytes,
and Homo sapiens. Nevertheless, this data set has been employed by many
authors to draw conclusions about the coevolution of neuroanatomical structure
and a panoply of life history and socioecological adaptations in great apes and
humans [e.g., Dunbar, 1992; Joffe & Dunbar, 1997; Reader & Laland, 2002;
Sawaguchi, 1992]. In these cases, however, the effects of sampling error may have
profound consequences for data interpretation. As an illustration of this problem,
consider what could happen if a single mountain gorilla were selected at
random from our small sample. Depending on which individual was selected, its
brain proportions may either be contained entirely within the chimpanzee
range of variation along all PC axes, or, alternatively, it may fall outside the
chimpanzee range for several PC factors. In sum, the present findings on162 / Sherwood et al.
intraspecific variation in chimpanzees indicate that researchers should exercise
considerable caution in making conclusions about species-typical attributes when
only small intraspecific samples are available for obtaining data on brain
structure.
Potential Variation Among Mountain Gorillas, Western Lowland
Gorillas, and Other Great Apes
Based on the small samples currently available, our preliminary findings
suggest that there are some differences in brain structure among great ape
species. Mountain gorillas and western lowland gorillas were separated along PC
2, an axis that loads positively on the cerebellum and neocortex, and negatively on
the striatum. Here, G. b. beringei individuals are differentiated from G. g. gorilla
individuals in that the former have a relatively smaller cerebellum in combination
with a relatively larger striatum. Previous comparative volumetric studies have
noted that, compared to other hominoids, G. g. gorilla have a proportionally large
cerebellum relative to brain size [Rilling & Insel, 1998; Semendeferi & Damasio,
2000; Stephan et al., 1981]. Our data corroborate and extend these observations.
Although we found that G. g. gorilla has a relatively large cerebellum compared
to other great apes, we also found that the cerebellum of G. b. beringei is relatively
small. Interestingly, chimpanzee and orang-utan data were plotted along PC 2
between the two gorilla taxa. Another striking pattern was the distribution of
data along PC 3. This is a less important factor, but one that is associated most
strongly with relative hippocampus size. Individuals of P. troglodytes were
separated from other great apes on this PC axis, based on a large hippocampus
relative to brain size.
Our data suggest that the brain structure of great apes differs mostly in the
relative sizes of the striatum, cerebellum, and hippocampus. These findings are
especially interesting considering the central role of these structures in ecological
and locomotor functions. Volumetric studies in a range of animals, including
polygynous male voles [e.g., Jacobs et al., 1990], a number of food-storing birds
[e.g., Krebs, 1990; Shettleworth, 2003], and London taxi drivers [Maguire et al.,
2000] have shown that the size of the hippocampus, a brain region essential to
spatial learning and memory, is relatively enlarged in individuals who face
ecological challenges that place extra demands on this cognitive capacity. Hence,
the larger hippocampal size in chimpanzees may reflect a greater dependence on a
frugivorous diet [Malenky et al., 1994] and the accompanying increased demands
on spatial memory; however, this is speculative. The size of the lateral
cerebellum, the largest component of the cerebellum in hominoids, has been
linked to locomotor adaptations for the planning of sequential movements, such
as those employed in arboreal quadrumanuous climbing, and suspensory postures
when moving in trees [MacLeod et al., 2003]. The more terrestrial lifestyle of
mountain gorillas compared to western lowland gorillas [Doran & McNeilage,
2001] would appear to be consistent with our finding of a relatively smaller
cerebellum in this taxon. However, it is unclear why orang-utans cluster with
mountain gorillas on PC 2, as they are highly skilled at quadrumanuous
clambering in tree crowns [Fleagle, 1999; Povinelli & Cant, 1995], a feat that
would seem to require the type of precise timing of motor sequences supported by
cerebellar circuits.
Interpretations of macrostructural variation in these taxa must remain
provisional until further specimens can be analyzed and sample sizes are
increased. Furthermore, histological studies of cyto- and chemoarchitecturalBrain Structure of Mountain Gorillas / 163
staining patterns are needed to investigate possible microstructural specializa-
tions of the mountain gorilla brain. In this respect, the preliminary data
reported here underscore the need to study these unique animals. Considering
the critically endangered conservation status of mountain gorillas, documenta-
tion of their biological distinctiveness is essential for their management and
protection. In the present study, we took the opportunity afforded by a
collaborative research effort including field veterinarians, hospital radiologists,
anthropologists, and neuroscientists to provide these first data on the brain
organization of mountain gorillas. This collaborative model should be
applied to further our knowledge concerning the biology of other endangered
species.
ACKNOWLEDGMENTS
We thank Dr. R.S. Meindl, C.E. MacLeod, S.C. McFarlin, and M.A. Raghanti
for helpful discussion. J.C. Gentile, K. Fawcett, M. Gray, C. Buitron, and V.V.
Oruganti provided expert technical assistance. We thank the Office Rwandais du
Tourisme et des Parcs Nationaux for allowing examination of the mountain
gorilla specimens. Other great ape specimens used in this study were on loan to
the Comparative Neurobiology of Aging Resource (supported by NIH AG14308).
P.R.H. is the Regenstreif Professor of Neuroscience.
REFERENCES
Burish MJ, Kueh HY, Wang SS. 2004. Brain Harvey PH, Martin RD, Clutton-Brock TH.
architecture and social complexity in mod- 1987. Life histories in comparative perspec-
ern and ancient birds. Brain Behav Evol tive. In: Smuts BB, Cheney DL, Seyfarth
63:107–124. RM, Wrangham RW, Strusaker TT, editors.
Bush EC, Allman JM. 2004. The scaling of Primate societies. Chicago: University of
frontal cortex in primates and carnivores. Chicago Press. p 181–196.
Proc Natl Acad Sci U S A 101:3962–3966. Harvey PH, Krebs JR. 1990. Comparing
Clark DA, Mitra PP, Wang SS. 2001. Scalable brains. Science 249:140–146.
architecture in mammalian brains. Nature Herndon JG, Tigges J, Anderson DC, Klumpp
411:189–193. SA, McClure HM. 1999. Brain weight
Connolly CJ. 1950. The external morphology throughout the life span of the chimpanzee.
of the primate brain. Springfield, IL: C.C. J Comp Neurol 409:567–572.
Thomas. 378p. Holloway RL, Post DG. 1982. The relativity of
Doran DM, McNeilage A. 2001. Subspecific relative brain measures and hominid mosaic
variation in gorilla behavior: the influence evolution. In: Armstrong E, Falk D, editors.
of ecological and social factors. In: Robbins Primate brain evolution: methods and con-
MM, Sicotte P, Stewart KJ, editors. Moun- cepts. New York: Plenum Press. p 57–76.
tain gorillas: three decades of research at Honeycutt NA, Smith PD, Aylward E, Li Q,
Karisoke. Cambridge: Cambridge Univer- Chan M, Barta PE, Pearlson GD. 1998.
sity Press. p 123–149. Mesial temporal lobe measurements on
Dunbar RIM. 1992. Neocortex size as a magnetic resonance imaging scans. Psy-
constraint on group size in primates. J chiatry Res 83:85–94.
Hum Evol 20:469–493. Jacobs LF, Gaulin SJ, Sherry DF, Hoffman
Fleagle JG. 1999. Primate adaptation and GE. 1990. Evolution of spatial cognition:
evolution. San Diego: Academic Press. sex-specific patterns of spatial behavior
596p. predict hippocampal size. Proc Natl Acad
Garner KJ, Ryder OA. 1996. Mitochondrial Sci U S A 87:6349–6352.
DNA diversity in gorillas. Mol Phylogenet Joffe TH, Dunbar RIM. 1997. Visual and
Evol 6:39–48. socio-cognitive information processing in
Groves C. 2001. Primate taxonomy. Washing- primate brain evolution. Proc R Soc Lond
ton, DC: Smithsonian Institute Press. B Biol Sci 264:1303–1307.164 / Sherwood et al. Krebs JR. 1990. Food-storing birds: adaptive Rorden C, Brett M. 2000. Stereotaxic specialization in brain and behaviour? display of brain lesions. Behav Neurol Philos Trans R Soc Lond B Biol Sci 12:191–200. 329:153–160. Ruvolo M, Pan D, Zehr S, Goldberg T, Disotell Kretschmann HJ, Tafesse U, Herrmann A. TR, von Dornum M. 1994. Gene trees and 1982. Different volume changes of cerebral hominoid phylogeny. Proc Natl Acad Sci cortex and white matter during histological USA 91:8900–8904. preparation. Microsc Acta 86:13–24. Sawaguchi T. 1992. The size of the neocortex Leigh SR, Relethford JH, Park PB, Konigs- in relation to ecology and social structure in berg LW. 2003. Morphological differen- monkeys and apes. Folia Primatol 58: tiation of Gorilla subspecies. In: Taylor 131–145. AB, Goldsmith ML, editors. Gorilla Semendeferi K, Damasio H. 2000. The brain biology: a multidisciplinary perspective. and its main anatomical subdivisions in Cambridge: Cambridge University Press. living hominoids using magnetic resonance p 104–131. imaging. J Hum Evol 38:317–332. Lemieux L, Liu RS, Duncan JS. 2000. Hippo- Sherwood CC, Broadfield DC, Holloway RL, campal and cerebellar volumetry in serially Gannon PJ, Hof PR. 2003. Variability of acquired MRI volume scans. Magn Reson Broca’s area homologue in African great Imaging 18:1027–1033. apes: implications for language evolution. MacLeod CE, Zilles K, Schleicher A, Rilling Anat Rec 271A:276–285. JK, Gibson KR. 2003. Expansion of the Shettleworth SJ. 2003. Memory and hippo- neocerebellum in Hominoidea. J Hum Evol campal specialization in food-storing 44:401–429. birds: challenges for research on compara- Maguire EA, Gadian DG, Johnsrude IS, Good tive cognition. Brain Behav Evol 62: CD, Ashburner J, Frackowiak RS, Frith 108–116. CD. 2000. Navigation-related structural Stephan H, Bauchot R, Andy OJ. 1970. Data change in the hippocampi of taxi drivers. on the size of the brain and of various parts Proc Natl Acad Sci USA 97:4398–4403. in insectivores and primates. In: Noback Malenky RK, Kuroda S, Vineberg EO, Wrang- CR, Montagna W, editors. The primate ham RW. 1994. The significance of terres- brain. New York: Appleton-Century-Crofts. trial herbaceous foods for bonobos, p 289–297. chimpanzees, and gorillas. In: Wrangham Stephan H, Frahm HD, Baron G. 1981. New RW, McGrew WC, de Waal FB, Heltne PG, and revised data on volumes of brain editors. Chimpanzee cultures. Cambridge, structures in insectivores and primates. MA: Harvard University Press. p 59–75. Folia Primatol 35:1–29. Matochik JA, Chefer SI, Lane MA, Woolf RI, Talairach J, Tournoux P. 1988. Co-planar Morris ED, Ingram DK, Roth GS, London stereotaxic atlas of the human brain. 3- ED. 2000. Age-related decline in striatal dimensional proportional system: an ap- volume in monkeys as measured by mag- proach to cerebral imaging. New York: netic resonance imaging. Neurobiol Aging Thieme. 21:591–598. Tobias PV. 1971. The brain in hominid Povinelli DJ, Cant JGH. 1995. Orangutan evolution. New York: Columbia University clambering and the evolutionary origins of Press. self-conception. Q Rev Biol 70:393–421. Van Der Werf YD, Tisserand DJ, Visser PJ, Reader SM, Laland KN. 2002. Social intelli- Hofman PA, Vuurman E, Uylings HB, gence, innovation, and enhanced brain size Jolles J. 2001. Thalamic volume predicts in primates. Proc Natl Acad Sci USA performance on tests of cognitive speed 99:4436–4441. and decreases in healthy aging. A magnetic Rilling JK, Insel TR. 1998. Evolution of the resonance imaging-based volumetric cerebellum in primates: differences in re- analysis. Brain Res Cogn Brain Res 11: lative volume among monkeys, apes and 377–385. humans. Brain Behav Evol 52:308–314. Zilles K, Rehkämper G. 1988. The brain, Rilling JK, Insel TR. 1999. The primate with special reference to the telencephalon. neocortex in comparative perspective using In: Schwartz JH, editor. Orang-utan magnetic resonance imaging. J Hum Evol biology. New York: Oxford University 37:191–223. Press. p 157–176.
You can also read