MRI-based brain volumetrics: emergence of a developmental brain science
←
→
Page content transcription
If your browser does not render page correctly, please read the page content below
Brain & Development 21 (1999) 289–295
Review article
MRI-based brain volumetrics: emergence of a developmental brain science
Verne Strudwick Caviness Jr. a ,*, Nicholas Theodore Lange b, Nikos Makris a,
Martha Reed Herbert a, David Nelson Kennedy a , c
a
Department of Neurology, Massachusetts General Hospital, Harvard Medical School, Boston, MA, 02114, USA
b
Department of Psychiatry, McLean Hospital, Harvard Medical School, Boston, MA, 02114, USA
c
Department of Radiology, Massachusetts General Hospital, Harvard Medical School, Boston, MA, 02114, USA
Received 15 December 1998; received in revised form 1 February 1999; accepted 2 February 1999
Abstract
MRI-based brain volumetrics is an established methodology of great versatility and reliability with a broad range of potential applications
in medicine and basic human brain science. We consider here, more theoretical implications of brain tissue volumes. Specifically, we
suggest that volume is an evolutionarily and developmentally regulated fundamental property of tissue, in this instance the brain and its
component structures. Within this framework (1), regularities in relative variation of volumes with respect to mean volume of a structure
are viewed as systematic manifestations of the rules of histogenetic process (2), regularities in the relative strength of correlation of
volumes of structures are suggested to reflect constraints which serve systematically the requirements of neural systems operation. These
hypotheses, if supported by extensive observation, may guide the design of applications of MRI based volumetric analysis of the human
brain. 1999 Elsevier Science B.V. All rights reserved.
Keywords: Volumetrics; MRI; Cerebral cortex; Human brain
1. Introduction obscure nature, such as autism [6–11], OCD [12] and schi-
zophrenia [13–20]. As yet another application of this meth-
The newly emerging science of MRI-based brain volu- odology, MRI-based volumetric analysis has provided a
metrics is concerned with the organization and analysis of criterion by which to recognize the presence of degenerative
qualitative and quantitative relationships between volumes diseases and by which to characterize their rates of progres-
and shapes of the structural components of the human brain. sion [21–25]. The thesis to be presented here, is that the
MRI-based brain volumetrics is already established as a conceptual framework of brain volumetrics, though rooted
methodology of great versatility and reliability with a bur- in the methodology of volumetric measurement, is not lim-
geoning range of potential application in the medical biol- ited to volumetric measurement as a sole analytic endpoint.
ogy of the human brain. As a methodology it has already The thesis, greatly larger in scope and implication, is that
served diverse study objectives. For example, the course of volumetrics may lay claim to status as a coherent domain of
volumetric change for the entire brain and sets of brain brain science in its own right. Whereas, the focus here is
structures has been charted for much of the human life upon volumetric analysis, we recognize that entirely parallel
cycle within the framework of MRI-based analysis [1–5]. arguments apply equally to other domains of morphometry
Within the realm of disorders of the developing brain MRI- and in particular to the analysis of shape [26–28].
based volumetric analysis has contributed to the search for
structural correlates of certain developmental disorders of
2. MRI-based brain volumetrics as a methodology
* Corresponding author. Tel.: +1-617-726-1813; fax: +1-617-726-2353;
e-mail: caviness@helix.mgh.harvard.edu The perspective regarding volumetric analysis of the
0387-7604/99/$ - see front matter 1999 Elsevier Science B.V. All rights reserved.
PII: S03 87-7604(99)000 22-4290 V.S. Caviness Jr. et al. / Brain & Development 21 (1999) 289–295 human brain to be explored here has its basis in the power dures which are guided by investigator interpretation of and flexibility of MRI-based morphometry as a methodol- anatomic boundaries, by contrast, requires experienced jud- ogy. These qualities stem both from the imaging and the gement for location of anatomic boundaries and also have image analysis sides of its application [29,30]. An overview voracious appetites for investigator time. These costs of the of these ‘sides’ of imaging, even briefly presented, is a semiautomated approach are offset by the advantage that favorable place for this theoretical ‘walkthrough’ to begin. they allow the investigator to compensate for the limitations A set of brains may be imaged at a single developmental to image quality inherent in the real world experience of stage in life or the same brain may be imaged repeatedly imaging. over time in life so that its volumetric analysis is not com- It is our view that for the present, the performance of the plicated by the unknowable modulations of volume inevi- two methods separate in terms of their validity in so far as table with the death process, delay between death and tissue this can be judged ‘by eye’ by the skilled human brain fixation and tissue fixation and processing. Where certain anatomist. By this we mean that the fully automated meth- exclusions are observed, e.g. cardiac pacemakers, and ods are still approximate at best, when compared with an where sedation is not required, the method is without risk experienced anatomic eye, as a means of specifying the to the subject. With respect to the more purely anatomic borders between gray and white matter. For the present, it perspective, magnetic resonance imaging presents the is our view that each of the two approaches has its appro- brain as a gray scale signal intensity range which differenti- priate uses and that these uses are more or less complemen- ates, approximately, the gray and white matter and CSF tary. The automated approach would be preferred where compartments of the brain. Volumetric analyses are allow- rough approximations of volume are sufficient to the pur- able on such data sets in that they are algebraic transforma- poses of analysis and where the costs inherent in the semi- tions of the imaged brain. Point resolution expected with automated method are insupportable. Examples would be optimum 3D image data sets, accomplished by well tuned applications in real time in support of rapid flow clinical standard 1.5 Tesla imaging systems, may approach 1–2 analysis or applications in support of functional imaging or mm. Newer generation higher field strength instruments spectroscopy. In these circumstances volumetric determina- may substantially improve this level of resolution. tions based on full automation which are approximate may Techniques of MRI analysis, concerned with the size of be sufficient to match the morphometric precision of the structures, have ranged from manual traces for estimates of methods with which the volumetric determinations are to diameters or sectional areas of structures as presented in be correlated. On the other hand, we see the semiautomated single planes [31–34] to the application of advanced com- approaches as appropriately reserved to investigative objec- putational algorithms which estimate volumes as integrated tives which require maximum specificity and sensitivity of across full 3D image data sets [1,2,4,5,35]. As a general rule volumetric analysis. Future improvements in the specificity the most advanced computational algorithms, those perti- of fully automated routines may be expected to increase the nent to the present perspective, share certain preprocessing range of their applications and, one would hope, eventuate routines and in particular positional normalization to a com- in automated routines whose performance in every respect mon stereotactic coordinate system and, electively, correc- equals that of the semiautomated routines. As this objective tion for signal intensity drifts. These operations are is approached, the fully automated will come to supplant the antecedent to the primary analytic operation which is seg- semiautomated methods. mentation of the image into its gray matter, white matter and CSF compartments. It is with the approach to the segmenta- tion operation that there is a fundamental methodological 3. Brain volumetrics as a science divergence into two broad camps: one where gray-white segmentation is executed essentially automatically [36] The theoretical foundation underlying the proposition and the other where it is largely but incompletely automated that brain volumetrics is usefully pursued as a science in [37]. With the latter approach, the non-automated opera- its own right may be relatively simply formulated. This tions are guided by knowledge based user interaction. thesis, for which there is both theoretical and observational The fully automated approach is recommended by its support, is that volume is an evolutionarily and develop- great efficiency and the rough and ready practicality that mentally regulated fundamental property of tissue, in this it presupposes no knowledge of brain anatomy. Thus, instance the brain and its component structures [38–47]. such methodology delivers volumetric computations based The volume of a neural structure will reflect directly the upon its own anatomic system and does so essentially in real size, shape, pattern of arrangement and densities of its time. The reliable performance of such procedures requires diverse cellular components. The volume may be viewed exceptional image quality and compensates poorly for as optimized to a selected functional state within the frame- blemishes in image execution associated with patient move- work of a hierarchy of volume determining constraints. That ment or the suboptimum performance of imaging systems, is, the information processing capacity of the component complexities which tend to haunt the real world of imaging will relate in some regular way to its volume; the optimum ill patients in a clinical setting. Partially automated proce- information processing capacity of the component will
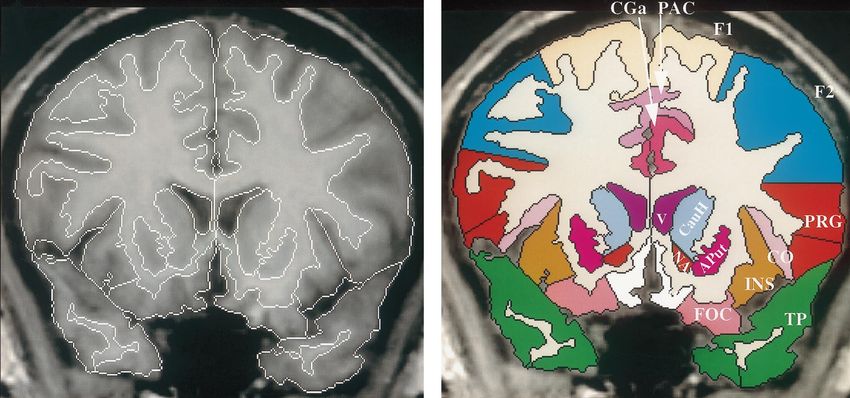
V.S. Caviness Jr. et al. / Brain & Development 21 (1999) 289–295                                          291

relate in some regular way to its volume in relation to that of                be expected with extension of this notion to the brain which
other brain components with which it is linked in distributed                  has developed abnormally. We will return later to a discus-
neural systems. From the evolutionary perspective, the brain                   sion of formidable theoretical and epistemological hurdles
or brain component will have a characteristic volume which                     that presently frustrate the interpretation of volumetric ana-
reflects its optimization within the framework of constraints                  lyses of the human brain which has not developed normally.
imposed by body and organ plan [48]. From the ontogenetic
perspective the brain or brain component will have an
approximately uniform volume among individuals of spe-                         4. Brain volumes from brain images
cies, reflecting the constraints of cell and molecular biolo-
gical processes operating ontogenetically in that species. In                     A reasoned approach to volumetric analysis of the human
the course of normal brain development, these cell biologi-                    brain based upon MR images must begin with the brain as
cal processes are dominated powerfully by cell internal con-                   presented in these images [29]. The gray scale signal inten-
trols but in detail are also modulated significantly by cell                   sity range of these images distinguishes approximately the
external mechanisms.                                                           cortical and nuclear gray matter compartments from the
   The foregoing considerations lead to the central theses                     intervening white matter compartments. In their general
developed here which are that volumetric regularities are                      size and shape and in their positions relative to each other,
systematic manifestations of the rules of histogenetic pro-                    these recognizable subdivisions are highly regular in their
cess, and that volumetric regularities serve systematically                    expression among normal brains. Nothing explicit is
the requirements of neural systems operation. These general                    revealed by this view of brain structure of either underlying
propositions accepted, the task of volumetric analysis                         cytological patterns or patterns of deployment of neural
becomes the identification of those volumetric parameters                      systems. However, other investigations including diffusion
which are sensitive to the regularities of normal histogenetic                 weighted imaging, dissection of the human brain and neural
sequence and those essential to normal systems operation.                      systems and cytologic analyses in primates provide a low
Within the framework of volumetric analysis this is a non-                     resolution linkage between the visible gray and white matter
trivial challenge, made unwieldy by the potentially infinite                   anatomy of the human brain and its invisible cytologic and
number of volumetric measures that might be made. We                           systems organization anatomy [49,50].
present here a system of analysis formulated to this end as                       The system of analysis which we introduce here is,
a reasoned search for regularities in the volumetrics of the                   because of these considerations, keyed exclusively to ana-
normal brain. We see this as an exploratory exercise, one                      tomic landmarks constant to the normal brain and readily
that is encouraged by apparent success in certain but not all                  visible in MRImages (Fig. 1). The system begins with brain
of its directions in volumetric studies of the normal brain.                   segmented according to its general forebrain, brain stem and
We acknowledge at the outset that greater difficulties may                     cerebellar regions [51]. It then decomposes the forebrain

Fig. 1. The cerebrum of the human brain as viewed in the coronal plane at the level of the head of the caudate in magnetic resonance image. (A) Gray and
white matter structures, distinguished visually in terms of signal intensity in T1 weighted images have been partitioned (‘segmented’) by contour lines
constructed by semiautomated algorithm. (B) The gray and white matter structures have been parcellated by investigator interactive semiautomated
algorithm. Labeled neocortical parcellation units are F1 and F2 (first and second frontal gyri), CGa (anterior cingulate gyrus), PAC (paracingulate
gyrus), PRG (precentral gyrus), TP (temporal pole), INS (insula), CO (central opercular cortex) and FOC (frontoorbital cortex). Other labels are APut
(anterior putamen), CauH (head of caudate) and NA (nucleus accumbens) and V (ventricle),
292                                       V.S. Caviness Jr. et al. / Brain & Development 21 (1999) 289–295

into its principal cortical and nuclear structures. For greater
specificity and precision of volumetric analysis these struc-
tures are, in turn, further decomposed into a very much
larger set of parcels, or parcellation units [50,52–54]. The
parcellation units generally respect the canonical partitions
of cortex by gyri, the central gray masses by nuclei and the
central white matter by its general fascicular organization.
The system is relatively fine grained such that the mean
volume of parcellation units is only a few percent of total
volume of respective compartments. Practical or even ana-
lytic considerations could dictate a coalescence of sets of
these anatomic units or indeed a further atomization. Alter-
nate systematic treatments of forebrain anatomy or exten-
sions of this general approach to brain stem and cerebellum
are readily imaginable.

5. From measure of volumes to measures of regularity

   The analysis yields measures of volume by region, by                      Fig. 2. Relative variation of structure volumes. Relative variation of
parcellation units or by elected combinations of these sub-                  volumes of the total neocortex, of the neocortex of the cerebral lobes
divisions in a single or a series of normal brains. How are                  (frontal, temporal, parietal, occipital) and of individual gyri are expressed
                                                                             as coefficients of variation (standard deviations as percentage of means).
these raw data to be used? More specifically, how will the
                                                                             The position of the mean is indicated by a short horizontal line.
analysis serve a search for volumetric regularities which
analytically are specific and sensitive to more fundamental                  characteristic of this system are minimal variability of the
properties of brain structure? The approach we have taken is                 volume of the overall neocortex but large variability of
simple and straightforward in concept and execution. We                      volumes of the individual neocortical gyri. From this we
derive from volumetric analysis of a set of brains:                          infer: (1) there are powerful ontogenetic constraints which
                                                                             are species characteristic acting to determine the absolute
1. The mean volumes of all structures across the hierarchy
                                                                             volume of the human cortex. (2) Ontogenetic constraints are
   from entire brain, brain regions, segmented compart-
                                                                             greatly relaxed with respect to setting the volumes of neo-
   ments and structures, and parcellation units.
                                                                             cortex of individual gyri. It turns out that in a series of brains
2. Measures of variance of structure volumes about the
                                                                             of 20 normal young adults the dominant source of variance
   means.
                                                                             arises from individual subject × individual gyrus interac-
3. Measures of volume covariance of all distinct pairs of
                                                                             tion. This finding is consistent with other observations
   structures. The measures of mean, variance and covar-
                                                                             which illustrate the ‘volume growing’ effect of individual
   iance are the display of regularity in volumetric mea-
                                                                             experience upon individual gyral volumes. For example the
   sures upon which the theoretical underpinnings of this
                                                                             precentral gyrus (specific for motor activity) of keyboard
   discussion rest1. These are simply as follows.
                                                                             artists is enlarged in comparison to that of subjects where
   (1) Variability of volume measures about the mean of                      the fingers are not ‘overused’ [56]. The degree of enlarge-
these measures is inversely related to the strength of devel-                ment is systematically greater with earlier application to
opmental constraints acting to determine the respective                      keyboard training across the age interval 4–6 years.
structure volume.                                                               (2) Volumetric covariance of a pair of brain structures is
   By illustration, the total volumes of neocortex about a                   inversely related to some measure of ‘synaptic distance’ or
mean estimate for a set of normal young adult brains,                        ‘synaptic strength’.
equally represented by males and females, is minimally                          By illustration, Pearson coefficients for the correlations
variant. As a measure of this, the coefficient of variation                  between volumes of neocortex of precentral gyrus and puta-
(CV, being standard deviation expressed as a percentage of                   men are substantially stronger than those between putamen
the mean) is only 8% (Fig. 2) [55]. By contrast the average                  and anterior lateral thalamus or anterior lateral thalamus and
coefficient of variation for mean volumes of neocortex for                   precentral gyrus (Fig. 3). Precentral gyrus and putamen are
individual cerebral gyri is 25% with a substantial range of                  strongly linked at a distance of a single synapse. Linkage
CV for individual gyri. That is, the volumetric regularities                 between putamen and anterior lateral thalamus is multisy-
  1                                                                          naptic while that between anterior lateral thalamus and pre-
    We do not, however, limit our theory to these statistical summaries,
sufficient if the volumetric data are Gaussian distributed. Our overall
                                                                             central gyrus, though a distance of only a single synapse, is
approach does not preclude examination of higher-order moments and           highly divergent. As another illustration drawn from the
nonlinear relationships among morphometric variables.                        observations of other investigators, the cross sectional
V.S. Caviness Jr. et al. / Brain & Development 21 (1999) 289–295 293
area of the optic tract, the volumes of lateral geniculate
nucleus and striate cortex, sequential components in the
primary visual relay from retina to cerebral hemisphere,
have been estimated to be approximately 0.8 in a series of
normal human brains studied as postmortem specimens
[38]. In the cited analysis, the covariance in size of these
linked structures was found not to be scaled to variation in
brain size.
We postulate further that the strength of covariance for a
given level of affiliation between structures (as whether
‘separated by one, two or more synapses’) will be charac-
teristic of the system. For the present we are aware of no
measures comparable to those for the visual relays [38] by
which to test this hypothesis.
6. Complexities Inherent in Application to
Developmental Disorders
We foresee a critical role for volumetric study as an
approach to the biological basis of a set of developmental
disorders of obscure origin and nature. We list in particular
schizophrenia, autism and OCD. The conceptual and opera-
tional framework inherent in focal lesion, neurological, and
behavioral deficit correlation, which has yielded much in
Fig. 3. Schematic representation of interrelationship between ‘synaptic
other domains of cognitive neuroscience has illuminated distance and strength of connection’ between paired structures and the
only weakly our understanding of these highly prevalent strength of correlation = Pearson product moment coefficients) in the
and devastating conditions [57,58]. In schizophrenia and variation in their volumes. This interrelationship is illustrated for neocor-
autism in particular, a preeminent disability in the domain tex of precentral gyrus (PRG) and anterior putamen (APut), anterior puta-
men and anterior lateral thalamus (La) and anterior lateral thalamus and
of socialization has encouraged the view that they might be
precentral gyrus (1 synapse). The strongest correlation is between precen-
manifestations of a focally acting (or ‘modular’) process, tral gyrus and anterior putamen for which the synaptic distance is 1
differentially affecting the limbic lobe [7,13,18,59–64]. synapse and unidirectional and the strength of interconnectivity is
However, focal lesions in the limbic lobe have been neither known to be strong. The anterior putamen and anterior lateral thalamus,
a necessary nor sufficient structural correlate of these con- separated by multiple synapses, and anterior lateral thalamus and precen-
tral gyrus, linked weakly by reciprocal connections, are weakly if at all
ditions. Greatly perplexing has been the general finding with
correlated.
high functioning autistic subjects but also with subjects with
OCD, that the cerebrum is pervasively larger than normal with respect to analysis in dozens of cases of schizophrenia
with no evident consistent pattern of modular lesions or and autism which meet diagnostic criterion by state of
regions which are less than normal in size [9,10,12,59,65– art inquiry [20,68,69]. An as yet preliminary view of the
67]. Larger brain implies either more cells or larger cells or findings is that there are some cerebral gyri which, at the
both and one might postulate specific mechanisms of histo- 0.05 confidence level, are larger and some which are smaller
genetic disregulation which could yield such an outcome. than their normal counterparts. However, nothing which
However, there is no theoretical framework, to our knowl- approaches a robust regional (or ‘modular’) pattern of volu-
edge, from which to anticipate the information processing metric abnormality has as yet been recognized.
consequences where the volumes of regions of the brain are To be determined as a next analytic step is whether the
greater than normal. anatomic units defined in these analyses observe the codes
Given that brains associated with each of these conditions of regularity which have emerged from analysis of the nor-
may be of normal size or greater than normal size, and that mal brain. The prediction is that they will not. Specifically
for the most characteristic case, there is no evident region- the expectation is that variance will be greater about mini-
ally evident ‘brain lesion’, the conundrum posed by the mally variant measures such as total volume of cortex in
three disorders is greatly appropriate to the volumetric ana- normal brain development. Similarly the expectation is that
lysis approach as framed here. The question to be asked in the patterns of covariance may be entirely anomalous. Con-
the first instance is ‘How is volume distributed?’ That is, are ceivably there may be no regular patterns or there may be
there structures or regions which systematically with diag- anomalous patterns of covariance respecting strength of
nosis are deviant in their mean sizes? In fact this question affiliation within systems. The sensitivity, and perhaps the
has already been posed and provisionally can be answered specificity, of these analytic criteria to these diagnostic con-294 V.S. Caviness Jr. et al. / Brain & Development 21 (1999) 289–295
ditions may in the end be the most important test of the [15] Casanova MF, Daniel DG, Goldberg TE, Suddath RL, Weinberger
utility of volumetric analysis as a program of study in DR. Shape analysis of the middle cranial fossa of schizophrenic
patients. A computerized tomographic study. Schizophrenia Res
human brain science. 1989;2:333–338.
[16] Corey BJ, Jernigan T, Archibald S, Harris MJ, Jeste DV. Quantitative
magnetic resonance imaging of the brain in late-life schizophrenia.
Acknowledgements Am J Psychiatry 1995;152:447–449.
[17] Grove WM, Lebow BS, Medus C. Head size in relation to schizo-
Supported in part by NIH grants NS27950, DA09467 and phrenia and schizotypy. Schizophrenia Bull 1991;17:157–161.
NS37483; NIH grants NS34189 and MH57180 as part of the [18] Suddath RL, Casanova MF, Goldberg TE, Daniel DG, Kelsoe JRJ,
Weinberger DR. Temporal lobe pathology in schizophrenia: a quan-
Human Brain Project; grants from the Fairway Trust, the titative magnetic resonance imaging study. Am J Psychiatry
Giovanni Armenise-Harvard Foundation for Advanced 1989;146:464–472.
Scientific Research and Cure Autism Now Foundation. [19] Suddath R, Christison G, Torrey E, Casanova M, Weinberger D.
This manuscript was presented in part at a satellite meeting Anatomical abnormalities in the brains of monozygotic twins discor-
to the 8th International Child Neurology Congress, ‘Diag- dant for schizophrenia. N Engl J Med 1990;322:789–794.
[20] Seidman L, Faraone S, Goldstein J, Goodman J, Kremen W, Matsuda
nostic Procedures and Techniques in Child Neurology’. G, et al. Reduced subcortical brain volumes in nonpsychotic siblings
of schizophrenic patients: a pilot magnetic resonance imaging study.
Am J Med Genet 1997;74:507–514.
References [21] Jernigan TL, Salmon DP, Butters N, Hesselink JR. Cerebral structure
on MRI, Part II: Specific changes in Alzheimer’s and Huntington’s
[1] Huppi P, Warfield S, Kikinis R, Barnes P, Zientara G, Tsuji M, et al. diseases. Biol Psychiatry 1991;29:68–81.
Quantitative magnetic resonance imaging of brain development [22] Jernigan TL, Archibald SL, Berhow MT, Sowell ER, Foster DS,
in premature and mature newborns. Ann Neurol 1998;43:224– Hesselink JR. Cerebral structure on MRI, Part I: Localization of
235. age-related changes. Biol Psychiatry 1991;29:55–67.
[2] Giedd J, Snell J, Lange N, Rajapakse J, Casey B, Kozuch P, et al. [23] Harris GJ, Pearlson GD, Peyser CE, Aylward EH, Roberts J, Barta
Quantitative magnetic resonance imaging of human brain develop- PE, et al. Putamen volume reduction on magnetic resonance imaging
ment: ages: 4–18. Cereb Cortex 1996;6:551–560. exceeds caudate changes in mild Huntington’s disease. Ann Neurol
[3] Lange N, Giedd J, Castellanos F, Vaituzis A, Papoport J. Variability 1992;31:69–75.
of human brain structure size; ages 4–20. Psych Res Neuroim [24] Aylward EH, Brandt T, Codori A, Mangus R, Barta P, Harris G.
1997;74:1–12. Reduced basal ganglia volume associated with the gene for Hunting-
[4] Caviness VS Jr, Kennedy DN, Richelme C, Rademacher R, Filipek ton’s disease in asymptomatic at-risk persons. Neurology
P. The human brain age 7–11 years: a volumetric analysis based 1994;44:823–828.
upon magnetic resonance images. Cereb Cortex 1996;6:726–736. [25] Mori E, Yoneda Y, Yamashita H, Hirono N, Ikeda M, Yamadori A.
[5] Filipek PA, Richelme C, Kennedy DN, Caviness VS Jr. The young Medial temporal structures relate to memory impairment in Alzhei-
adult human brain: an MRI-based morphometric analysis. Cereb mer’s disease: an MRI volumetric study. J Neurol Neurosurg
Cortex 1994;4:344–360. Psychiatry 1997;63:214–221.
[6] Courchesne E, Hesselink J, Jernigan T, Yeung-Courchesne R. [26] Kennedy DN, Filipek PA, Caviness Jr VS. Fourier shape analysis of
Abnormal neuroanatomy in a nonretarded person with autism. anatomic structures. In: Byrnes J, Byrnes J, editors. Recent advances
Arch Neurol 1987;44:335–341. in Fourier shape analysis and its applications. Dordrecht, Nether-
[7] Courchesne E, Yeung-Courchesne R, Press GA, Hesselink J, lands: Kluwer Academic Publishers, 1990:17–28.
Jernigan T. Hypoplasia of cerebellar vermal lobules VI and VII in [27] Miller M, Christensen G, Amit Y, Grenander U. Mathematical text-
autism. N Engl J Med 1988;318:1349–1354. book of deformable neuroanatomies. Proc Natl Acad Sci USA
[8] Courchesne E, Saitoh O, Yeung-Courchesne R, et al. Abnormality of 1993;90:11944–11948.
cerebellar vermian lobules VI and VII in patients with infantile aut- [28] Joshi S, Miller M, Grenander U. On the geometry of brain sub-
ism: identification of hypoplastic and hyperplastic subgroups with manifolds. Int J Pat Recog Art Intel 1997;11:1317–1344.
MR imaging. Am J Roentgenol 1994;162:223–230. [29] Caviness VS Jr, Filipek PA, Kennedy DN. Magnetic resonance tech-
[9] Filipek PA. Quantitative MRI in autism: the cerebellar vermis. Curr nology in human brain science: blueprint for a program based upon
Opin Neurol 1995;2:134–138. morphometry (review). Brain Dev 1989;11:1–13.
[10] Piven J, Arndt S, Bailey J, Havercamp S, Andreasen N, Palmer P. An [30] Caviness VS Jr, Kennedy DN, Bates J, Makris N. Advanced applica-
MRI study of brain size in autism. Am J Psychiatry 1995;152:1145– tion of magnetic resonance imaging in human brain science. Brain
1149. Dev 1995;17:399–408.
[11] Piven J, Saliba K, Bailey J, Arndt S. An MRI study of brain size in [31] Schaefer GB, Thompson JNJ, Bodensteiner JB, Hamza M, Tucker
autism: the cerebellum revisited. Neurology 1997;49:546–551. RR, Marks W, et al. Quantitative morphometric analysis of brain
[12] Jenike MA, Breiter HC, Baer L, Kennedy DN, Savage CR, Olivares growth using magnetic resonance imaging. J Child Neurol
MJ, et al. Cerebral structural abnormalities in obsessive-compulsive 1990;5:127–130.
disorder detected: a quantitative morphometric magnetic resonance [32] O’Kusky J, Strauss E, Kosaka B, Wada J, Li D, Druhan M, et al. The
imaging study. Arch Gen Psychiatry 1996;53:625–632. corpus callosum is larger with right-hemisphere cerebral speech
[13] Jernigan TL, Zisook S, Heaton RK, Moranville JT, Hesselink JR, dominance. Ann Neurol 1988;24:379–383.
Braff DL. Magnetic resonance imaging abnormalities in lenticular [33] Kertesz A, Polk M, Howell J, Black SE. Cerebral dominance, sex,
nuclei and cerebral cortex in schizophrenia. Arch Gen Psychiatry and callosal size in MRI. Neurology 1987;37:1385–1388.
1991;48:881–890. [34] Willerman L, Schultz R, Rutledge JN, Bigler ED. Hemisphere size
[14] Andreasen N, Nasrallah HA, Dunn V, Olson SC, Grove WM, asymmetry predicts relative and verbal and nonverbal intelligence
Ehrhardt JC, et al. Structural abnormalities in the frontal system in differently in the sexes: an MRI study of structure-function relations.
schizophrenia. A magnetic resonance imaging study. Arch Gen Intelligence 1992;16:315–328.
Psychiatry 1986;43:136–144. [35] Toft P, Leth H, Ring P, Peitersen B, Lou H, Henriksen O. VolumetricV.S. Caviness Jr. et al. / Brain & Development 21 (1999) 289–295 295
analysis of the normal infant brain and in intrauterine growth [53] Caviness VS Jr, Makris N, Meyer J, Kennedy D. MRI-based parcel-
retardation. Early Hum Dev 1995;443:15–29. lation of human neocortex: an anatomically specified method with
[36] Collins D, Evans A. ANIMAL: validation and applications of non- estimate of reliability. J Cog Neurosci 1996;8:566–588.
linear registration-based segmentation. Int J Pat Recog Art Intel [54] Meyer J, Makris N, Bates J, Caviness V, Kennedy D. Parcellation of
1997;11:1271–1294. the human cerebral white matter: an MRI-based computational sys-
[37] Worth A, Makris N, Caviness VS Jr, Kennedy D. Neuroanatomical tem. NeuroImage 1999;9:1–17.
segmentation in MRI: technological objectives. Int J Pat Recog Art [55] Kennedy D, Lange N, Makris N, Bates J, Caviness VS Jr. Gyri of the
Intel 1997;11:1161–1187. human neocortex: an MRI-based analysis of volumes and variance.
[38] Andrews T, Halpern S, Purves D. Correlated size variations in human Cereb Cortex 1998;8:372–385.
visual cortex, lateral geniculate nucleus, and optic tract. J Neurosci [56] Amunts K, Schlaug G, Jaencke L, Steinmetz H, Schleicher A,
1997;17:2859–2868. Dabringhaus A. Motor cortex and hand motor skills: structural com-
[39] Armstrong E. Relative brain size and metabolism in mammals. pliance in the human brain. Hum Brain Map 1997;5:206–215.
Science 1983;220:1302–1304. [57] Fischer K, Ayoub C, Singh I, Noam G, Maraganore A, Raya P.
[40] Cheverud JM, Falk D, Vannier M, Konigsberg L, Helmkamp RC, Psychopathology as adaptive development along distinctive
Hildebolt C. Heritability of brain size and surface features in rhesus pathways. Dev Psychopathol 1997;9:749–779.
macaques (Macaca mulatta). J Hered 1990;81:51–57. [58] Oliver A, Johnson M, Karmiloff Smith A, Pennington B. Deviations
[41] Jerison HJ. On the meaning of brain size. Science 1974;184:677– in the emergence of representations: a neurocontructivist framework
679. for analysing developmental disorders. Dev Sci 1999, in press.
[42] Jerison H. Brain size. In: Adelman G, editor. Encyclopedia of neu- [59] Bauman ML, Kemper TL. Neuroanatomic observations of the brain
roscience. Boston: Birkhauser, 1987:168–170. in autism. In: Bauman ML, Kemper TL, editors. The neurobiology of
[43] Prothero JW, Sundsten JW. Folding of the cerebral cortex in mam- autism. Baltimore: The Johns Hopkins University Press, 1994:119–
mals. A scaling model. Brain Behav Evol 1984;24:152–167. 145.
[44] Purves D, While L, Zheng D, Andrews T, Riddle D. Brain size, [60] Bachevalier J. Medial temporal lobe structures and autism: a review
behavior, and the allocation of neural space. In: Magnussen D, editor. of clinical and experimental findings. Neuropsychologia
Individual development over the lifespan: biological and psychoso- 1994;32:627–648.
cial Perspectives. Cambridge: Cambridge University Press, 1996: [61] Hauser SL, DeLong GR, Rosman NP. Pneumographic findings in the
162–178. infantile autism syndrome. Brain 1975;98:667–688.
[45] Ringo JL. Neuronal Interconnection as a function of brain size. Brain [62] Williams RS, Hauser SL, Purpura DP, DeLong GR, Swisher CN.
Behav Evol 1991;38:1–6. Autism and mental retardation. Neuropathologic studies performed
[46] Cherniak C. The bounded brain: toward quantitative neuroanatomy. J in four retarded persons with autistic behavior. Arch Neurol
Cog Neurosci 1990;2:58–68. 1980;37:749–753.
[47] Cherniak C. Neural component placement. Trends Neurosci [63] Rapin I, Katzman R. Neurobiology of autism. Ann Neurol
1995;18:522–527. 1998;43:7–14.
[48] Gerhart J, Kirschner M. Cell, embryos, and evolution. London: [64] Courchesne E, Press GA, Yeung CR. Parietal lobe abnormalities
Blackwell Science, 1997. detected with MR in patients with infantile autism. Am J
[49] Makris N, Worth HJ, Sorensen AG, Papadimitriou GM, Wu O, Reese Roentgenol 1993;160:387–393.
TG, et al. Morphometry of in vivo human white matter association [65] Woodhouse W, Bailey A, Rutter M, Bolton P, Baird G, Le Couteur
pathways with diffusion-weighted magnetic resonance imaging. Ann A. Head circumference in autism and other pervasive developmental
Neurol 1997;42:951–962. disorders. J Child Psychol Psychiatry 1996;37:665–671.
[50] Makris N, Meyer J, Bates J, Caviness V, Kennedy D. MRI-based [66] Lainhart J, Piven J, Wzorek M, et al. Macrocephaly in children and
topographic parcellation of cerebral central white matter and nuclei adults with autism. J Am Acad Child Adol Psychiatry 1997;36:282–
with systematics of cerebral connectivity. NeuroImage 1999:9:18– 290.
95. [67] Breiter H, Filipek P, Kennedy D, et al. Retrocallosal white matter
[51] Kennedy DN, Makris N, Caviness Jr VS. Structural morphometry in abnormalities in patients with obsessive-compulsive disorder. Arch
the developing brain. In: Thatcher RW, Lyon GR, Rumsey J, Kras- Gen Psychiatry 1994;51:663–664.
negor N, editors. Developmental neuroimaging: mapping the devel- [68] Piven J, Arndt S, Bailey J, Andreasen N. Regional brain enlargement
opment of brain and behavior. New York: Academic Press, 1996:3– in autism: a magnetic resonance imaging study. J Am Acad Child
14. Ado Psychiat 1996;35:530–536.
[52] Rademacher J, Galaburda AM, Kennedy DN, Filipek PA, Caviness [69] Filipek PA, Richelme C, Kennedy DN, Rademacher J, Pitcher D,
VS Jr. Human cerebral cortex: localization, parcellation, and mor- Zeidel S, et al. Morphometric analysis of the brain in developmental
phometry with magnetic resonance imaging. J Cog Neurosci disorders and autism. Ann Neurol 1992;32:475.
1992;4:352–374.You can also read


