2020 BRANTFORD TRANSPORTATION MASTER PLAN UPDATE - 2051 ADDENDUM - FINAL
←
→
Page content transcription
If your browser does not render page correctly, please read the page content below
CITY OF BRANTFORD

 2020 BRANTFORD
 TRANSPORTATION
MASTER PLAN UPDATE
 - 2051 ADDENDUM
        September 2021

FINAL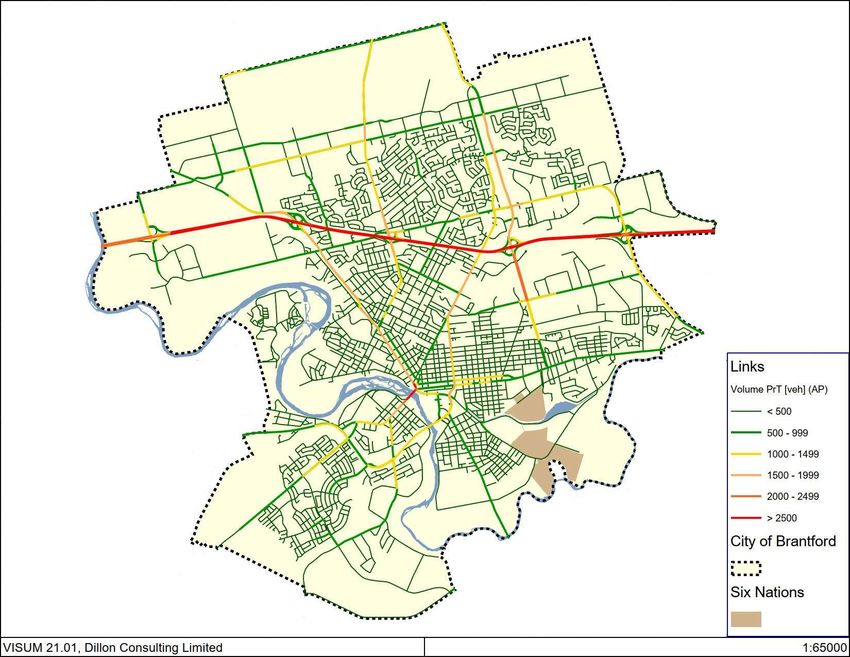
i

      Table of Contents
      Execu ve Summary

1.0   Study Foundation                                                                                                                                     1
      1.1       Background .............................................................................................................................. 1
      1.2       Study Objectives....................................................................................................................... 1
      1.3       Study Approach ........................................................................................................................ 2
      1.4       Stakeholder Agency Consultation ............................................................................................ 2
      1.5       Public Consultation .................................................................................................................. 3
      1.6       Existing Road Network ............................................................................................................. 3
      1.7       Existing Local Roadway Travel Demands ................................................................................. 3
      1.7.1     Approach .................................................................................................................................. 3
      1.7.2     Existing Automobile Traffic Level of Service (LOS)................................................................... 3
      1.7.3     Primary Trip Markets ............................................................................................................... 3
      1.8       Existing Transit Network Use ................................................................................................... 3
      1.9       Existing Active Transportation ................................................................................................. 3

2.0   Transportation Impacts of Growth                                                                                                                     4
      2.1       Population and Employment Growth ...................................................................................... 4
      2.2       Change in Travel Mode Choice ................................................................................................ 8
      2.3       Local Travel Growth to 2051 .................................................................................................... 8
      2.4       2051 Local Travel Assignment and Network.......................................................................... 10
      2.4.1     Updated Mobility Model for Transportation ......................................................................... 10
      2.4.2     Private Auto Traffic ................................................................................................................ 10
      2.4.3     Transit Ridership .................................................................................................................... 16

3.0   Complete Streets Framework                                                                                                                         20
      3.1       Introduction ........................................................................................................................... 20
      3.1.1     Objective ................................................................................................................................ 20
      3.1.2     Complete Streets ................................................................................................................... 20
      3.2       Existing Policies and Plans ...................................................................................................... 20
      3.2.1     Draft Official Plan (2020) ........................................................................................................ 20
      3.2.2     Transportation Master Plan (2014)........................................................................................ 20
      3.2.3     Linear Municipal Infrastructure Standards ............................................................................ 20
      3.3       Network Philosophy ............................................................................................................... 20

      City of Brantford
      Transportation Master Plan Update – 2051 Addendum
      September 2021 – 17-6501
ii

      3.4       Network Elements.................................................................................................................. 20
      3.4.1     Walking .................................................................................................................................. 20
      3.4.2     Cycling .................................................................................................................................... 21
      3.4.3     Transit .................................................................................................................................... 21
      3.4.4     Goods Movement .................................................................................................................. 22
      3.4.5     Automobiles ........................................................................................................................... 22
      3.5       Network Planning Guidelines................................................................................................. 24
      3.5.1     Principles ................................................................................................................................ 24
      3.5.2     Guidelines .............................................................................................................................. 24
      3.5.3     Performance Measures .......................................................................................................... 24
      3.5.4     Street Types ........................................................................................................................... 24
      3.6       Network Assessment ............................................................................................................. 24
      3.6.1     Walking .................................................................................................................................. 24
      3.6.2     Cycling .................................................................................................................................... 25
      3.6.3     Transit .................................................................................................................................... 25
      3.6.4     Goods and Services Movement ............................................................................................. 25
      3.6.5     Road Network ........................................................................................................................ 25

4.0   Transportation Assessment                                                                                                                            26
      4.1       Do Minimal ............................................................................................................................. 26
      4.2       Alternative Transportation Strategies ................................................................................... 29
      4.2.1     Travel Demand Management ................................................................................................ 29
      4.2.2     Transportation System Management .................................................................................... 36
      4.2.3     Increase Infrastructure........................................................................................................... 37
      4.3       Network Constraints and Solutions ....................................................................................... 40
      4.3.1     Brant Avenue - St Paul Avenue to Colborne Street ............................................................... 40
      4.3.2     Wayne Gretzky Parkway - Henry Street to Highway 403....................................................... 40
      4.3.3     Wayne Gretzky Parkway - North of Highway 403 .................................................................. 40
      4.3.4     King George Road - Crossing Highway 403 to Dunsdon Street .............................................. 40
      4.3.5     Paris Road - Highway 403 to Powerline Road ........................................................................ 40
      4.3.6     Colborne Street (Lorne Bridge) - Crossing the Grand River ................................................... 40
      4.3.7     West Street - Charing Cross Street to Henry Street ............................................................... 40
      4.3.8     Veterans Memorial Parkway - Mt. Pleasant Street to Market Street.................................... 40
      4.3.9     Paris Road - South of Highway 403 to Hardy Road ................................................................ 41
      4.3.10    Powerline Road - Paris Road to Wayne Gretzky Parkway...................................................... 41

      City of Brantford
      Transportation Master Plan Update – 2051 Addendum
      September 2021 – 17-6501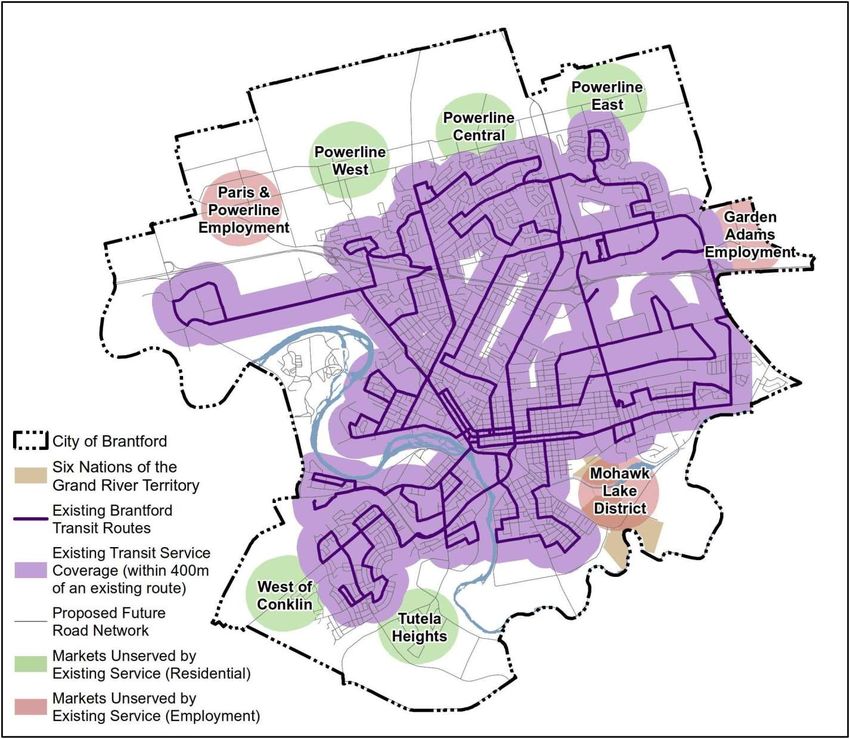
iii

      4.3.11    Hardy Road - Ferrero Boulevard to Paris Road ...................................................................... 41
      4.3.12    Erie Avenue - Veterans Memorial Parkway/Clarence Street South to Birkett Lane .............. 41
      4.3.13    Clarence Street/Clarence Street South – Dalhousie Street to Icomm Drive.......................... 41
      4.3.14    Colborne Street West – County Road 7 to D’Aubigny Road .................................................. 41
      4.3.15    Overall Combined Improvement Scenario Assessment......................................................... 41
      4.3.16    Goods Movement .................................................................................................................. 44
      4.4       Recommended Plan ............................................................................................................... 44
      4.4.1     Active Transportation ............................................................................................................ 44
      4.4.2     Transit .................................................................................................................................... 46
      4.4.3     Road Network ........................................................................................................................ 48
      4.4.4     Goods Movement .................................................................................................................. 51

5.0   Implementation Plan                                                                                                                                  52
      5.1       Active Transportation ............................................................................................................ 52
      5.1.1     Strategy .................................................................................................................................. 52
      5.1.2     Implementation ..................................................................................................................... 53
      5.1.1     Monitoring ............................................................................................................................. 55
      5.2       Transit .................................................................................................................................... 55
      5.2.1     Strategy .................................................................................................................................. 55
      5.2.2     Implementation ..................................................................................................................... 55
      5.2.3     Monitoring ............................................................................................................................. 57
      5.3       Road Network ........................................................................................................................ 58
      5.3.1     Strategy .................................................................................................................................. 58
      5.3.2     Implementation ..................................................................................................................... 58
      5.3.3     Monitoring ............................................................................................................................. 64

      City of Brantford
      Transportation Master Plan Update – 2051 Addendum
      September 2021 – 17-6501
iv
Figures
Figure 2-1: Population Growth by TAZ, 2016 to 2051 ............................................................................... 7
Figure 2-2: Employment Growth by TAZ, 2016 to 2051 ............................................................................ 8
Figure 2-3: Future (2051) ‘Do Minimal’ Road Network ........................................................................... 12
Figure 2-4: Future (2051) ‘Do Minimal’ Traffic Volumes- PM Peak Hour ............................................... 13
Figure 2-5: Future (2051) ‘Do Minimal’ Volume-to-Capacity Ratio - PM Peak Hour .............................. 14
Figure 2-6: Future (2051) Origin Transit Trips (per km 2) by TAZ – AM Peak Period................................ 18
Figure 2-7: Future (2051) Destination Transit Trips (per km 2) by TAZ – AM Peak Period ....................... 19
Figure 3-1: Roundabout - Wilson Street and Shaver Road in Ancaster, ON ........................................... 22
Figure 4-1: 2051 Do Minimal Network: Capacity Constraints ................................................................. 27
Figure 4-2: Existing Transit System Coverage and Future Market Opportunities ................................... 31
Figure 4-3: 2051 Transit Mode Split – Zone Policy Targets ..................................................................... 32
Figure 4-4: Inter-Regional Transit Opportunities .................................................................................... 33
Figure 4-5: 2051 Manage Travel Demand Network: Capacity Constraints ............................................. 35
Figure 4-6: 2051 Increased Infrastructure Network: Capacity Constraints............................................. 38
Figure 4-7: 2051 Recommended Network: Capacity Constraints ........................................................... 42
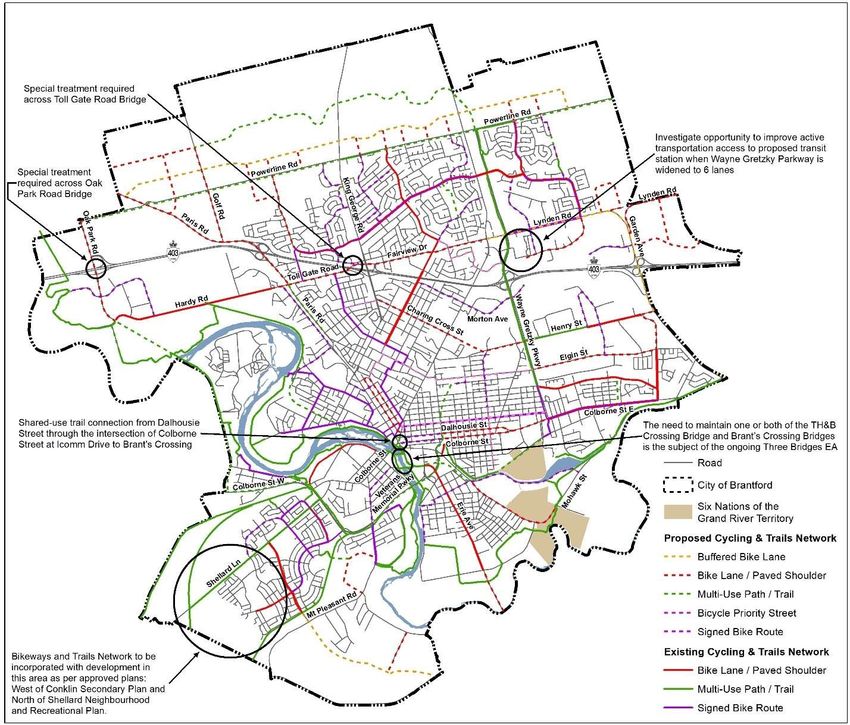
Figure 4-8: Proposed 2051 Cycling and Trails Network........................................................................... 45
Figure 4-9: Proposed 2051 Transit Service Expansion and Enhancement .............................................. 47
Figure 4-10: Roadway Classification ........................................................................................................ 49
Figure 4-11: Proposed 2051 Road Network ............................................................................................ 50
Figure 4-12: Proposed 2051 Truck Routes .............................................................................................. 51
Figure 5-1: Proposed Cycling and Trails Network Phasing Strategy ........................................................ 53
Figure 5-2: Candidate Roundabout Locations ......................................................................................... 61
Tables
Table 2-1: City of Brantford Population and Employment to 2051 - TAZ Distribution ............................. 4
Table 2-2: County of Brant Population and Employment to 2051 - Growth Plan ..................................... 5
Table 2-3: Population and Employment Growth - Brant (Growth Plan) and Brantford (TAZ
Distribution) ............................................................................................................................. 5
Table 2-4: Total trips by mode: Trips Originating in Brantford (Brantford to All) - AM Peak Period ........ 9
Table 2-5: Total trips by destination: Trips Originating in Brantford - AM Peak Period ........................... 9
Table 2-6: Future (2051) ‘Do Minimal’ Screenline Summary .................................................................. 15
Table 2-7: Brantford Modeled System Performance - PM Peak Period.................................................. 16
City of Brantford
Transportation Master Plan Update – 2051 Addendum
September 2021 – 17-6501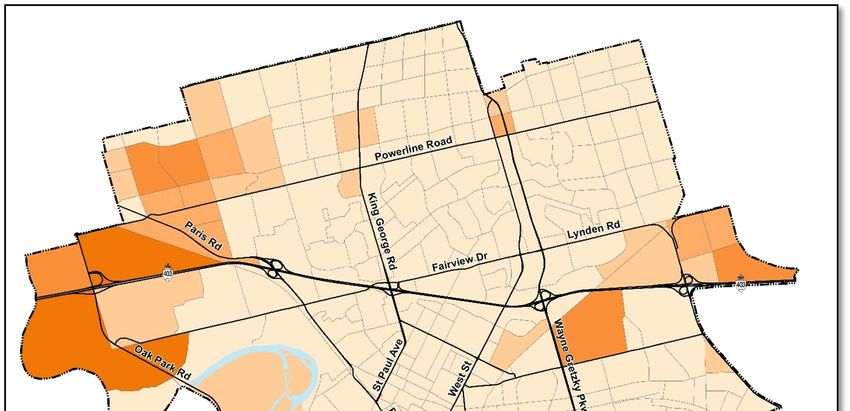
v

Table 2-8: Projected Transit Person Trip Growth, 2016 to 2051............................................................. 16
Table 2-9: Projected Local Transit Route Ridership Growth, 2016 to 2051 ............................................ 17
Table 4-1: 2051 Do Minimal: Screenline Assessment ............................................................................. 28
Table 4-2: Brantford Travel Mode Share Targets: Internal Trips (Brantford to Brantford) .................... 30
Table 4-3: 2051 Manage Travel Demand: Screenline Assessment ......................................................... 36
Table 4-4: 2051 Increase Infrastructure: Screenline Assessment ........................................................... 39
Table 4-5: 2051 Recommended: Screenline Assessment........................................................................ 43
Table 4-6: Proposed 2051 Cycling and Trails Network Summary............................................................ 46
Table 5-1: Proposed 2051 Cycling and Trails Network Summary............................................................ 52
Table 5-2: Cycling and Trails Recommendations by Time Frame ............................................................ 54
Table 5-3: Transit Service Recommendations by Time Frame ................................................................ 57
Table 5-4: TDM Recommended Implementation Plan ............................................................................ 59
Table 5-5: TSM Recommended Implementation Plan ............................................................................ 59
Table 5-6: Road Infrastructure Recommendations by Time Frame ........................................................ 64

Appendices
A            Public Consulta on – Updated
B            Bicycle Friendly Communi es Workshop – Summary Report and Recommenda ons –
             No Change
C            Transporta on Demand Forecas ng Model – Updated
D            Costs – Updated

City of Brantford
Transportation Master Plan Update – 2051 Addendum
September 2021 – 17-6501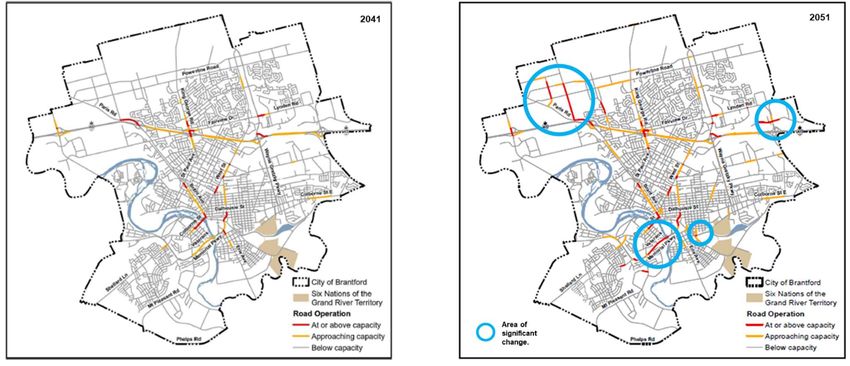
vi
Executive Summary
Introduc on
Background
This Transporta on Master Plan (TMP) addendum has been prepared to assess the impacts of the
incorpora on of the most recent 2051 growth forecasts from the Province into the City’s Official Plan –
Envisioning Our City 2051. The assump ons and recommenda ons from the 2020 Transporta on
Master Plan based on a 2041 horizon land use forecasts have been re-assessed and confirmed for a 2051
horizon.
Technical elements of the 2020 TMP Update have been updated as appropriate to reflect 2051 forecast
condi ons. The realloca on and incremental change in growth have been assessed to understand the
impact of these differences on the recommended capital projects arising from the 2020 TMP.
Addendum Objec ves
The following objec ves were set for this TMP Addendum:
1. Compare the new Provincial Growth Plan 2051 land use forecasts to the previous 2041 forecasts
used for the 2020 TMP Update;
2. Incorporate the 2051 land use forecasts into the City’s strategic transportation model and assess
the network performance changes for the various network alternatives tested;
3. Confirm the TMP findings for the long-term horizon related to the network constraints and the
adequacy of the TMP recommended transportation strategy; and
4. Re-assess as necessary the implementation costs for the recommended transportation strategy.
Addendum Approach
The approach used for this addendum is described as follows:
Allocate the 2051 land use forecasts to the Traffic Analysis Zones (TAZ);
Re-assess the strategic transporta on model trips genera on, distribu on, and assignment to
the alterna ve networks tested on the 2020 TMP Update:
o Do-Minimal;
o Maximize Travel Demand Management (TDM Max); and
o Maximize Infrastructure Supply (Infrastructure Max).
Assess the differences between the original TMP, based on the 2041 assessment of the
alterna ves and the new 2051 assessment to determine residual or new capacity constraints in
the network; and
Iden fy addi onal service or infrastructure required to address the 2051 constraints and prepare
cost es mates for the recommended transporta on strategy.
City of Brantford
Transportation Master Plan Update – 2051 Addendum
September 2021 – 17-6501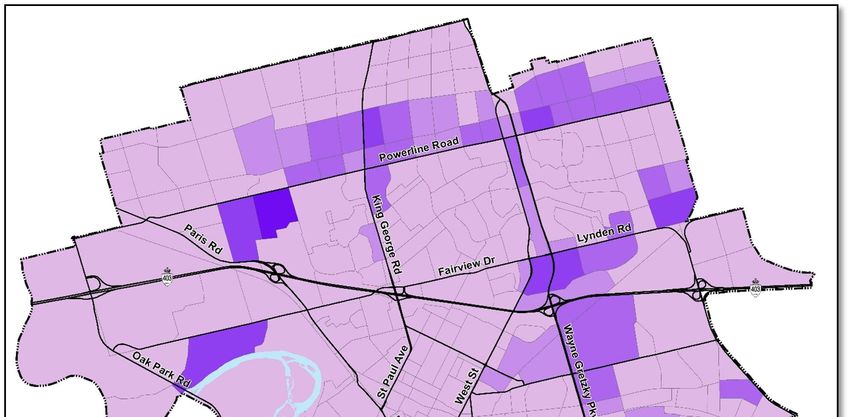
vii

Founda ons
Impacts of Growth
The Growth Plan for the Greater Golden Horseshoe iden fies the growth direc ons for popula on and
employment growth within the City.

Ul mately, as per the Growth Plan, the City’s popula on is expected to grow from 101,700 people in
2016 to 165,000 people by 2051. Employment is expected to grow from 44,900 in 2016 to 80,000 people
by 2051, as shown in Table ES-1.

Table ES-1: Population and Employment Growth - Brant and Brantford
Demographic Area                     2016                   2051                  Growth
Population
County of Brant                     38,0001               59,0002                  55%
City of Brantford                  101,7003               165,0002                 62%
Total                               139,700               224,000                  60%
Employment
County of Brant                     15,0001               26,0002                  73%
City of Brantford                   44,9003               80,0002                  78%
Total                               59,900                106,000                  77%
Source:   1 Greater Golden Horseshoe: Growth Forecasts to 2051, Hemson Consulting Ltd., 2020
          2 A Place to Grow: Growth Plan for the Greater Golden Horseshoe, 2020
          3 SGL Planning and Design Inc., 2021

The new popula on and employment data for 2051 was disaggregated to a Traffic Zone level of detail,
accoun ng for detailed planning informa on within Greenfield Areas, Intensifica on Corridors and
Se lement Area Boundary Expansion Lands, for incorpora on into the City’s strategic forecas ng model.
Table ES-2 provides the 2051 totals as per the Growth Plan forecast and as distributed to the Traffic Zone
level.

Table ES-2: 2051 Brantford Population and Employment – Comparison of Growth Plan and Traffic Zone Forecasts
                                  Growth Plan1              Traffic Zone2
2051 Population                      165,000                   164,736
2051 Employment                       80,000                    83,365
Source:   1 A Place to Grow: Growth Plan for the Greater Golden Horseshoe, 2020
          2 SGL Planning and Design Inc., 2021

The TMP considers the 2051 population and employment at a Traffic Zone level for the City of Brantford,
and as per the Growth Plan for the County of Brant, for its analysis. Figure ES-1 and Figure ES-2 provide
plots of the changes in allocation for each traffic zone between the 2041 forecast used for the 2020 TMP
Update and the more recent 2051 forecasts.

City of Brantford
Transportation Master Plan Update – 2051 Addendum
September 2021 – 17-6501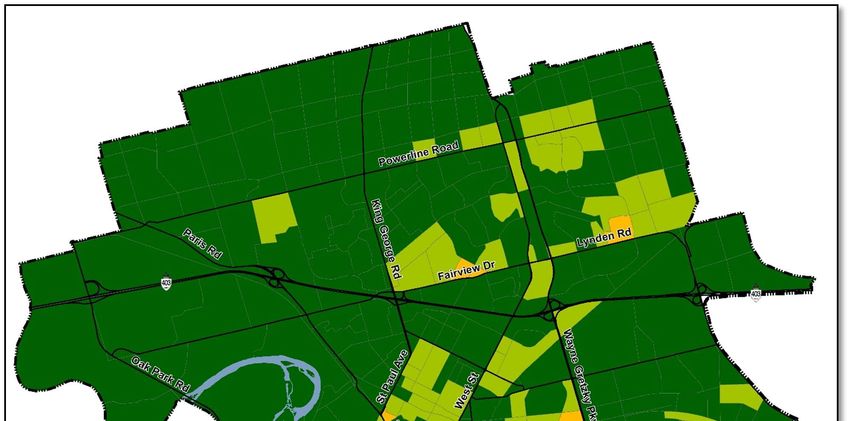
viii

Figure ES-1: Population Growth Allocation – Comparison of 2041 and 2051 Forecasts

City of Brantford
Transportation Master Plan Update – 2051 Addendum
September 2021 – 17-6501
ix
Figure ES-2: Employment Growth Allocation – Comparison of 2041 and 2051 Forecasts
The following is noted with respect to the 2051 forecasts:
The 2051 not only reflects an increase in popula on and employment over the 2041 forecasts, it
also represents a redistribu on of land use between areas. This means the 2051 forecasts do
not simply reflect a 10-year growth scenario over 2051, but also a change in the way growth
occurs over the short, medium, and long term;
Areas of popula on most impacted by the change:
o North Expansion area - Powerline East block is shown to have an increase in popula on and
redistribu on between development blocks; and
City of Brantford
Transportation Master Plan Update – 2051 Addendum
September 2021 – 17-6501x
o Mohawk Lake District – popula on from the Casino area has been reallocated to the
Mohawk District
Areas of Employment most impacted by the change:
o North Expansion area – Paris Road Employment and the Powerline Road Employment blocks
are shown to have an increase in employment.
Growth to 2051 was assessed for a ‘Do Minimal’ network scenario (reflec ng no changes to mode
shares or roadway network capacity with the excep on of the proposed arterial/collector road network
for the expansion lands in Tutela Heights and North Bran ord to facilitate access to future lands).
The following 2051 capacity issues are consistent with 2014 TMP model findings for the 2031 horizon:
Wayne Gretzky Parkway between Henry Street and Highway 403;
King George Road crossing Highway 403;
Veterans Memorial Parkway between Mt. Pleasant Street and Market Street South;
Colborne Street crossing the Grand River;
Paris Road between Highway 403 and Powerline Road;
Brant Avenue between St Paul Avenue and Colborne Street; and
West Street between Charing Cross Street and Henry Street.
However, there are a few notable capacity issues that have emerged in 2051, most notably as a result of
the se lement boundary expansion, that were not present in the 2014 TMP findings for the 2031
horizon:
Powerline Road between Paris Road and Wayne Gretzky Parkway;
Wayne Gretzky Parkway north of Highway 403;
Hardy Road between Ferrero Boulevard and Paris Road;
Paris Road south of Highway 403;
Erie Avenue between Veterans Memorial Parkway and Birke Lane; and
Highway 403 / Oak Park Road interchange.
Transporta on System Review
The updated land uses were used to generate new volume forecasts for the recommended 2051
network strategy, including increased Travel Demand Management (TDM, including target increases in
ac ve transporta on and transit) and infrastructure projects. The results of the 2051 assignment to the
recommended network revealed the following poten al capacity issues in the network, beyond those
iden fied in the TMP 2041 assessment:
Highway 403 / Oak Park Road interchange;
Golf Road between Paris Road and the new East-West Road north of Powerline Road; and
Mohawk Street/Greenwich Street/Murray Street intersec on.
City of Brantford
Transportation Master Plan Update – 2051 Addendum
September 2021 – 17-6501xi
Figure ES-3 provides a summary of the comparison of the 2041 and 2051 capacity condi ons on the
TMP recommended network.
Figure ES-3: 2020 TMP Recommended Network – Comparison of 2041 and 2051 Capacity Conditions
A detailed review of the volume-to-capacity assessment revealed the following related to these
constraints.
Highway 403 / Oak Park Road interchange:
o The interim design for the interchange was shown to be working at full capacity in 2041
o The increased volume on the bridge structure related to the ul mate 2051 land use in the
Paris Road and Powerline employment blocks results in traffic demands on the bridge being
over its capacity in the peak period
o The full buildout of the employment areas to the north will necessitate the implementa on
of the ul mate interchange design
o MTO/City undertaking: EA complete, Design complete, ming of improvement to be
confirmed
Golf Road between Paris Road and the new East-West Road north of Powerline Road:
o The 2041 recommenda on: implement Transporta on System Management (TSM)
ini a ves to address the performance constraints
o Minor enhancements of the proposed TSM will accommodate the increase in volume to
2051
Mohawk Street/Greenwich Street/Murray Street intersec on:
o The 2051 assignment results do not iden fy the need for a strategic capacity improvement,
meaning the 2041 recommenda ons remain valid
o The 2051 assignment does iden fy the need for a local opera onal improvement to
accommodate Mohawk Lake District site traffic
City of Brantford
Transportation Master Plan Update – 2051 Addendum
September 2021 – 17-6501xii
o Technical study (Traffic Impact Study) required to confirm opera onal requirements as
part of development applica on
Recommended Network
The preferred solu on to address the forecast growth of the City to 2051 is a combined scenario that
includes the following elements: transit service improvement/enhancements to promote increased
transit use; the provision of ac ve mode infrastructure to promote increased cycling and walking; and
network infrastructure improvements to address the capacity constraints in the network. This solu on
results in a network and demand solu on that addresses the iden fied long-term network deficiencies.
The performance of this combined scenario 2051 Recommended Plan shows that almost all of the
an cipated roadway capacity issues iden fied for 2051 Do-Minimal condi on (where no long-term
investment was made in transit service, ac ve transporta on, or infrastructure) are resolved.
Figure ES-4 iden fies the few remaining capacity/opera onal issues in the 2051 Recommended
Network. The remaining capacity/opera onal issues include the Lorne Bridge, Clarence Street/Clarence
Street South between Icomm Drive and Colborne Street East, and Paris Road. The transporta on
assessment suggests that while these are iden fied as capacity constraints in the long term, the
magnitude of the issue has been significantly reduced. These issues are now forecast to be marginal and
can be successfully managed in the near- and mid-term. These loca ons should con nue to be
monitored to iden fy the significance of any emerging issue. It is also recommended that lands be
protected in the Veterans Memorial Parkway par al extension (to Murray Street) corridor such that the
opportunity to implement this improvement is not lost in the very long term.
City of Brantford
Transportation Master Plan Update – 2051 Addendum
September 2021 – 17-6501xiii Figure ES-4: 2051 Recommended Network: Capacity Constraints City of Brantford Transportation Master Plan Update – 2051 Addendum September 2021 – 17-6501
xiv

Recommended Plan
Active Transportation
The Ac ve Transporta on Plan remains as documented in the 2020 TMP Update.

The proposed cycling infrastructure is shown in Figure ES-5. The implementa on of this plan will
increase the current 67.4 km of on road cycling to 141 km by adding 74 center-line kilometres of bike
lanes; 30 km of mul -use paths and trails and a program for encouraging more AT as the city expands.

Figure ES-5: Proposed 2051 Active Mode Network

City of Brantford
Transportation Master Plan Update – 2051 Addendum
September 2021 – 17-6501
xv

Transit
The Transit Plan remains as documented in the 2020 TMP Update.

The objec ves with respect to the system coverage and expansion requirements for transit system are
iden fied in Figure ES-6.

Figure ES-6: Proposed 2051 Transit Service Expansion and Enhancement

City of Brantford
Transportation Master Plan Update – 2051 Addendum
September 2021 – 17-6501
xvi
Road Infrastructure
From the transporta on assessment, the road infrastructure improvements for the 2051 horizon year
have been iden fied as shown on Figure ES-7.
Figure ES-7: Proposed 2051 Road Network
The enhancements include infrastructure widening on:
Wayne Gretzky Parkway between Henry Street and Lynden Road;
Veterans Memorial Parkway between Mount Pleasant and Market Street South;
Colborne Street West from County Road 7 to the exis ng 4-lane sec on;
Paris Road from Golf Road to City Limits;
Oak Park Road from Hardy Road to Powerline Road (including the Highway 403 interchange
upgrade to ul mate design); and
Powerline Road from Oak Park Road to the City east limits.
City of Brantford
Transportation Master Plan Update – 2051 Addendum
September 2021 – 17-6501xvii
New road addi ons include:
Oak Park Road extension to Colborne Street West;
Wayne Gretzky Parkway extension to connect with Park Road;
East-West Collector Road north of Powerline from Oak Park Road to East City Limits;
Conklin Road Extension from Mt. Pleasant Road to Phelps Road; and
Charing Cross Street extension to Henry Street.
TSM improvements to enhance the exis ng capacity (through urbaniza on, parking restric ons, and
opera onal improvements) are proposed for several corridors including:
Golf Road;
Paris Road;
Brant Ave;
Hardy Road;
West Street;
King George Road;
Erie Avenue;
Clarence Street; and
County Road 18 (note that this is a County Road. The City will work with the County to
determine poten al for improvements to the corridor).
It is also recommended that lands be protected in the Veterans Memorial Parkway par al extension (to
Murray Street) corridor such that the opportunity to implement this improvement is not lost in the very
long term
All of the projects iden fied will require a Schedule B or C MCEA to be completed, which would include
significant public/stakeholder consulta on, before they can be implemented.
Implementa on Plan
Active Transportation Plan
As the Active Transportation plan elements were derived based on the provision of connected and
continuous infrastructure the plan does not change from that recommended in the 2020 TMP Update.
Transit Service Plan
The Short and Mid-Term transit improvements for the transit system do change from that
recommended in the 2020 TMP Update. However, in extending the me horizon from 2041 to 2051
addi onal maintenance and equipment replacement costs are required to support the future transit
service. Table ES-3 summarizes the addi onal costs to support the addi onal transit service
requirements.
City of Brantford
Transportation Master Plan Update – 2051 Addendum
September 2021 – 17-6501xviii
Table ES-3: Additional 2051 Transit Service Recommendations
Capital Item Description Cost ($000)*
Long Term [2042 – 2051]
Fleet 5 new vehicles, 12 replacement vehicles $18,700
Building - -
Transfer Points - -
Route Infrastructure New Stops/ Shelters Expansion Routes/ITS $1,620
Studies Transit Master Plan Update $100
Specialized Vehicle Replacement, Software Upgrade $5,800
Total $26,220
* All costs stated in 2020 dollars
Road Infrastructure Plan
The capital cost to provide the addi onal infrastructure recommended for the 2051 condi on, beyond
that recommended in the 2020 TMP Update is provided in Table ES-4. There are no addi onal capital
costs associated with the subsequent minor TSM enhancements on Golf Road.
Table ES-4: Additional 2051 Road Infrastructure Recommendations
Project Description Cost ($000)*
Mid Term [2026 – 2031]
Mohawk Street / Greenwich Street / Intersection realignment and improvements $3,600
Murray Street Intersection
Long Term [2042 – 2051]
Highway 403 / Oak Park Road Upgrade to ultimate configuration $18,000
Interchange
Sub-Total $21,600
* All costs stated in 2020 dollars & Contingency of 20% for Construction and 30% for Engineering assumed unless stated
specifically in reference reports (i.e. feasibility reports).
Conclusions
The impacts of the change in provincial land use projec ons from the 2041 to 2051 horizon on the
recommended transporta on strategy and infrastructure requirements as iden fied in the 2020 TMP
Update have been assessed. The following is concluded:
The overall change in long term popula on and employment between 2041 (as assessed for the
TMP) and 2051 is not significant. City of Bran ord popula on increases by approximately 2,000
persons and employment increases by approximately 3,000 persons by the revised horizon year;
The most significant growth is in the Northwest /Powerline Industrial Park Employment Area;
There is a slight change in the way that popula on and employment growth is allocated within
the City. The most significant change is the realloca on of popula on and employment growth
from the Casino area to the Mohawk Lake District;
City of Brantford
Transportation Master Plan Update – 2051 Addendum
September 2021 – 17-6501xix
The 2051 transporta on demands as assigned to the 2041 recommended network strategy show
only a few areas where addi onal improvements will be required:
o Mohawk Street / Greenwich Street / Murray Street – local improvements;
o Golf Road from Paris Road to north of Powerline Road – addi onal TSM; and
o Highway 403 / Oak Park Road Interchange – new infrastructure.
The recommenda ons in the 2020 TMP Update related to Ac ve Transporta on and Transit
remain valid;
The implementa on strategy is not affected by the change from the 2041 to 2051 horizon; and
Costs have been added to reflect the addi onal service and infrastructure required to support
growth the 2051 horizon year.
The following report updates the sec ons of the 2020 Transporta on Master Plan Update for those
assessment elements that have been updated to reflect the 2051 condi on.
City of Brantford
Transportation Master Plan Update – 2051 Addendum
September 2021 – 17-65011
1.0 Study Foundation
1.1 Background
This Transporta on Master Plan (TMP) addendum has been prepared to assess the impacts of the
incorpora on of the most recent 2051 growth forecasts from the Province into the City’s Official Plan –
Envisioning Our City 2051. The assump ons and recommenda ons from the 2020 Transporta on
Master Plan based on a 2051 horizon land use forecasts have been re-assessed and confirmed.
Technical elements of the 2020 TMP Update have been updated as appropriate to reflect 2051 forecast
condi ons. The realloca on and incremental change in growth have been assessed to understand the
impact of these differences on the recommended capital projects arising from the 2020 TMP.
1.2 Study Objectives
The following study objec ves were set by the City for this TMP Update:
1. Plan to accommodate city growth to 2051, including the urban boundary expansion of the City
of Brantford, the intensification target for development within the Built-Up Area, and density
targets within the Designated Greenfield Area as set out in the new Official Plan;
2. Provide transportation infrastructure project and cost input into the Development Charges
update;
3. Follow the Master Planning process and key principles of the Municipal Class EA to satisfy EA
requirements for the planning phase of Schedule ‘B’ undertakings, and Phase 1 and 2 for
Schedule ‘C’ projects; and
4. Consult with First Nations, agencies, stakeholders and the public early and continuously
throughout the Master Planning process, using various techniques and materials.
Other objec ves, constraints and limita ons that influenced the development of this TMP Update
include:
Con nue to strive for a “made for Bran ord” Master Plan reflec ng the unique characteris cs
of Bran ord and its context while s ll learning from successes in other similar-sized ci es.
Show the impacts of “Status Quo” approach to system management, in terms of addressing
deficiencies, level-of-service, and ability to meet planning targets.
Coordinate TMP prepara on with the City’s concurrent Municipal Comprehensive Review (OP)
and the Master Servicing Plan (MSP) study in terms of growth forecas ng, consulta on
ac vi es, and planning of cost efficiencies in the development of new transporta on, sewer and
water infrastructure.
Integrate transporta on and land use planning. Transporta on and land use planning has been
coordinated to iden fy bold transporta on strategies that will be required to support an overall
City of Brantford
Transportation Master Plan Update – 2051 Addendum - FINAL
September 2021 – 17-65012
sustainability plan for transporta on up to 2051, and translate these strategies into Official Plan
policy.
Work towards becoming a Bicycle Friendly Community and receiving a designa on by Share the
Road Cycling Coali on by providing a clear, concise pathway towards a more bicycle friendly
future.
Define the future role of public transit. Reduce the City’s environmental footprint by increasing
transit use through improved service levels, by effec vely serving newly developing areas,
mee ng the accessibility needs of residents, by considering inter-municipal and inter-regional
links, and by considering new micro-transit technologies in support of first/last mile solu ons.
A Complete Streets philosophy has been applied to this TMP Update so that streets are planned,
built, and maintained for all users.
Prepara on for Connected and Autonomous Vehicles (CAVs). Consider how the emergence of
CAVs will impact small-sized ci es, such as Bran ord, and how to strategically prepare for them.
1.3 Study Approach
The approach used in this TMP Update was organized into five (5) dis nct project phases:
Phase 1: Develop a Study Founda on – Set the stage and boundaries for the City of Bran ord’s
transporta on system.
Phase 2: Integrated Transporta on Strategy – Determine integrated strategies for developing
networks, programs, and policies for all travel modes in a manner that supports community-
building objec ves.
Phase 3: Street Network Capacity Needs – Define problems and opportuni es for the
transporta on system.
Phase 4: Review of Key Transporta on Issues – Review and assess the rela onship between
regional and local needs of the transporta on network and iden fy a plan and role for the local
system.
Phase 5: Implementa on Plan – Bring the elements of the TMP together and develop a prac cal
approach to implement and monitor the TMP transporta on network and guide the City forward
to the 2051 horizon year.
Our approach and methodology is designed to sa sfy EA requirements for the planning phase of
Schedule ‘B’ undertakings, and Phases 1 and 2 for Schedule ‘C’ projects of the Municipal Class
Environmental Assessment (EA) process and follows Master Planning Process Approach #1. The
integra on of technical and consulta on ac vi es is a core element of the process.
Technical analysis and studies required in support of the Schedule B projects in development areas will
be undertaken as part of the design process by the developer and approved through the Planning Act
Municipal development review process. Other Schedule B projects will be sa sfied through separate
class EA studies prior to design and construc on.
City of Brantford
Transportation Master Plan Update – 2051 Addendum - FINAL
September 2021 – 17-65013
1.4 Stakeholder Agency Consultation
Stakeholder Agency Consulta on remains as documented in the 2020 TMP Update.
1.5 Public Consultation
The stakeholder and public consulta on session that was conducted as part of the TMP addendum is as
follows:
No ce of Addendum – Posted June 17, 2021 with the 45-Day Review Period ending August 4,
2021.
The no ce and public comments for the aforemen oned consulta on event is included in Appendix A.
1.6 Existing Road Network
The Exis ng Road Network remains as documented in the 2020 TMP Update.
1.7 Existing Local Roadway Travel Demands
1.7.1 Approach
Approach remains as documented in the 2020 TMP Update.
1.7.2 Exis ng Automobile Traffic Level of Service (LOS)
Exis ng Automobile Traffic Level of Service (LOS) remains as documented in the 2020 TMP Update.
1.7.3 Primary Trip Markets
Primary Trip Markets remains as documented in the 2020 TMP Update.
1.8 Existing Transit Network Use
Exis ng Transit use remains as documented in the 2020 TMP Update.
1.9 Existing Active Transportation
Exis ng Ac ve Transporta on remains as documented in the 2020 TMP Update.
City of Brantford
Transportation Master Plan Update – 2051 Addendum - FINAL
September 2021 – 17-65014
2.0 Transportation Impacts of Growth
2.1 Population and Employment Growth
The most recent Places to Grow (August 2020) policies include growth forecasts for the City of Bran ord
with a residen al popula on of 165,000 and an employment level of 80,000 by 2051.
As part of the City of Bran ord’s Official Plan Review process, the Ministry growth forecasts were
incorporated into a Municipal Comprehensive Review (MCR) as input to the City’s new Official Plan
(undertaken by SGL Planning and Design Inc. (SGL)). The MCR Part 1 Report, iden fied an alterna ve
intensifica on target for the delineated Built-up Area and an alterna ve Designated Greenfield Area
(DGA) density target appropriate for the City of Bran ord as well as lands to convert from employment
use and whether there was a need for a se lement area boundary expansion and the quantum of that
need. The MCR Part 2 Report iden fied what part of the Boundary Adjustment Lands will be included in
the se lement area boundary expansion to accommodate the iden fied need for urban lands. A
majority of the work for the MCR predates the Mohawk Lake District Plan.
The 2051 popula on and employment forecasts were disaggregated by SGL to match the Traffic Analysis
Zone (TAZ) structure within the City’s strategic transporta on model. The alloca ons were based on
intensifica on policies and targets, Schedule 1: Growth Management in the City’s dra Official Plan, land
use designa ons, and sites with known development poten al.
At a summary level, the growth forecasts used in this TMP growth analysis are shown in Table 2-1 and
Table 2-2 below for the City of Bran ord and County of Brant respec vely. Detailed TAZ level popula on
and employment data for Bran ord and Brant County (2016 and 2051) can be found in Appendix C.
Table 2-1: City of Brantford Population and Employment to 2051 - TAZ Distribution
Horizon Year Popula on (Persons) Employment (Jobs)
2016 101,7001 44,9001
2021 Est 111,300 53,600
2026 Est 125,200 60,300
2
2031 139,000 67,0002
2036 152,0002 72,0002
2041 162,1501 80,1501
2051 164,7361 83,3651
Source: 1 SGL Planning and Design Inc., 2021
2 A Place to Grow: Growth Plan for the Greater Golden Horseshoe, 2019
City of Brantford
Transportation Master Plan Update – 2051 Addendum - FINAL
September 2021 – 17-65015
Table 2-2: County of Brant Population and Employment to 2051 - Growth Plan
Horizon Year Popula on (Persons) Employment (Jobs)
2016 38,0001 15,0001
2021 Est 41,000 17,000
2026 Est 44,000 19,000
2
2031 49,000 22,0002
2036 53,0002 24,0002
2041 57,0002 26,0002
2051 59,0003 26,0003
Source: 1 Greater Golden Horseshoe: Growth Forecasts to 2051, Hemson Consulting Ltd., 2020
2 A Place to Grow: Growth Plan for the Greater Golden Horseshoe, 2019
3 A Place to Grow: Growth Plan for the Greater Golden Horseshoe, 2020
Applying updated growth forecasts, disaggregated to the TAZ level-of-detail, the City’s model was
u lized to forecast future travel demands (i.e. Future Condi ons) resul ng from popula on growth,
employment growth, and future land use pa erns and densi es as provided by the City. These were
further enhanced using output from the ongoing Official Plan Update. Forecasted Future Condi ons and
various alterna ve transporta on strategies were subsequently assessed based on the strategic
direc on criteria are iden fied in Sec on 2.4 and in Chapter 4.0.
The popula on and employment forecasts for the City of Bran ord and County of Brant indicate
significant growth in the period from 2016 to 2051. The popula on and employment are expected to
grow by 60% and 83% respec vely during this 35-year period as shown on Table 2-3.
Table 2-3: Population and Employment Growth - Brant (Growth Plan) and Brantford (TAZ Distribution)
Demographic Area 2016 2041 2051 Growth
Population
County of Brant 38,0001 57,0002 59,0003 55%
City of Brantford 101,7004 162,1404 164,7364 62%
Total 139,700 219,140 223,736 60%
Employment
County of Brant 15,0001 26,0002 26,0003 73%
City of Brantford 44,9004 80,1534 83,3654 86%
Total 59,900 106,153 109,365 83%
Source: 1 Greater Golden Horseshoe: Growth Forecasts to 2051, Hemson Consulting Ltd., 2020
2 A Place to Grow: Growth Plan for the Greater Golden Horseshoe, 2019
3 A Place to Grow: Growth Plan for the Greater Golden Horseshoe, 2020
4 SGL Planning and Design Inc., 2021
City of Brantford
Transportation Master Plan Update – 2051 Addendum - FINAL
September 2021 – 17-65016
Figure 2-1 and Figure 2-2 present the popula on and employment growth from 2016 to 2051. These
figures include an expansion of the current urban boundary (Se lement Area) and assign popula on and
employment growth to these areas in conjunc on with the parallel Bran ord Expansion Area study
developed by Dillon in consulta on with the City of Bran ord. Based on current growth and growth
an cipated in the expanded urban boundary, the following trends to the 2051 horizon year are noted:
High employment growth in the Oak Park Road & Hardy Road (Northwest Industrial Park) and
Henry Street/Wayne Gretzky (Braneida Industrial Park) areas;
High employment growth in the expansion lands east of Garden Avenue at Highway 403 and
north of Powerline Road just east of Paris Road;
High popula on growth in the southern zones surrounding Shellard Lane, Mt Pleasant Road and
Erie Avenue;
High popula on growth in the northern expansion zones (north of Powerline Road) from
Balmoral Drive in the west to Coulbeck Road in the east;
High popula on and employment growth along the King George Road corridor; and
High popula on and employment growth in the downtown core.
Intensifica on within downtown Bran ord and along the King George Road corridor will increase the
densi es within these areas of the city. Denser, more urban areas contribute to modal shi s away from
the single occupancy vehicle as the distance to many ameni es will decrease, making them more
bikeable and walkable, while transit service will increase, as higher densi es support higher service
frequency.
City of Brantford
Transportation Master Plan Update – 2051 Addendum - FINAL
September 2021 – 17-65017 Figure 2-1: Population Growth by TAZ, 2016 to 2051 City of Brantford Transportation Master Plan Update – 2051 Addendum - FINAL September 2021 – 17-6501
8

      Figure 2-2: Employment Growth by TAZ, 2016 to 2051

2.2   Change in Travel Mode Choice
      Change in Travel Mode Choice remains as documented in the 2020 TMP Update.

2.3   Local Travel Growth to 2051
      The updated travel forecas ng model forecasts travel in the City of Bran ord and County of Brant in
      2051 first under a “Do Minimal” scenario. In this case, the travel mode choices are unchanged from

      City of Brantford
      Transportation Master Plan Update – 2051 Addendum - FINAL
      September 2021 – 17-6501
9
2016, and no further capacity improvements (i.e. road widenings, extensions) are included in the model.
However, a small number of infrastructure modifica ons that have been completed since 2016 were
included along with the proposed arterial/collector road network for the expansion lands (Tutela
Heights & North Bran ord). As a result of the Tutela Heights Slope Stability EA, the poten al closure of
Tutela Heights Road in the vicinity of Davern Road is also incorporated.
Bran ord’s forecasted growth will significantly alter the local travel demands within the City. Table 2-4
displays the exis ng (2016) and forecast (2051) trips by mode that originate in Bran ord during the AM
peak period. By 2051 Bran ord is forecast to generate more than 85,900 AM peak period person trips
on an average weekday. That’s an increase of 72% over 2016 person trips.
Table 2-4: Total trips by mode: Trips Originating in Brantford (Brantford to All) - AM Peak Period
2016 2051
Mode \ Year
Trips % Trips %
Auto Driver 36,520 73.2% 63,070 73.4%
Auto Passenger 5,370 10.8% 10,000 11.6%
Transit 1,350 2.7% 1,840 2.1%
Bicycle 330 0.7% 480 0.6%
Walk 3,190 6.4% 5,010 5.8%
Other 3,130 6.3% 5,530 6.4%
Total 49,890 100.0% 85,930 100.0%
The total exis ng (49,890) and forecast (85,930) person trips can be further broken down based on
where the trips are des ned to. This is displayed in Table 2-5.
Table 2-5: Total trips by destination: Trips Originating in Brantford - AM Peak Period
2016 2051
Des na on \ Year
Trips % Trips %
Brantford to Brantford 36,980 74.1% 64,720 75.3%
Brantford to Brant County 5,250 10.5% 9,150 10.6%
Brantford to External East (Hwy 403 east) 4,310 8.6% 6,250 7.3%
Brantford to External West (Hwy 403 west) 490 1.0% 750 0.9%
Brantford to External North (Hwy 24 north) 1,440 2.9% 2,100 2.4%
Brantford to External Other 1,420 2.8% 2,960 3.4%
Total (Brantford to All) 49,890 100.0% 85,930 100.0%
City of Brantford
Transportation Master Plan Update – 2051 Addendum - FINAL
September 2021 – 17-650110
Table 2-5 indicates that in the 2051 forecasted scenario there is higher propor on (1.2 percentage
points) of internal (Bran ord to Bran ord) trip making, while conversely an equal reduc on of the
propor on of Bran ord to External trip making. The increase in local trips is likely the result of the
significant increase in employment and par cipa on rate that is forecast for Bran ord.
2.4 2051 Local Travel Assignment and Network
The updated popula on and employment forecasts for the horizon year, travel mode choice, and trips
distribu on informa on, as described in Sec ons 2.1 through 2.3 above, were incorporated into the
City’s travel demand model and assigned to the horizon year network to produce future base year
volume forecasts on the road network. This process and the resultant forecasts are described in the
following sec ons.
2.4.1 Updated Mobility Model for Transporta on
Update Mobility Model for Transporta on remains as documented in the 2020 TMP Update.
2.4.2 Private Auto Traffic
As previously reported in Sec on 2.1 of this TMP, popula on and employment forecasts for the City of
Bran ord are expected to grow by 62% and 78%, respec vely, between 2016 and 2051. A 2051 ‘Do
Minimal’ scenario reflects no changes to peak hour mode shares and only short term commi ed
projects (e.g. The 2020 Oak Park Road/Highway 403 interchange upgrade) and the arterial/collector
roads required to support the expansion lands (Tutela Heights & North Bran ord). Figure 2-3 displays
the 2051 ‘Do Minimal’ road network. The proposed addi onal roads in Tutela Heights (Conklin Road
Extension) and North Bran ord (New East/West Road, etc.) are illustrated in this figure. Figure 2-4
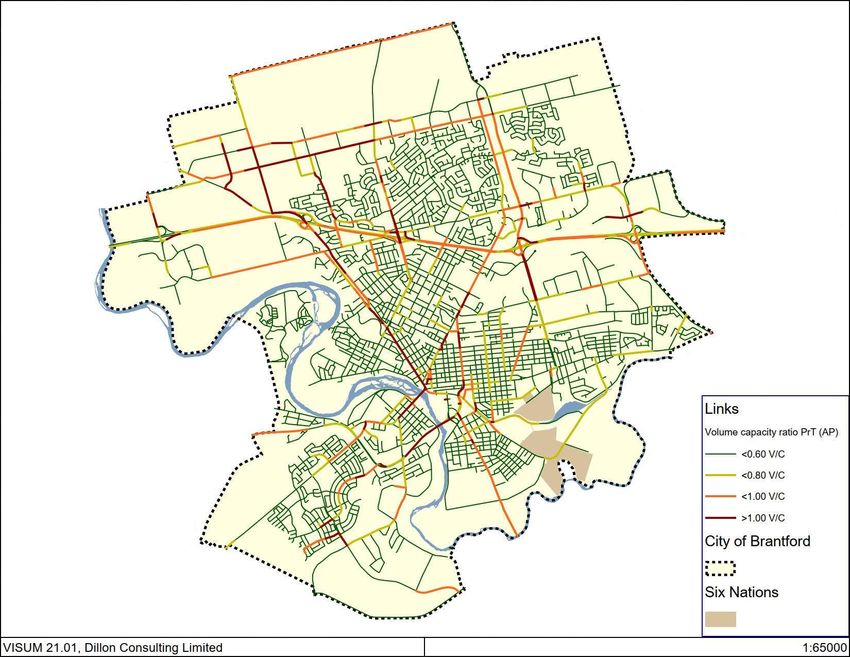
illustrates the assignment of private auto vehicles on the 2051 network in the PM peak hour and Figure
2-5 illustrates the same assignment of private auto vehicles on the 2051 network measured against
roadway capacity as a volume/capacity (V/C) ra o. Table 2-6 provides an overview of the AM and PM
screenline summaries, using the same screenlines defined for the model valida on (illustrated in Figure
2-3 of the 2020 TMP Update). Unlike the screenline analysis used to validate the auto travel within the
model, the screenline summaries in Table 2-6 evaluate the cumula ve travel demand on the roadways
crossing the screenline. The cumula ve travel demand crossing the screenline is compared to the
cumula ve capacity crossing the screenline in order to establish V/C ra o, which provides an indica on
of how well a specific corridor/screenline is opera ng. It is important to note that while some
screenlines are opera ng within capacity, there may be links on the screenline that have opera ng
deficiencies, as iden fied in Figure 2-5. Detailed link summary tables for each screenline can be found in
Appendix C.
The aforemen oned figures and table illustrate the following 2051 PM peak hour capacity issues that
are consistent with 2014 TMP model findings for the 2031 horizon:
Wayne Gretzky Parkway between Henry Street and Highway 403;
King George Road crossing Highway 403;
City of Brantford
Transportation Master Plan Update – 2051 Addendum - FINAL
September 2021 – 17-650111
Veterans Memorial Parkway between Mt. Pleasant Street and Market Street South;
Colborne Street crossing the Grand River;
Paris Road between Highway 403 and Powerline Road;
Brant Avenue between St Paul Avenue and Colborne Street; and
West Street between Charing Cross Street and Henry Street.
However, there are a few notable capacity issues that have emerged in 2051, most notably as a result of
the se lement boundary expansion, that were not present in the 2014 TMP model findings for the 2031
horizon:
Powerline Road between Paris Road and Wayne Gretzky Parkway;
Wayne Gretzky Parkway north of Highway 403;
Hardy Road between Ferrero Boulevard and Paris Road;
Paris Road south of Highway 403; and
Erie Avenue between Veterans Memorial Parkway and Birke Lane.
City of Brantford
Transportation Master Plan Update – 2051 Addendum - FINAL
September 2021 – 17-650112 Figure 2-3: Future (2051) ‘Do Minimal’ Road Network City of Brantford Transportation Master Plan Update – 2051 Addendum - FINAL September 2021 – 17-6501
You can also read