TREND ANALYSIS FOR STRATEGIC PLANNING 2021 - TREND ANALYSIS FOR STRATEGIC PLANNING 2021 - Lake Land College
←
→
Page content transcription
If your browser does not render page correctly, please read the page content below
TREND        ANALYSIS
FOR STRATEGIC PLANNING 2021

TREND ANALYSIS FOR STRATEGIC PLANNING 2021
Author
M. Lynn Breer, Ph.D., Director of Institutional Research and Reporting

Acknowledgements
This report was made possible by the collaboration and support of members of the Strategic Planning Trend
Analysis Sub-Committee. These members conducted literature reviews and helped identify essential trends in
higher education. Faculty members across the college also provided key insight and research related to these
trends through their participation in Faculty Future Focus discussions. These discussions occurred at the
College between October 2020 and June 2021 and were facilitated by Lake Land College’s President, Dr. Josh
Bullock.

Strategic Planning Trend Analysis Sub-Committee Members
Jean Anne Grunloh, Chief of Staff
M. Lynn Breer, Director of Institutional Research and Reporting
Lisa Cole, Director of Data Analytics
Darci Cather, Dean of Guided Pathways
Ikemefuna Nwosu, Division Chair Math & Science/Bio-Science Instructor
Emily Hartke, Chair of Counseling and Judicial Affairs Advisement

Special Thank You
Dr. Josh Bullock
Faculty members participating in Future Focus Discussions

      TREND ANALYSIS FOR STRATEGIC PLANNING 2021
TABLE OF CONTENTS

                                                                                       Mass Layoffs ................................................ 11
PART I. INTRODUCTION………….……………...1
                                                                                       Jobs and Industries ..................................... 11
PART II. EXECUTIVE SUMMARY ...................... 2
                                                                                     PART IV. ECONOMIC/FINANCIAL FACTORS . 12
  DEMOGRAPHICS .......................................... 2
                                                                                       Decrease in Government Support of Higher
  Population ................................................................ 2
                                                                                       Education .................................................... 12
   Poverty & Diversity .................................................. 2            Individual Economic Uncertainty ................. 15
   Educational Attainment .......................................... 2                 Changing Attitudes about the Value of Higher
  ECONOMICS/FUNDING ................................ 2                                 Education .................................................... 15
  Decrease in Government Support for Higher                                            Declining Enrollment at Community
  Education .................................................................. 2       Colleges ...................................................... 17
   Individual Economic Uncertainty .......................... 2                      PART V. SOCIAL FACTORS ............................. 19
   Changing Attitudes about the Value of Higher                                        Mental Health & Social Isolation .................. 19
   Education .................................................................. 2      Diversity, Equity and Inclusion ..................... 20
   Declining Enrollment at Community Colleges ... 2                                    The Political Perspective .................................... 20
  SOCIAL FACTORS ......................................... 3                            The Educational Perspective ............................. 23
  Mental Health & Social Isolation ........................... 3                        Remedial Education ............................................. 25
   Diversity, Equity & Inclusion .................................. 3                PART VI. ACADEMICS & TECHNOLOGY ........ 26
  ACADEMICS & TECHNOLOGY ...................... 3                                      Students and Technology .................................. 26
  Students and Technology ...................................... 3                     Teaching Using Multiple Methods ............... 27
   Teaching with Multiple Methods and Blended                                          Growing Importance and Utility of Blended
   Learning .................................................................... 3     Learning ...................................................... 28
   Online Education ..................................................... 3            Online Education Growing Globally ............ 29
   Open Educational Resources (OERs) ................... 3                             Online Education during a Pandemic .......... 30
   Artificial Intelligence & Data Analytics ................. 4                        Open Educational Resources ....................... 32
   Alternative Credential Offerings ........................... 4                      AI & Data Analytics in Higher Education ...... 34
                                                                                       Artificial Intelligence (AI) in Education ............ 34
  WORKFORCE ................................................ 4
  Automation and the Workforce ............................ 4                           Data Analytics ........................................................ 35
   Decreasing Workforce ............................................ 4                 Alternative Credential Offerings .................. 36

   Science Technology Engineering and Math and                                       Part VII. WORKFORCE .................................... 38
   Healthcare Jobs ....................................................... 4           Automation and the Workforce ................... 38
  COLLABORATION ......................................... 4                            Decreasing Workforce ................................. 38
  Business & Industry ................................................. 4              Science Technology Engineering and Math
   Dual Credit ............................................................... 4       (STEM) and Healthcare Jobs ........................ 39

Part III.       DISTRICT DEMOGRAPHICS .............. 5                               PART VIII. COLLABORATION ......................... 41

  Population ..................................................... 5                   Business & Industry ..................................... 41

  In-District School Population.......................... 6                            Dual Credit ................................................. 42

  Income .......................................................... 8                PART IX. REFERENCES ................................... 45

  Educational Attainment ................................. 8
  Unemployment ............................................ 11

        TREND ANALYSIS FOR STRATEGIC PLANNING 2021                                                                                                   i
Part I.

INTRODUCTION
In 2021, Lake Land College began the process of planning for a new strategic plan for the College.
The College’s goal is to develop an innovative and adaptive strategic plan that addresses local,
state, and national trends in higher education as well as position Lake Land to meet the student and
workforce needs in a post-pandemic environment. To accomplish this, Lake Land is implementing a
process that is deliberately inclusive of its potential community stakeholders as well as internal
College personnel and students. This Trend Analysis Report is the first of three steps involved with
developing an Environmental Scan that will include the Trend Analysis Report, feedback from
community surveys of external and internal stakeholders, and feedback from in-depth focus groups.
Information from all three sources will be integrated into a comprehensive Environmental Scan that
will be used to identify the priorities, goals, and objectives of the College’s next strategic plan to
begin in FY 2023.

The Trend Analysis Report provides an overview of the demographics related to the district which
Lake Land College serves. In addition, it provides a summary of key research on a number of topics
impacting higher education at the state, national, and global levels categorized by
financial/economic, social, academics & technology, workforce, and collaboration factors.

                                                                          Note:
                                                                          Throughout the document
                                                                          you will see red underlined
                                                                          text. These are hyperlinks
                                                                          that will either take you to
                                                                          another location in the
                                                                          document or out to the
                                                                          reference used for the
                                                                          information.

  TREND ANALYSIS FOR STRATEGIC PLANNING 2021                                                             1
PART II.
EXECUTIVE SUMMARY
The following key takeaways highlight the prominent ideas and issues identified through the research
detailed in the body of the report. Each of the key takeaways is linked to the full section where the
research is presented.
                                                                   ♦   In the 2017-2018 academic year, community
                                                                       colleges enrolled nearly 41% of all
DEMOGRAPHICS                                                           undergraduates but only received 33% of Pell
Population                                                             Grant funds distributed.
   ♦ Illinois experienced the nation’s worst raw                   ♦ Illinois has cut higher education funding by half
        population decline from 2010-2019. The                         since fiscal year 2002. The original funding
        consistent decrease in the Illinois population over            formula for Illinois community colleges is one-third
        the last few years as well as the decrease in high             each from state, property taxes and tuition. The
        school enrollment significantly impacts enrollment             state is currently contributing only 16% of
        at community colleges. These declining                         community college funding.
        enrollments also create budgetary constraints for
                                                                   ♦ In 2020, Illinois’ community colleges served more
        the college as well as workforce challenges for
                                                                       Monetary Award Program (MAP) eligible students
        community businesses and industry.
                                                                       than all other higher education institutions
Poverty & Diversity
                                                                       combined, but only 11% of community college
   ♦ While the percentage of minorities in Lake Land’s                 students received a MAP grant. MAP is awarded
        district is very low (3.7%) compared to Illinois               on a first-come, first serve basis and is exhausted
        (23.2%) and the United States (23.7%), the                     before many community college students enroll in
        percent of low-income residents is higher. Around              college. More than 40% of MAP-eligible
        11.8% of Lake Land’s in-district residents live in             community college students are placed in
        poverty compared to the rest of Illinois at 11.5%              suspended status each year, meaning they are
        and the United States at 10.5%. The average                    qualified to receive MAP, but the funds have run
        household income is $53,444 compared to                        out.
        $65,886 in Illinois and $62,843 in the United          Individual Economic Uncertainty
        States. Our district has decreased the poverty rate
                                                                   ♦ Financial insecurity is a major concern for many
        by 2.9% since 2015.
                                                                       community college students and can play a major
Educational Attainment
                                                                       role in students’ inability to complete their higher
   ♦ Lake Land’s district shows a lower rate of residents              education goals. Many students live at or below
        with a Bachelor’s degree or higher with an average             the poverty level.
        of 17.7% compared to the 34.7% in Illinois and 32.1%   Changing Attitudes about the Value of Higher Education
        in the United States. However, Lake Land’s district
                                                                   ♦ Many Americans have significant concerns about
        has a higher percentage of persons with associate
                                                                       the cost of higher education and there is
        degrees (8.5%) compared to Illinois (5.5%) and the
                                                                       increasing public skepticism for the value of
        Nation (5.7%).
                                                                       higher education. This is despite the fact that
                                                                       median earnings for full-time employees are
ECONOMICS/FUNDING                                                      significantly higher for people attaining an
Decrease in Government Support for Higher Education                    associate’s degree or higher in comparison to
   ♦ Illinois has consistently decreased its support of                those with a high school diploma or less.
       higher education for the past two decades,                  ♦ Student loan debt is now the second highest
       resulting in shifting more of the financial burden              consumer debt category in the U.S., with about
       to students and families.                                       54% of college students needing to borrow
   ♦ Community colleges receive approximately                          money to attend college.
       $8,800 less funding per student enrolled than           Declining Enrollment at Community Colleges
       four-year institutions.                                     ♦ Nationally, community college enrollment has
                                                                       experienced a steady decline since 2016. Lake
                                                                       Land College has had a 27% decrease in annual
                                                                       student enrollment between 2009 and 2020.

      TREND ANALYSIS FOR STRATEGIC PLANNING 2021                                                                2
SOCIAL FACTORS                                                          students with steady access to technology and
Mental Health & Social Isolation                                        devices.
                                                                Teaching with Multiple Methods and Blended Learning
    ♦ The American College Health Association reports
         that 60% of college students suffer with anxiety           ♦ A 2019 national survey found 38% of college
         and 40% have depression. It is likely the social               students prefer completely face-to-face courses
         isolation required during the COVID-19 pandemic                and only 7% prefer completely online courses.
         may have intensified these issues. Traditional                 The remaining 55% prefer classes that blend face-
         aged college students, who range in age between                to-face with online elements. This blended
         17 and 24, fit into the vulnerable category in that            approach can provide learning advantages over
         half of mental health issues begin by age 14 and               fully online or fully traditional courses.
         75% begin by age 24 with higher rates of                   ♦ Technology integrated effectively into a course
         disorders in college-aged students, according to               can increase student satisfaction, grades,
         Active Minds.                                                  retention and completion as well as provide more
Diversity, Equity & Inclusion                                           flexibility for students.
    ♦ Illinois has established state-wide efforts to close          ♦ Hyflex courses offer students the flexibility to
         the equity gaps for higher education attainment                participate in class virtually, face-to-face, or in a
         among low-income, minority, first generation,                  combination of their choosing. This method can
         working adults and rural students. More than 40%               decrease barriers to enrollment and allow
         of the Lake Land’s students are classified as low-             students with health issues and/or family and work
         income, 35% are first generation and 36.8% are                 obligations to make progress on their educational
         non-traditional.                                               goals.
    ♦ When compared to their four-year university               Online Education
         peers, community college students are more likely          ♦ Since 2000, the online/virtual/remote/distance
         to work full-time, to enroll part-time, to be older,           learning industry has exploded for academia,
         to live in low-income households, and fail to pay              business and industry.
         on their student loans. In addition, community             ♦ Undergraduate enrollment in online courses
         college students are less likely to borrow money               increased from 15.6% in 2004 to 43.1% in 2016.
         for college and apply for financial aid than their         ♦ Since 2000, eLearning in business and industry
         four-year peers.                                               has increased 900% and 41.7% of Fortune 500
    ♦ From a national perspective on adult education,                   companies are using technology for training
         GED students are less likely to attend                         employees.
         postsecondary education compared to students               ♦ Faculty perceptions of online learning are shifting.
         who receive a high school diploma, with 43% of                 Around 57% of faculty are more receptive to
         students who complete a GED attending                          digital learning materials, and 51% are more
         postsecondary education compared to 73% of                     receptive to online learning than they were before
         students who receive a high school diploma                     the COVID-19 pandemic.
         attending postsecondary education. Only 5% with            ♦ During the pandemic, 71% of faculty reported
         a GED will earn a bachelor’s degree compared to                changing their teaching techniques significantly,
         33% with a high school diploma.                                and all but 8% will likely keep these changes.
Remedial Education                                                  ♦ Even with the demand for more online education,
    ♦ In Illinois, nearly one-half of new high school                   a Pew Research Center 2020 student survey
         graduates assess into developmental education                  conducted during the pandemic revealed a
         courses. At Lake Land 73.2% of incoming students               majority of students continue to prefer face-to-
         assess into developmental math education and 44%               face classes over other learning environments.
         assess into developmental reading and/or English.          ♦ Institutions must promote academic integrity
                                                                        through policies and practices when transitioning
                                                                        to an online environment. Best practices,
ACADEMICS & TECHNOLOGY                                                  strategies and software programs can be utilized
Students and Technology                                                 to minimize academic misconduct.
    ♦ Technology (i.e., devices, Internet, etc.) has            Open Educational Resources (OERs)
       become an essential element in higher education,             ♦ Open educational resources (OERs) are cost
       yet many students have problems accessing                        effective options for students that allow access to
       reliable and updated technology and devices,                     the content anywhere with Internet availability,
       which is a bigger issue for low-income and                       and have been shown to increase credit hour
       minority students. Students with technology issues               accumulation and retention of students. OERs
       are more likely to have poorer outcomes than                     must be checked for validity and language.

      TREND ANALYSIS FOR STRATEGIC PLANNING 2021                                                                  3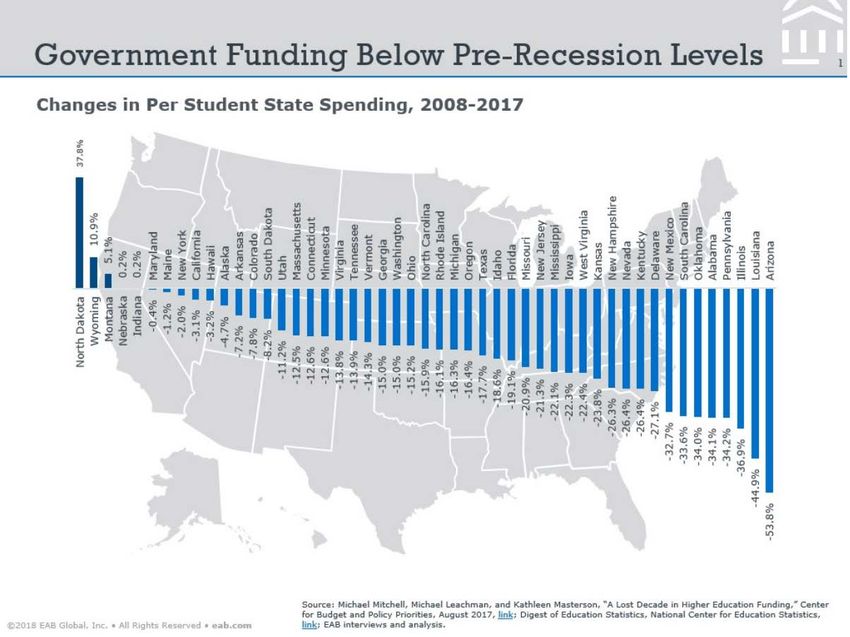
Artificial Intelligence & Data Analytics
     ♦ Artificial intelligence and data analytics can be        COLLABORATION
          used in multiple ways to benefit both students
                                                                Business & Industry
          and institutions. Instructors can use AI to
                                                                    ♦ Workers in industries across the board require
          personalize learning experiences. Institutions can
                                                                       technical savvy to be successful. While community
          use AI and data analytics to improve
                                                                       colleges can meet students in their communities
          communication with students as well as student
                                                                       and provide them with career and technical
          success measures.
                                                                       education opportunities, providing students with
Alternative Credential Offerings
                                                                       the education that aligns directly with work based
     ♦ The interest and need from employers and
                                                                       learning opportunities continues to be a struggle.
          students for additional skills have opened the
                                                                       It is essential to develop, maintain, and expand
          door to expanding alternative and stackable
                                                                       collaboration among K-12, community colleges,
          credentials offerings. These credentials have the
                                                                       and business and industry in order to provide
          benefit of being cost-effective, short-term,
                                                                       students with opportunities for apprenticeships
          flexible, and promote lifelong learning. They also
                                                                       and work based learning.
          provide opportunities to gain new skills and/or a
                                                                    ♦ Apprenticeships or earn and learn programs
          full degree.
                                                                       benefit both employers and students or workers.
                                                                       These programs allow students/workers to train
WORKFORCE                                                              on the job, be paid, and learn the skills that
Automation and the Workforce                                           employers need. They provide a hiring pipeline
    ♦ As automation and technology develop in                          for business and industry.
        business and industry, workers with little or no            ♦ Students participating in paid work based learning
        advanced education beyond high school                          opportunities are more likely than students with
        diplomas may find themselves in need of                        unpaid work based learning experiences to
        additional education, training, or skills to keep              receive job offers across employer types. In
        their jobs, to complete non-automated tasks or to              addition, they are more likely to receive higher
        move into new positions. Alternative credentials               starting salaries than those that participated in
        can help fill the skills gaps for business and                 unpaid opportunities.
        industry.                                               Dual Credit
Decreasing Workforce                                                ♦ According to the US Department of Education,
    ♦ In spring 2020, almost 70% of US employers                       between the academic years of 2002-03 and
        reported difficulties in hiring qualified employees,           2010-11, the number of high school students
        a 17% increase from 2018. January and February                 taking dual credit courses increased by 68% for a
        of 2021 both saw increases in job openings of                  total of nearly 1.4 million students. Almost 70% of
        5.1% and 3.8%, respectively, yet there are still               high schools provided dual credit opportunities to
        more job openings than unemployed workers.                     their students by 2015.
    ♦ The US labor force participation rate (LFPR)                  ♦ Dual credit students are more likely than non-dual
        measures the number of people employed or                      credit students to enroll in college, complete a
        actively seeking work. According to Hetrick et al.             college credential/degree and finish a degree in
        (2021), this rate has decreased to a low not seen              less time.
        since the mid-1970s.                                        ♦ Dual credit enrollees were more likely than their
Science Technology Engineering and Math and Healthcare                 non-dual credit peers to graduate from high
Jobs                                                                   school, enroll in a four-year college, persist in
    ♦ Increasing automation in occupations leads to                    college, accumulate more college credit and were
        higher salaries; however, these higher salaries can            less likely to take remedial courses.
        only be acquired with essential education and               ♦ Dual credit programs can differ widely in eligibility
        skills. Short-term training and in-plant training can          requirements, affordability, and student support,
        provide employees with these skills. It has been               which can create barriers for minority and low-
        estimated that 65% of jobs in 2020 required                    income students.
        education beyond high school and only 41.7% of
        Americans have an associate degree or higher.

      TREND ANALYSIS FOR STRATEGIC PLANNING 2021                                                                 4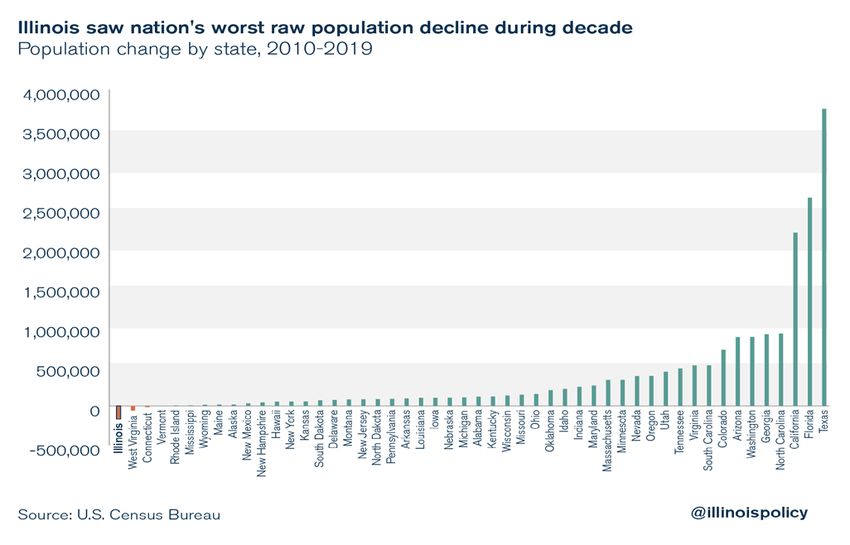
Part III.     DISTRICT DEMOGRAPHICS
Lake Land College serves a 4,000 square mile district encompassing two complete counties (Effingham and
Cumberland), the vast majority of Moultrie, Coles, Clark, and Shelby Counties, at least half of Edgar and
Fayette Counties, and small sections of Christian, Montgomery, Clay, Jasper, Crawford and Douglas counties.
Since an extremely small section of Macon County is included in Lake Land’s district, Macon County
information is excluded from the report.

Population
Between 2010 and 2019, Illinois experienced the largest raw population decline in the nation, and Illinois
experienced a seventh straight year of population decline in 2020—the most in state history since World War
II. In fact, Illinois has lost over 253,000 residents in the last decade. The largest group of movers are prime
working age individuals seeking better jobs and housing opportunities in other states, which impacts the
economy in Illinois.

Between 1950 and 2020 the total population for the counties within Lake Land’s district has decreased by
around 4,300 people. Since the district’s high point in population in 1980, the district’s county population has
decreased by 18,944 people. Almost two-thirds of this exodus (11,716) have left the district over the past 10
years. Table 1 provides a summary of the Census population by county in Lake Land College’s district between
1950 and 2020.

      TREND ANALYSIS FOR STRATEGIC PLANNING 2021                                                       5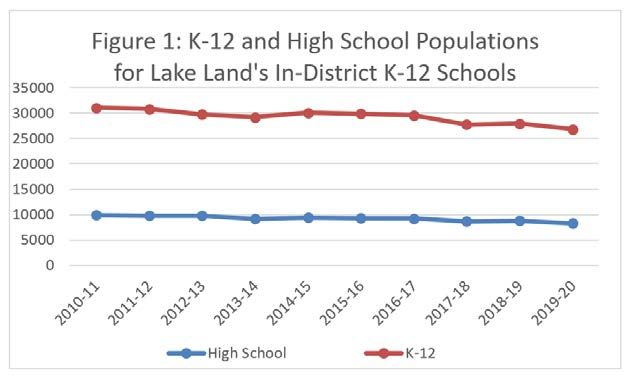
Table 1: Lake Land College District County Populations Based on Census Data 1950 to 2020
                                        Based on Census Quick Facts
                                                             Census Year
        County
                       1950       1960        1970        1980          1990      2000      2010    2020
    Christian        38,816      37,207     35,948       36,446        34,418    35,372    34,800  34,032
    Clark            17,362      16,546     16,216       16,913        15,921    17,008    16,335  15,455
    Clay             17,445      15,815     14,735       15,283        14,460    14,560    13,815  13,288
    Coles            40,328      42,860     47,815       52,260        51,644    53,196    53,873  46,863
    Crawford         21,137      20,751     19,824       20,818        19,464    20,452    19,817  18,679
    Cumberland       10,496       9,936      9,772       11,062        10,670    11,253    11,048  10,450
    Douglas          16,706      19,243     18,997       19,774        19,464    19,922    19,980  19,740
    Edgar            23,407      22,550     21,591       21,725        19,595    19,704    18,576  16,866
    Effingham        21,675      23,107     24,608       30,944        31,704    34,264    34,242  34,668
    Fayette          24,582      21,946     20,752       22,167        20,893    21,802    22,140  21,488
    Jasper           12,266      11,346     10,741       11,318        10,609    10,117     9,698  14,588
    Montgomery       32,460      31,244     30,260       31,686        30,728    30,652    30,104  28,288
    Moultrie         13,171      13,635     13,263       14,546        13,930    14,287    14,846  14,526
    Shelby           24,434      23,404     22,589       23,923        22,261    22,893    22,363  20,990
                     314,28      309,59     307,11       328,86        315,76 325,48       321,63 309,921
    Total                5          0           1            5            1     2             7
    https://www.dph.illinois.gov/data-statistics/vital-statistics/illinois-population-data
    *https://www.census.gov/quickfacts/fact/table/US/PST045216

In-District School Population
Lake Land College’s district encompasses all or parts of 31 public school districts. Over the years, the district
has seen a gradual decline in the population of school age children. During the 2019-2020 school year, these
school districts had a total of 26,816 students enrolled in their K-12 classes compared to 31,068 students
enrolled in K-12 during the 2010-2011 school year. This is an overall decrease of 4,252 students in the K-12
system over the past 10 years. Furthermore, the high school population (i.e., grades 9 to 12) during this same
time frame has also decreased from 9,901 in 2010-2011 to 8,298 in 2019-2020, a decrease of 1,600 students.
Figure 1 provides a graphic depiction of the slow and steady decline of the College district’s K-12 population
over the years. Figure 2 provides a forward look at the number of potential annual high school graduates from
2022 to 2031. This number is based on current enrollment numbers of in-district K-12 schools.

      TREND ANALYSIS FOR STRATEGIC PLANNING 2021                                                        6
Percent of Population in Poverty

The percent of the population in poverty for Illinois ranged between a low of 11.5% and a high of 14.4%
between 2011 and 2019, with an average of 13.3% living in poverty during this time frame. Since 2011 seven
of the counties within Lake Land’s district had consistently lower poverty levels than the state. The remaining
seven counties had higher percentages of their population in poverty than the state. These seven counties had
an average of 14.3% of their population living in poverty in 2019.

                     Percent of Population in Poverty over Time for Lake Land's In-District Counties
                                      2019        2018      2016      2015      2013       2012        2011
          Illinois                    11.5        12.6      13.6      14.4       14.1      13.7        13.1
          Christian                   12.3        13.6      12.7      14.4       14.9      15.9        15.8
          Clark                       10.8         11       13.8      13.9       12.3      11.5        10.2
          Clay                        13.8        13.2      14.5      13.6       15.6      14.9        16.9
          Coles                       16.8        19.5      21.8      22.9        22        22         22.1
          Crawford                    12.6        13.8      13.4      15.2       14.4       15         16.4
          Cumberland                  10.1        10.3       12       12.2       13.9      13.4        13.1
          Douglas                      8.0         9.8      10.2       10        10.3      10.1        10.2
          Edgar                       13.2        13.8      13.9      15.1       18.4      15.7        14.9
          Effingham                    9.2         9.7       9.8      11.8       9.1        9.7        10.7
          Fayette                     15.1        18.2      18.5      17.5        17       18.3        16.8
          Jasper                       9.9        11.9       12        11        6.6        7.5        7.6
          Montgomery                  16.0        15.5      16.6       17        14.1      14.2        14.6
          Moultrie                     8.6         9         8.6      11.8       12.8      10.7        10.5
          Shelby                       9.4        10.3      11.6      11.7       11.8      10.1        10.5
          Average                     11.8        12.8      13.5      14.2       13.8      13.5        13.6
          https://www.census.gov/quickfacts/fact/table/US/PST045219?

     TREND ANALYSIS FOR STRATEGIC PLANNING 2021                                                               7
Income
The median household income for Illinois ranged from $56,576 to $65,886 between 2011 and 2019. During
this same time period, the average median household income for the counties within Lake Land’s district
ranged between $44,698 in 2011 to $53,043 in 2019. These data indicate that in general, households within
Lake Land’s district earn significantly less than households across Illinois. In fact, households within Lake Land’s
district earned an average of $12,843 less than households in Illinois for this time span. This trend shows no
indication of reversing, and in fact, the gap between median salary in Illinois and median salary in Lake Land’s
district is getting wider. In 2011, this gap was $11,878 and it increased to $12,843 by 2019.
Educational Attainment
Based on data between 2015-2019 collected by the U.S. Census, Illinois has a higher percentage of individuals
25 and older who have at least a bachelor’s degree than the nation (34.7% IL compared to 32.1% US in 2019).
Even though the percent of Illinois residents (34.7%) with at least a bachelor’s degree is higher than the nation,
the educational attainment of Lake Land College district residents is much lower than the nation and Illinois. Of
the fourteen counties in Lake Land’s district only two counties within Lake Land’s district exceed 22% of their
population attaining a bachelor’s degree or higher. In 2019, 26.0% of Coles County and 22.7% of Effingham
County residents had a bachelor’s degree or higher. Even though one of these counties has a four-year
university within its boundaries, it still has a much lower percent of residents with four-year degrees than the
nation and Illinois overall. The remaining counties have even lower percentages of residents with a bachelor’s
degree or higher education attainment. Their percentages range from 11.3% to 19.9% for 2019. On average,
the 14 counties within Lake Land’s district only have about 17.8% of their residents with at least a four-year
degree, which is almost half of the statistic for Illinois residents (34.7%). However, the percent of persons with
an associate degree in Lake Land’s district are at the same level or higher than Illinois or the nation in 2010,
2015, and 2019. In 2019, an average of 8.5% of the population across Lake Land’s district had an associate
degree.
TREND ANALYSIS FOR STRATEGIC PLANNING 2021 8Education Attainment by Percent of County Population in LLC District for Population 25 Years
and Over
2019 2015 2010
High High High
School Associate Bachelors School Associate Bachelors School Associate Bachelors
or Degree or Higher or Degree or Higher or Degree or Higher
More More More
United
88.0% 5.7% 32.1% 86.3% 5.3% 29.3% 85.0% 4.9% 27.9%
States
Illinois 89.2% 5.5% 34.7% 87.6% 5.1% 31.9% 86.2% 4.7% 30.3%
Christian 89.7% 6.9% 17.1% 88.2% 5.9% 13.9% 85.8% 4.9% 12.1%
Clark 92.8% 10.0% 19.9% 89.7% 7.9% 18.4% 88.0% 7.7% 16.4%
Clay 88.0% 8.3% 15.0% 87.3% 8.2% 13.5% 86.2% 7.3% 13.8%
Coles 91.4% 7.0% 26.0% 89.5% 6.5% 24.0% 89.3% 4.7% 23.3%
Crawford 85.0% 12.5% 17.1% 89.0% 10.5% 17.7% 86.5% 9.0% 13.5%
Cumberland 90.6% 10.3% 15.4% 87.7% 9.2% 13.9% 88.1% 7.4% 13.0%
Douglas 83.2% 6.0% 18.9% 83.7% 5.4% 17.1% 81.7% 4.2% 14.9%
Edgar 90.1% 9.1% 17.2% 86.9% 7.0% 16.9% 88.4% 5.9% 16.8%
Effingham 93.1% 9.6% 22.7% 91.3% 8.9% 20.2% 89.4% 8.2% 20.0%
Fayette 83.8% 7.1% 11.3% 84.0% 6.1% 13.4% 82.9% 5.4% 14.3%
Jasper 89.8% 10.5% 16.6% 90.8% 9.9% 18.4% 88.2% 9.4% 13.0%
Montgomery 87.7% 7.0% 16.7% 85.3% 6.3% 12.7% 83.5% 5.1% 13.3%
Moultrie 84.7% 7.0% 18.6% 84.6% 6.5% 15.5% 83.8% 6.5% 13.8%
Shelby 92.3% 7.5% 16.8% 90.3% 7.5% 14.3% 87.7% 7.1% 14.7%
https://www.census.gov/quickfacts/fact/table/US/PST045219
https://www.census.gov/acs/www/data/data-tables-and-tools/data-profiles/
Age and Diversity
According to the U.S. Census, currently 5.9% of Illinoisans are five years and younger, 16.3% are between 6
and 17, 16.1% are 65 years of age and older. This means around 61.7% of the residents of Illinois are of
working age (fall between the ages of 18 and 64). The age breakdowns of Illinoisans closely resembles the age
breakdown of Lake Land’s district with a slight change. On average, the age of Lake Land district’s residents
are as follows: 5.8% are children five years and under, 16% are between 6 and 17, and 20.0% are 65 and older,
which means around 58.3% fall between 18 and 64.
TREND ANALYSIS FOR STRATEGIC PLANNING 2021 9Number and Percent of County Population by Age Group 2019
2019 Population Breakdown by Age Group
0-5 6 to 17 18 to 64 65 and up
Pop
n % n % n % n %
Christian 32,304 1,648 5.1% 4,845 15.0% 19,286 59.7% 6,525 20.2%
Clark 15,441 880 5.7% 2,563 16.6% 8,879 57.5% 3,119 20.2%
Clay 13,184 791 6.0% 2,189 16.6% 7,462 56.6% 2,742 20.8%
Coles 50,621 2,430 4.8% 6,631 13.1% 32,701 64.6% 8,859 17.5%
Crawford 18,667 1,008 5.4% 2,688 14.4% 11,350 60.8% 3,621 19.4%
Cumberland 10,766 624 5.8% 1,766 16.4% 6,180 57.4% 2,196 20.4%
Douglas 19,465 1,285 6.6% 3,523 18.1% 11,095 57.0% 3,562 18.3%
Edgar 17,161 892 5.2% 2,574 15.0% 9,833 57.3% 3,861 22.5%
Effingham 34,008 2,313 6.8% 5,815 17.1% 19,793 58.2% 6,087 17.9%
Fayette 21,336 1,237 5.8% 3,200 15.0% 12,759 59.8% 4,139 19.4%
Jasper 9,610 605 6.3% 1,624 16.9% 5,478 57.0% 1,903 19.8%
Montgomery 28,414 1,478 5.2% 4,234 14.9% 16,850 59.3% 5,853 20.6%
Moultrie 14,501 928 6.4% 2,741 18.9% 8,019 55.3% 2,813 19.4%
Shelby 21,634 1,190 5.5% 3,375 15.6% 12,050 55.7% 5,019 23.2%
Averaged % 5.8% 16.0% 58.3% 20.0%
https://www.census.gov/quickfacts/fact/table/US/PST045219?
Lake Land’s district has very little diversity when it comes to race. On average, about 96% of its population is
white alone. This is very different from the state of Illinois, which is 60.8% white alone not Hispanic, 14.6%
black or African American alone, and 17.5% Hispanic/Latino, 5.9% Asian, and 2.1% two or more races.
TREND ANALYSIS FOR STRATEGIC PLANNING 2021 10Unemployment
Between 2015 and 2020, the unemployment rates by Lake Land’s in-district counties ranged between a low of
3.3% to a high of 7.7%. Even with the impact of the COVID-19 pandemic in 2020, the average unemployment
rate for Lake Land’s district was 5.4%, which is still lower than the largest average rate (6.6%) in 2015. The
national unemployment rate for January of 2021 was 6.3%, which was almost 3% higher than the pre-
pandemic unemployment rate of February 2020 (3.5%). The counties with the highest unemployment rate for
2020 within Lake Land’s district included Montgomery (5.9%), Clay (5.8%), and Coles (5.4%).
Mass Layoffs
According to Illinois Work Net Center, there were several permanent mass layoff events from businesses and
industry within Lake Land College’s district since 2015. In 2020 alone, Lake Land College’s district lost 1,501
jobs due to two manufacturing plant closures and one layoff event. In 2019, 50 jobs were permanently
eliminated due to a business closure, and in 2018, another 413 jobs were lost within the district. In 2017 an
additional 51 jobs were eliminated, and another 121 jobs were eradicated in 2015. There were no reported
mass layoff events resulting in permanent job losses in 2016. Between 2015 and 2020, Lake Land’s District lost
a total of 2,136 jobs due to mass layoff events.
Jobs and Industries
According to the Illinois Department of Commerce and Economic Opportunity, in 2020, Local Workforce
Innovation Area 23 (LWIA 1) had a total estimated number of 10,373 businesses in 11 of the counties that fall
within the College’s district. The most common industry groups in this area included other services (4,102),
retail trade (1,601), agriculture/forestry/fishing (1,270), construction (799), finance/insurance/real estate (775),
transportation/communications and utilities (576), and manufacturing (411). According to the Illinois WorkNet
Center, in 2016, the total estimated number of employees across all occupation groups for LWIA 23 was
123,902 and the projected number for 2026 is 130,008, which is a projected increase of 6,186 (5% increase)
workers over ten years. The largest projected occupation groups for LWIA 23 between 2016 and 2026 include
manufacturing, health care and social assistance, retail trade, educational services, leisure and hospitality,
professional and business services, agricultural production, government, and transportation and warehousing
occupations.
1
LWIA 23 includes the following counties in Lake Land’s district Clark, Clay, Coles, Crawford, Cumberland, Douglas, Edgar, Effingham, Fayette,
Jasper, and Moultrie. It also includes Lawrence, Marion and Richland counties. It does not include the remaining four counties in Lake Land’s district:
Christian, Macon, Montgomery, and Shelby.
TREND ANALYSIS FOR STRATEGIC PLANNING 2021 11PART IV. ECONOMIC/FINANCIAL FACTORS
Decrease in Government Support of Higher Education
For many years, there has been a sustained decrease in government funding to support community colleges,
thus increasing the financial burden on students and their families. Community colleges provide an affordable
alternative to four-year universities and important pathways to four-year degrees, careers and vocational
training. Despite this vital role in American higher education, community colleges receive $8,800 less in
education revenue per student enrolled than four-year institutions, according to an analysis from the Center for
American Progress. Yet, data available at the National Center for Education Statistics shows Pell Grants
covered more of the total price of attendance for students at public two-year institutions compared to public
four-year institutions, private nonprofit four-year institutions, and private for-profit institutions in all selected
academic years between 2003–04 and 2015–16.
According to a Data Points posting by the American Association of Community Colleges (AACC), in the 2017-
18 academic year community colleges received 33% of all distributed Pell Grant funds even though they
enrolled nearly 41% of all undergraduates. Furthermore, students at community colleges received a smaller
share of other federal Title IV funds relative to their share of enrollment. AACC reports that community
colleges enroll an even higher percentage of low-income students (46% of students in the bottom income
quartile) than the rest of higher education. Thus, AACC’s legislative agenda includes numerous funding policy
recommendations such as:
• Preserve and enhance the Federal Pell Grant program, which is the foundation of student aid for
millions of financially needy college students.
• Extend Pell Grant eligibility to short-term training programs offered by institutions of higher education.
• Increase the maximum Pell Grant annually to maintain its purchasing power.
• Support federal investments in higher education by providing sufficient funding allocations for
domestic discretionary programs.
• Support the Federal Supplemental Educational Opportunity Grant (FSEOG) and Federal Work-Study
programs, which enhance community college student enrollment and success.
From an article Recognizing the Reality of Working College Students, published in an American Association of
University Professors Winter 2020 report, the cost of college attendance has been rising faster than family
incomes, and increases in federal, state, and institutional grants have been insufficient to meet all students’
demonstrated financial needs. According to Perna & Odle (2020), between 2008–09 and 2017–18 academic
years, average tuition and fees increased in constant dollars by 36% at public four-year institutions and 34% at
public two-year institutions, while median family income rose by only 8%.
In a 2019 report, the Century Foundation, a nonpartisan progressive think tank, recommended that to spur
student success, state and federal policy makers should begin increasing funding for community colleges in
the short term and better research to estimate the financial needs of two-year institutions. A group of more
than 20 education experts found that community colleges are deeply underfunded even as they are more
likely to enroll socioeconomically disadvantaged students than four-year institutions. The report states, "The
lower levels of spending in community colleges -- coupled with the greater needs, on average, in community
college student bodies -- is important because research suggests that greater resources are connected to
better outcomes for students in higher education.”
According to Mitchell, Leachman, & Masterson (2017), overall state funding for public two-year and four-year
colleges has decreased by more than $7 billion in the ten year period between 2008 and 2018 (See Figure 3
below for a state by state comparison). Illinois has been a strong participant in this phenomenon. According to
the Illinois Board of Higher Education (IBHE) and the Illinois Community College Board (ICCB), Illinois has cut
TREND ANALYSIS FOR STRATEGIC PLANNING 2021 12higher education funding by half since fiscal year 2002. Additionally, the state is providing about 16% of
community college funding, with property taxes and tuition making up 42% each – a drastic change from the
state’s original funding model for community colleges that was to be one-third for each of these three sources.
The impact of this lack of investment has forced Illinois colleges and universities to shift the burden to its
students. The average in-state tuition costs for public four-year colleges and universities has increased 136.3%
(adjusted for inflation) between FY 2000 and FY 2017. According to the Illinois Community College Board, the
average tuition and fee costs for community colleges in Illinois has increased 163.9% (not adjusted for inflation)
between FY 2000 and FY 2018. With state appropriations less than they were two decades ago and with the
rising cost of tuition at public colleges and universities, the hardest hit students of this snowball effect are low-
income and minority students.
Link
Illinois appropriations for higher education in FY 2020 remained almost 50% less than it was in FY 2002 after
adjusting for inflation despite the fact that higher education can positively impact both individuals and
communities economically. It is clear that higher education enhances an individual’s employability as well as
their earning potential. During the recession of 2010, having a bachelor’s degree decreased an individual’s risk
of unemployment. In fact, the unemployment rate for college graduates was 6.9% compared to 15.8% for all
young workers, and the poverty rate for college graduates was 3.5 times lower than for those with high school
diplomas. Education also impacts an individual’s earning potential. Over a lifetime, a bachelor degree holder
can make an average of $1 million in additional earnings compared to individuals with only a high school
diploma while an associate degree holder can earn approximately $420,000 more over a lifetime than
someone without a degree.
TREND ANALYSIS FOR STRATEGIC PLANNING 2021 13Despite the evidence that an educated workforce benefits communities, Illinois continues to underfund higher
education, especially its community colleges. While Illinois’ low-income and students of color are more likely to
attend community college, Illinois community colleges receive a fraction of per student funding received by
Illinois four-year universities. In fact, in FY 2020 Illinois community colleges needed about $900 million from
the state, but received only $250 million in funding. Furthermore, public four-year colleges per student funding
increased by 16% between the 2003-2004 and 2013-2014 academic year, however, the per student increase
for community colleges during the same time period increased only 4%. Disadvantaged students with the
greatest educational needs outnumber students from the wealthiest quartile by two to one at community
colleges. On the other hand, selective four-year colleges are much more likely to enroll students from the
highest socioeconomic quartile rather than the lowest quartile. In other words, selective four-year universities
only enroll one disadvantaged student for every fourteen students from wealthy families.
Evidence suggests a correlation between higher state per-pupil funding for community colleges and improved
academic outcomes for disadvantaged students. States that spend more money on community colleges (i.e.,
Wyoming, Alaska, and North Dakota) have higher than average completion rates. Deming and Walters (2017)
found a significant relationship between spending and degree attainment, and these relationships were
stronger for community colleges than four-year institutions. They found increasing spending results in an
increase of 14.5% in certificates and degrees awarded in the next year and an increase of 14.6% of degrees
and certificates awarded in the following year (year 3).
Despite this evidence, policies for two Illinois programs further widen the funding opportunities gap between
community college and university students. The Aim High Pilot Grant Program, launched with the 2019-20
award year, provides assistance toward a full-time undergraduate student’s cost of attendance at one of the
state’s 12 public universities, with community colleges being left out of the program. The state’s Monetary
Award Program (MAP) provides grant assistance to eligible Illinois residents who attend approved Illinois
colleges and demonstrate financial need. In 2020, Illinois community colleges served more MAP-eligible
students than all other higher education institutions combined (151,256 vs 141,143 applicants). However, only
11% of community college students received a MAP grant. This may be due, in part, to the fact that MAP
funds are awarded on a first-come, first-serve basis. As a result, MAP funds are often exhausted in a given fiscal
year by the time many community college students decide to enroll. In fact, more than 40% of MAP-eligible
community college students are placed in suspense each year, meaning they meet eligibility criteria but the
funds have already been exhausted in a given academic award year. In a September 2020 report, Mr. Eric
Zarnikow, Illinois Student Assistance Commission (ISAC) Executive Director, states that since 2002 there has
been more demand for MAP assistance than what ISAC has been able to award. Additionally, short-term
community college certificate and training programs of less than 16 credit hours focused on workforce
development and readiness have not yet been approved for usage of MAP funds.
The Illinois Council of Community College Trustees and the Illinois Council of Community College Presidents
have included on their legislative agendas for years the need for a portion of new money allocated to MAP to
be earmarked for community college students and to increase the amount of MAP grant funding. Based on
local data, the average MAP grant a Lake Land College student received in award year 2002-2003 covered
66.5% of the total full-time tuition and fees costs. By the 2019-2020 award year, this fell to 27.7%. This
significant decline in MAP’s purchasing power is also reflected in the statewide ISAC report, covering only
about 36% of the total tuition and fees costs when considering all Illinois community colleges.
The overall decline in higher education funding support by the federal and state governments has
undoubtedly placed greater financial burdens on community college students and/or led to more students not
being able to access higher education. Funds issued to colleges under the Higher Education Emergency Relief
Funds (HEERF) have provided temporary institutional and student support from the pandemic fall-out but will
not address the long-term needs for student affordability and access to higher education. Moreover, the
economic and political pressures on Illinois’ community colleges will likely remain for years to come in light of
the ongoing state budget issues, population loss, and many college students choosing to attend out of state
TREND ANALYSIS FOR STRATEGIC PLANNING 2021 14institutions. However, federal policies may change in the coming years given national conversations about the
potential for free community college for students. Examples are economic proposals by the Biden
Administration, such as the American Rescue Plan, that if passed would provide for community colleges funds
for technology and infrastructure updates, expanded opportunities for workforce development and two years
of free community college tuition.
Individual Economic Uncertainty
Financial insecurity is a major concern for many community college students and plays a major role in students’
inability to complete their higher education goals. A national survey conducted early in the pandemic showed
four in ten community college students were affected by food insecurity and 11% experienced homelessness.
Local data collected prior to the pandemic supports this national trend. A fall 2019 survey conducted with 557
students by Lake Land’s PTK Chapter revealed that 73.8% of respondents reported experiencing financial
struggles in their day-to-day life to pay for basic needs such as gas, food, and bills, and 72.8% of respondents
reported having to work at least 11 or more hours per week.
According to a report from the Center for Community College Student Engagement (CCCSE), 47% of
community college students completing a national survey reported that a lack of finances is an issue that could
cause them to withdraw from college. Many community college students live at or below the poverty level
forcing them to struggle to meet basic needs such as housing and food much less higher education. While
39% of these students receive PELL grants, PELL grants only meet part of their financial need. Since nearly
61% of Pell grant recipients live below the poverty line, it is no surprise that 40% of these students have to pair
Pell grants with student loans to make ends meet. Research shows that 30% of students do not complete the
forms that would make them eligible for financial aid including PELL grants. While some of these students
indicated they do not need aid, others may benefit from financial assistance and with assistance completing
the forms.
Key findings from the 2017 CCCSE survey conducted with 100,000 community college students from 177
institutions include the following points:
• Many students find themselves living paycheck to paycheck. In fact, 63% without children live paycheck
to paycheck, while 74% with children live paycheck to paycheck.
• Many students do not have access to an emergency fund if an unexpected expense arose. In fact, 18%
reported having access to $0, and only 39% could access $500 at most.
• Students who receive a Pell grant are more likely to set their goal for an associate degree over a
bachelor’s degree.
• The vast majority of respondents (90%) indicated they need information about financial assistance, and
27% of those students did not receive adequate financial information from their college.
• While 77% of students indicated they have the knowledge and skills to manage their own finances,
49% of these students reported running out of money one or more times in the past 12 months.
• Less than half of the students (45%) report no difficulties with paying their bills. However, 3% report
they are falling behind, 10% report a constant struggle, and 41% report it is a struggle from time to
time.
Changing Attitudes about the Value of Higher Education
According to the Georgetown Center on Education and Workforce, 65% of American jobs in 2020 required
education beyond high school. In fact, three of the fastest-growing occupations –STEM, healthcare
professional, and community services— also have the highest demand for postsecondary education and
training. Given the estimate of 65% of jobs needing higher education and the fact that the US Census
TREND ANALYSIS FOR STRATEGIC PLANNING 2021 15estimates that only 41.7% of Americans have an associate degree or higher, more Americans need to receive
additional education or training to be competitive in the workforce.
Over the years, the cost of a higher education has exceeded the rate of inflation. Between 2006 and 2017 the
Consumer Price Index (CPI) for a higher education (tuition and fees only) has increased by 63% compared to
21% for all other items, such as food, energy, and housing. During this same time period, the cost of textbooks
and college housing has increased 88% and 51% respectively.
Americans have significant concerns about the cost of higher education. In fact, according to one survey, 40%
of Americans believe college degrees are not a good investment for most high school students due to the
debt they will likely incur along with the struggle to find a good paying job. However, other surveys conducted
found that most Americans (85%) strongly or somewhat agree that it is easier to get a good job with a college
degree or trade certificate than without one. In fact, 89% of Americans agreed that students should pursue
career or technical training or a two- or four-year college degree after high school. Furthermore, 52% of
Americans are satisfied (44% somewhat) with the job that four-year colleges are doing and 63% are satisfied
(51% somewhat) with the job that community colleges are doing. For those Americans dissatisfied with higher
education, 55% indicated their dissatisfaction was due to the high cost of higher education and 43% reported
colleges do not provide students with useful real world skills.
A 2019 report posted with the Pew Research Center highlights an undercurrent of dissatisfaction among the
public about the role colleges play in society and skepticism that today’s colleges are adequately preparing
people for the workforce. Based upon analysis of numerous surveys of US adults since 2012 the report states:
• Only 16% say a four-year degree from a college or university prepares someone very well for a well-
paying job in today’s economy, while 51% say it prepares them somewhat well. For community
colleges, only 12% say a two-year degree prepares someone very well for a job while 46% say it
prepares them somewhat well.
• Between 2015 and 2018, the share of Americans saying they had a great deal or quite a lot of
confidence in higher education dropped from 57% to 48%.
• From a 2019 survey, the portion of Americans indicating colleges and universities have a negative
effect on the way things are going in the country has increased by 12 percentage points since 2012.
Only half of American adults think colleges and universities are having a positive effect, while 38%
report they are having a negative impact – up from 26% in 2012.
• Despite the public’s increasingly negative views about higher education and its role in society, most
Americans say a college education is important – if not essential – in helping a young person succeed
in the world today. A 2018 survey found that 31% of adults say a college education is essential, and an
additional 60% say it is important but not essential. However, far higher shares say a good work ethic
(89%), the ability to get along with people (85%), and work skills learned on the job (75%) are essential
for a young person to succeed.
Public skepticism for the value of higher education is evident in our own College district. According to National
Student Clearinghouse data and the College’s Office of Institutional Research, the percentage of in-district
high school students choosing to forego a college education right out of high school increased steadily from
35% in 2017, 42% in 2018, 46% in 2019, and 49% in 2020. This data is based upon the total number of in-
district high school juniors expected to graduate in the following reported year. Thus, we are challenged to
help more district residents understand the lifetime value provided by higher education attainment. For
example, according to the AACC, based on educational attainment, the median earnings for full-time
employees include $26,200 for less than a high school diploma, $36,000 for a high school diploma, $42,600
for an associate degree and $60,100 for a bachelor’s degree. This advantage was revealed even further with
the 2020 pandemic. In a 2020 Forbes article, Michael T. Nietzel highlighted the relationship between various
levels of education and unemployment before and during the pandemic. Based upon data from the Bureau of
Labor, Nietzel identified a consistent link between education and employment before and during the
TREND ANALYSIS FOR STRATEGIC PLANNING 2021 16pandemic. At every point in time examined before and during the pandemic, he found adults (25 years and
older) with a college degree were substantially more likely to be employed than adults without a college
education.
The cost of higher education is on the rise, and students are paying more for a college education now than 20
years ago. Tuition for public colleges has quadrupled between 1980 and 2015. In fact, after adjusting for
inflation, the cost of private colleges has increased by 129% since the 1980s and the cost of public colleges
has increased by 213% during the same time period. In addition, wages in general have only increased by 67%
since the 1970s. While a college degree does help with employment and income, the overall advantages are
lesser today than they were ten years ago. Because the cost of public four-year degrees has tripled in the past
thirty years, and more than doubled for private four-year colleges, paying for college with savings or
investments is no longer a feasible approach for most families.
As a result, the rising cost of higher education is leading to increasing student debt. Both college tuition and
student loan debt are at an all-time high. Around 54% of today’s college students need to borrow money to
pay for college. In fact, in 2020 the average student loan debt was around $37,500 for a collective debt of $1.6
trillion. Student loan debt is now the second highest consumer debt category, with 45 million borrowers owing
almost $1.6 trillion according to Forbes. This debt is now more than credit cards and auto loans, exceeded
only by mortgage debt. According to the Federal Reserve Board, 42% of adult Americans who attended
college (i.e., 30% of all adults) borrowed money to pay for college. Twenty-two percent of these Americans still
owe money on their student loans, while the remaining 20% have paid off their education loans. The normal
monthly payment for student loan repayments ranges between $200 and $300. Of the Americans who have
incurred debt from higher education, 11% are currently behind in their payments, 42% are current on their
outstanding debt, and 47% have completely paid off their loans. It is estimated that 40% of student loan
borrowers are expected to default on their loans by 2023.
There are numerous ideas under consideration with national leaders to address the student-debt crisis such as
automatic enrollment in income-driven repayment plans and even the potential for student loan cancellation
up to a certain threshold.
Declining Enrollment at Community Colleges
Nationally community college enrollment has experienced a steady decline since the fall of 2016. Lake Land
College has witnessed first-hand this declining enrollment. Between 2009 and 2020 the College has had a 27%
decrease in annual student enrollment (excluding the Department of Corrections). Lake Land experienced a
10.3% decrease in college student enrollment between fall 2019 and fall 2020, which closely resembles the
national decrease in community college enrollment of 9.4%. See Figure 4 below for the annual enrollment of
students at Lake Land College between fiscal year 2007-2008 and 2019-2020 excluding DOC students.
According to a new report from the National Student Clearinghouse Research Center, the spring 2021
semester experienced the largest year-over-year enrollment drop in over a decade at United States colleges
and universities. Total enrollment fell by 3.5% in spring 2021 compared to spring 2020. However, community
colleges experienced heavier enrollment declines than four-year universities in spring 2021. Their enrollment
declined by 9.5% between spring 2020 and spring 2021.
TREND ANALYSIS FOR STRATEGIC PLANNING 2021 17You can also read