Trophic cascades from wolves to grizzly bears in Yellowstone
←
→
Page content transcription
If your browser does not render page correctly, please read the page content below
Journal of Animal Ecology 2013                                                                     doi: 10.1111/1365-2656.12123

Trophic cascades from wolves to grizzly bears in
Yellowstone
William J. Ripple1*, Robert L. Beschta1, Jennifer K. Fortin2 and Charles T. Robbins3
1
 Department of Forest Ecosystems and Society, Oregon State University, Corvallis, OR, USA; 2School of Biological
Sciences, Washington State University, Pullman, WA, USA; and 3School of the Environment and School of Biological
Sciences, Washington State University, Pullman, WA, USA

         Summary
         1. We explored multiple linkages among grey wolves (Canis lupus), elk (Cervus elaphus),
         berry-producing shrubs and grizzly bears (Ursus arctos) in Yellowstone National Park.
         2. We hypothesized competition between elk and grizzly bears whereby, in the absence of
         wolves, increases in elk numbers would increase browsing on berry-producing shrubs and
         decrease fruit availability to grizzly bears. After wolves were reintroduced and with a reduced
         elk population, we hypothesized there would be an increase in the establishment of berry-pro-
         ducing shrubs, such as serviceberry (Amelanchier alnifolia), which is a major berry-producing
         plant. We also hypothesized that the percentage fruit in the grizzly bear diet would be greater
         after than before wolf reintroduction.
         3. We compared the frequency of fruit in grizzly bear scats to elk densities prior to wolf
         reintroduction during a time of increasing elk densities (1968–1987). For a period after wolf
         reintroduction, we calculated the percentage fruit in grizzly bear scat by month based on scats
         collected in 2007–2009 (n = 778 scats) and compared these results to scat data collected
         before wolf reintroduction. Additionally, we developed an age structure for serviceberry
         showing the origination year of stems in a northern range study area.
         4. We found that over a 19-year period, the percentage frequency of fruit in the grizzly diet
         (6231 scats) was inversely correlated (P < 0001) with elk population size. The average per-
         centage fruit in grizzly bear scats was higher after wolf reintroduction in July (03% vs.
         59%) and August (78% vs. 146%) than before. All measured serviceberry stems accessible
         to ungulates originated since wolf reintroduction, while protected serviceberry growing in a
         nearby ungulate exclosure originated both before and after wolf reintroduction. Moreover, in
         recent years, browsing of serviceberry outside of the exclosure decreased while their heights
         increased.
         5. Overall, these results are consistent with a trophic cascade involving increased predation
         by wolves and other large carnivores on elk, a reduced and redistributed elk population,
         decreased herbivory and increased production of plant-based foods that may aid threatened
         grizzly bears.
         Key-words: bears, berry-producing shrubs, competition, endangered species, forbs, preda-
         tors, trophic interactions, ungulates

                                                                    details of these indirect effects is still poorly known.
Introduction
                                                                    Growth ring analysis of deciduous tree and willow (Salix
The removal of apex predators from much of the world                spp.) recruitment (i.e. growth of seedlings/sprouts into tall
has had diverse direct and indirect effects, oftentimes             saplings, shrubs or trees) has revealed trophic cascades
revealed through unexpected and complex interactions                occurred regularly in the northern and Gallatin ungulate
(Estes et al. 2011). For many predators, knowledge of the           winter ranges of Yellowstone National Park (YNP) when
                                                                    grey wolves (Canis lupus) were present but declined and
*Correspondence author. E-mail: bill.ripple@oregonstate.edu         eventually became rare after wolf elimination in the early

© 2013 The Authors. Journal of Animal Ecology © 2013 British Ecological Society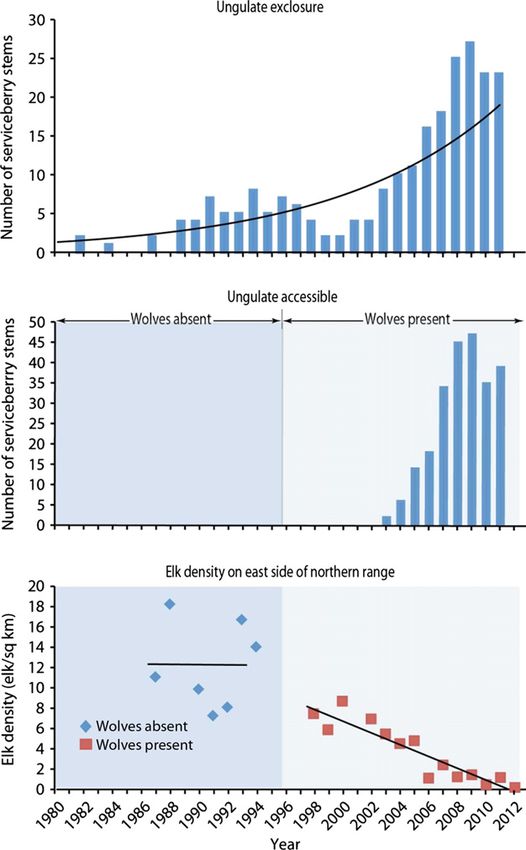
2 W. J. Ripple et al.

20th century (Ripple & Larsen 2000; Beschta 2005; Wolf,               1991; Reinhart et al. 2001). We hypothesized this was not
Cooper & Hobbs 2007; Halofsky & Ripple 2008).                         a coincidence as the low availability of berries was at least
   With these trophic cascades in mind, we considered if              partially caused by excessive ungulate browsing. For
the loss of wolves in Yellowstone during the early 1900s              example, in recent decades, the annual average percentage
may have also allowed elk (Cervus elaphus) to affect plant            dry matter of fruit in the Yellowstone’s bears’ diet (24%)
foods and cover used by grizzly bears (Ursus arctos). In              was much lower than that found from studies in British
contrast to recent information on the tri-trophic cascades            Columbia (281%) and Alberta (183%) (Fig. S1, Sup-
of wolves–elk–woody plants, there is little work identify-            porting information). These differences in fruit utilization
ing potential effects of the presence or absence of wolves            were greatest during the late summer hyperphagia period.
(carnivorous apex predators) on grizzly bears (omnivo-                   The hyperphagia period (July–October) is a time of the
rous apex predators). Flourishing aspen (Populus tremulo-             year that is most critical to the survival and reproduction
ides), cottonwood (Populus spp.) and willow stands are                of bears (Nelson et al. 1983). Grizzly bears have low
important to many grizzly bears because they are typically            reproductive rates compared with other terrestrial mam-
high in plant species diversity with understories rich in             mals and, because they give birth during hibernation, they
berry-producing shrubs and forbs, important bear foods                must secure enough energy stores to sustain themselves
(Aune & Kasworm 1989; Stivers & Irby 1997). Addition-                 and their offspring during hibernation (Hilderbrand et al.
ally, at high stem densities, these stands can provide                1999; Robbins et al. 2012). Interior bears typically get
hiding cover that create secure places for bears to rest              much of their needed energy from fleshy fruits during
and forage (Stivers & Irby 1997).                                     hyperphagia because they contain large amounts of
   Although descriptions of trophic linkages involving un-            digestible carbohydrates, which are efficiently converted
gulates and bears are rare, foraging by domestic or wild              to fat (McDonald, Edwards & Greenhalgh 1981). How-
ungulates can contribute to declines in bear populations.             ever, the hyperphagia diet of Yellowstone’s grizzlies
For example, before going extinct in the American south-              differs from those of virtually all other interior bear popu-
west during the late 1800s and early 1900s, grizzly bear              lations by the paucity of fleshly fruits (Mattson, Blan-
diets shifted towards livestock depredation because of a              chard & Knight 1991). Interestingly, the average
lack of plant-based foods due to extensive overgrazing by             percentage volume of fruit in bear scat during hyperpha-
livestock (Brown 1996). More recently, cattle grazing                 gia from 35 different studies in interior regions of North
adjacent to Glacier National Park depleted important                  America, Asia and Europe was more than eight times
grizzly bear plant foods, particularly in aspen understories          greater than that of Yellowstone (Mattson, Blanchard &
(Jonkel 1985). In a wild ungulate example, abundant                   Knight 1991; Mattson 1998). In most places, fleshy fruits
white-tailed deer (Odocoileus virgininianus) caused an indi-          are a reliable source of food. In any given year, bears can
rect extirpation of a once abundant American black bear               often compensate for a crop failure of one berry species
(Ursus americanus) population on Anticosti Island in east-            using other berry species when there are multiple species
ern Canada by over-browsing berry-producing shrubs                    of shrubs producing fruit.
(C^ote 2005). In this study, we investigate whether a pro-              Our overall goal was to identify potential trophic effects
cess similar to the above examples may have taken place               of wolves and elk on plants that grizzly bears utilize
with Yellowstone’s bears.                                             (Fig. 1). To do so, we analysed historical data on elk
   The Greater Yellowstone Area has a history of one of               numbers and grizzly bear diets as well as collected new
the highest ungulate densities [primarily elk, bison (Bison           data on grizzly bear fruit consumption and the establish-
bison), and domestic livestock] in North America as well              ment dates for stems of berry-producing shrubs. Specifi-
as bears with some of the lowest berry consumption in                 cally, we hypothesized the amount of fruit consumed by
interior North America (Mattson, Blanchard & Knight                   grizzly bears would (i) decline during a period of

Fig. 1. Conceptual diagram showing a potential trophic cascade linking wolves to grizzly bears. The presence of wolves could reduce elk
browsing, via reduced elk densities or altered elk foraging behaviour, on berry-producing shrubs allowing for increased berry production
and a corresponding increase in the quantity of berries consumed by grizzly bears. This is a simplified diagram and other food web
linkages are not shown.

                           © 2013 The Authors. Journal of Animal Ecology © 2013 British Ecological Society, Journal of Animal Ecology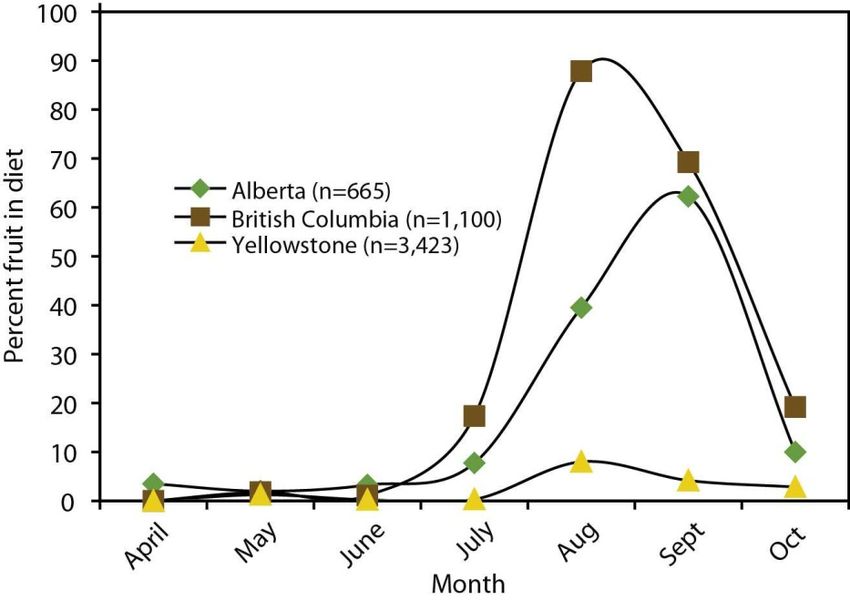
Trophic cascades from wolves to grizzly bears 3

increasing elk numbers when wolves were absent and (ii)               from the mid-1930s until 1968. After the Park stopped
increase following wolf reintroduction. We additionally               culling elk, the population increased rapidly from an esti-
hypothesized an increase in the establishment of berry-               mated low of just over 3000 in 1968 to a high of c.
producing shrub stems after wolf reintroduction. The                  19 000 by 1994 (Fig. S2, Supporting information). During
latter two processes might aid grizzly bears as other                 the seven decades of wolf absence, from the 1920s to the
important foods, such as whitebark pine (Pinus albicaulis)            mid-1990s, the recruitment of woody browse species on
nuts, cutthroat trout (Oncorhynchus clarki) and elk decline           the northern range (e.g. aspen, willow and cottonwood)
(Fortin et al. 2013).                                                 declined and eventually nearly halted (Ripple & Larsen
                                                                      2000; NRC 2002; Beschta 2005; Wolf, Cooper & Hobbs
                                                                      2007). Yellowstone National Park closed all garbage
historical context of study area
                                                                      dumps by 1971, which ended this major food subsidy and
Early historical accounts indicate that wolves, bears and             grizzly bears previously dependent on garbage dispersed
berries were once common in the Yellowstone area                      widely in search of alternate foods (Meagher & Phillips
(Table 1, also see the early history in supporting online             1983). The subsequent increase in grizzly bear conflicts
material and Schullery & Whittlesey 1992). However, pre-              resulted in a substantial number of removed or killed
dators other than bears were typically killed, and the last           bears and their numbers dramatically declined (NRC
Yellowstone wolf was eliminated in 1926. Following wolf               1975; Craighead, Sumner & Mitchell 1995). Shortly there-
extirpation, park biologists soon became concerned about              after, in 1975, the grizzly bear was listed as a threatened
the impacts of elk browsing on vegetation and soils in the            species by the U.S. Fish and Wildlife Service.
northern winter range (Skinner 1928; Rush 1932; Wright,                  By the early 1990s, ungulate browsing was implicated as
Dixon & Thompson 1933; YNP 1958). Consequently, the                   a cause for the low level of berry production in the Greater
Park undertook a programme of elk reductions that lasted              Yellowstone Area (Kay 1995). Buffaloberry (Shepherdia
                                                                      Canadensis), serviceberry (Amelanchier alnifolia) and
Table 1. Historical observations      regarding    berry-producing    chokecherry (Prunus virginiana) production was over two
shrubs in the Yellowstone area                                        orders of magnitude higher inside exclosures compared
                                                                      with adjacent areas outside of exclosures (Fig. 2). Berry
1869 (September 12) —Cook, Folsom, Peterson Expedition—Tom
 Miner Creek, Northern Range near the northern boundary of            production tended to increase exponentially with increased
 Yellowstone National Park                                            shrub height (Fig. S3, Supporting information).
 ‘… two old squaws who were engaged in gathering and drying              Wolves were reintroduced into Yellowstone National
 choke-cherries… they had two or three bushels drying in the          Park in 1995–1997 after a 70-year absence (Fig. S2, Sup-
 sun… so far as we could discover the cherries were their only
                                                                      porting information). Elk have been the primary prey of
 means of subsistence’ (Haines 1965, p. 12–13)
1870 (August 24) – Washburn Expedition – near Yellowstone             these wolves, and grizzly bears commonly kill elk calves
 National Park                                                        and scavenge on carcasses of elk and other ungulates
 ‘… we crossed a small stream bordered with black cherry trees        killed by wolves (Wilmers et al. 2003; Barber-Meyer,
 [chokecherry], many of the smaller ones broken down by bears,        Mech & White 2008; Fortin et al. 2013). Studies of tri-
 of which animal we found many signs’ (Langford 1972, p. 13)
                                                                      trophic cascades involving wolves, elk and plants, such as
1870 (August 28) – Washburn Expedition – view of Hayden
 Valley from near Inspiration Point, Yellowstone National Park        aspen, cottonwoods and willows, generally indicate that
 ‘Meadows verdant with grasses and shrubbery stretch away to          the reintroduction of wolves restored a trophic cascade
 the base of the distant mountains…’ (Langford 1972, p. 33)           with young woody browse species growing taller and
1915 Northern Range, Yellowstone National Park
 ‘…mountain maple, service berry, wild rose, snow-berry, fly
 honey suckle, and many other shrubs are eaten [by elk] during
 the winter’ (Smith 1915, p. 21)
Early 1900s Yellowstone National Park
 ‘Towards the close of summer when the berries begin to ripen,
 bears may desert other banquets to luxuriate in the numerous
 beds of fragrant, juicy, toothsome berries’ (Skinner 1925, p. 54).
Early 1900s Yellowstone National Park
 ‘… They [grizzlies] feed largely on green plants during the
 summer months, especially juicy vegetation as thistles, cow
 parsnips, flower stems of bear grass, wild onions, lily bulbs,
 roots and tubers. As soon as berries begin to ripen they are
 eager for strawberries, blueberries, serviceberries, elderberries,
 currants, gooseberries and even fly honeysuckle’ (Bailey 1930, p.
 171).                                                                Fig. 2. Comparison of berry production inside and outside five
1993 Exclosures: Northern Range and Greater Yellowstone Area          ungulate exclosures in the Greater Yellowstone Area (log scale).
 ‘Repeatedly browsed shrubs produced practically no berries           On average, berry production was at least two orders of magni-
 whereas inside Yellowstone exclosures, there was a positive          tude lower outside compared with inside the exclosures. Exclo-
 correlation between the size of the individual plants and the        sures were built between 1932 and 1963. Number of enclosures
 number of berries’ (Kay 1995, p. 312).                               per species include buffaloberry = 1, serviceberry = 4 and choke-
                                                                      cherry = 3. Source: Kay (1995).

© 2013 The Authors. Journal of Animal Ecology © 2013 British Ecological Society, Journal of Animal Ecology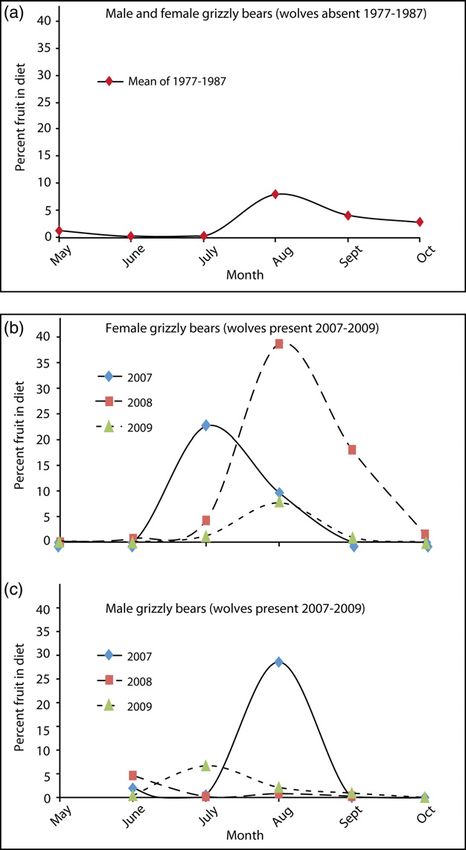
4 W. J. Ripple et al.
canopy cover increasing in some, but not all portions of bears. An alternative hypothesis, not involving elk, included an
the northern range (see review by Ripple & Beschta increase in fruit consumption by grizzly bears after the closing of
2012). Elk browsing decreased and young aspen heights the garbage dumps in 1971 because the bears would be more
increased the most on the eastern portion of the northern intensively searching for alternative food sources to replace gar-
bage. For the period 1968–1987, we compared the percentage fre-
winter range, likely due to a redistribution of elk caused
quency of occurrence of fruit found in grizzly bear scats [Mealey
by a combination of factors, including mortality due to
1975; Craighead, Sumner & Mitchell 1995; annual reports of the
predation and/or elk behavioural responses to the chang- Interagency Grizzly Bear Study Team (IGBST)] against annual
ing balance of predation risk on the northern range elk population counts (unpublished minimum elk counts, Yellow-
(White, Proffitt & Lemke 2012; Painter 2013). stone National Park). We used interpolation between years with
After wolf reintroduction and decreases in the elk pop- successful elk counts to estimate the number of elk for years
ulation on the northern range, both beaver (Caster canad- without counts. In cases when grizzly bear scat data collection
ensis) and bison (Bison bison) numbers increased, possibly spanned 2 or 3 years, we calculated a mean number of counted
due, in part, to the increase in available woody plants and elk for the years involved.
herbaceous forage resulting from less competition with elk For a period after wolf reintroduction, we calculated the per-
(Ripple & Beschta 2012; Smith & Tyers 2012). Because of centage fruit in grizzly bear scat by month based on scats col-
the large body size of bison, their populations have been lected in 2007–2009 (n = 778 scats) as part of a larger study of
bears by Fortin et al. (2013). Additionally, we compared these
little affected by wolf predation in the park.
post-wolf reintroduction data to the percentage fruit found in
In 2011, wolves were removed from the endangered spe-
grizzly bear scat published by Mattson, Blanchard & Knight
cies list, and wolf harvesting was initiated in the northern (1991) for Yellowstone before wolf reintroduction in 1977–1987
Rocky Mountains, including the Greater Yellowstone (n = 3423 scats). Both sets of fecal data were adjusted for differ-
Area in areas adjacent to Yellowstone and Grand Teton ential disappearance according to correction factors published by
National Parks. Also in 2011, a ruling by the U.S. 9th Hewitt & Robbins (1996).
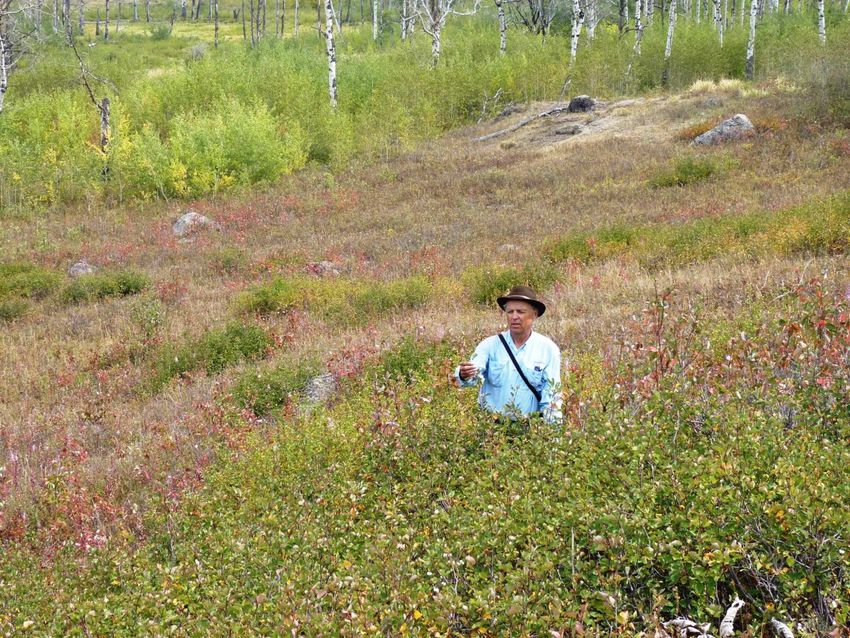
Circuit Court of Appeals struck down the U.S. Fish and In late August 2012, we searched for and collected data from
Wildlife Service’s decision to remove Yellowstone’s griz- all serviceberry patches that we found with dimensions of at
zlies from the endangered species list. The court indicated least 10 m 9 10 m within a 1200-hectare study area on the east
the U.S. Fish and Wildlife Service had failed to ade- portion of the northern range (Fig. S4, Supporting information).
quately demonstrate that whitebark pine decline and the This study area was bounded between the Lamar Canyon on the
east and the Yellowstone River on the west. The study area was
lower availability of pine nuts would not impact grizzly
selected because of a known occurrence of berry-producing
bears (9th circuit court 2011, no. 09-36100). The court
shrubs from a previous study (Beschta & Ripple 2012). We
ruling did not discuss the issue of low berry production.
chose serviceberry as a focal species for our plant measurements,
This may have been because there has been little scientific because it was present in an ungulate exclosure located near our
research focusing on the specific topic of grizzly bear con- study area and is representative of other species of fruit produc-
sumption of fruit in Yellowstone, which, in turn, is likely ers on the northern range (Beschta & Ripple 2012). Within each
related to the lesser importance of fruits in the diet of serviceberry patch, we located the centroid of the patch and then
Yellowstone grizzly bears in recent times. However, avail- placed four 5-m transects in each of the four cardinal directions
ability of grizzly bear food resources in the Greater Yel- radiating out from this centroid. At 1-m intervals along each
lowstone Ecosystem is dynamic, and while some foods, transect, we measured the total height of the nearest serviceberry
such as whitebark pine nuts and cutthroat trout, are in plant and determined the age of the plant based on architecture
of the plant as shown by annual terminal bud scars and browse
decline, other resources, such as fruits, may increase in
marks using methods similar to Ripple & Beschta (2012). Per-
importance. Therefore, the impetus for this article was in
centage browsing by year was determined by dividing the num-
large part due to this lack of research on Yellowstone
ber of browsed stems for a given year by the total number of
fruit production, the recent court ruling and the future plants sampled. Adjacent to each sampled serviceberry patch, we
potential to include trophic interactions and berry produc- enumerated ungulate scat by species in four 2 9 50 m belt tran-
tion in grizzly bear monitoring protocols and sects. These belt transects were spaced 5 m apart and were par-
management. allel. All scat were counted regardless of age.
Because our serviceberry study area was located in the upper
elevation sector of the northern range (White, Proffitt & Lemke
Materials and methods 2012), we analysed trends in elk densities for this sector
To examine a possible link between elk densities and fruit con- (472 km2). We summed the number of elk counted in census
sumption by Yellowstone’s grizzly bears, we obtained data from units 26–52 for the years 1987 through 2012 and converted these
grizzly bear diet studies that occurred between 1968 and 1987, raw counts to densities per km2 by year. We used a Student’s t-
which was a period before the 1988 fires, without wolves, and a test (unequal variances) to check for significant differences
rapidly rising elk population following the elimination of elk cull- (P < 005) in elk density for this sector for the period before wolf
ing in 1968 (Fig. S2, Supporting information). We hypothesized reintroduction compared with after wolf reintroduction.
an inverse relationship between fruit consumption by grizzly All serviceberry patches found in the study area were growing
bears and elk population size because higher elk numbers would on mesic sites. To establish information on reference conditions
result in more elk browsing on fruit-producing plants used by for serviceberry, we searched for and selected all serviceberry
© 2013 The Authors. Journal of Animal Ecology © 2013 British Ecological Society, Journal of Animal Ecology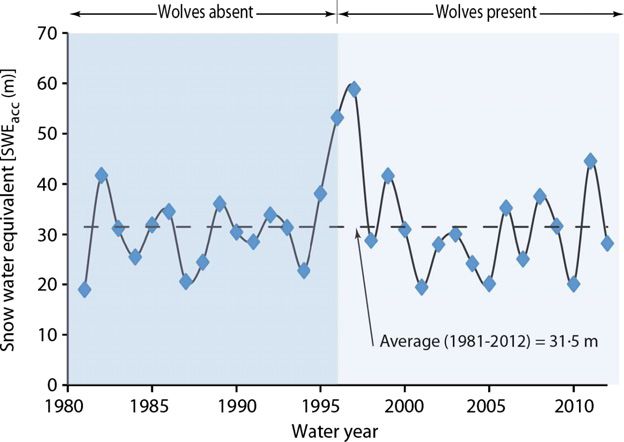
Trophic cascades from wolves to grizzly bears 5

patches growing on mesic sites in the nearby Lamar West ungu-
late exclosure, which was built in 1962. Within each selected ser-
viceberry patch inside the exclosure, we measured heights of all
stems, and for those
6 W. J. Ripple et al.

                                                                      (a)

                                                                      (b)

                                                                      (c)

                                                                      Fig. 5. (a) Histogram of serviceberry stem ages vs. year of estab-
                                                                      lishment (i.e. age structure) within the Lamar West ungulate
                                                                      exclosure, (b) histogram of serviceberry stem ages vs. year of
                                                                      establishment in our study area, which was accessible to ungu-
                                                                      lates, and (c) density of elk per km2 (uncorrected counts) in
Fig. 4. Percentage fruit in grizzly bear scat (a) before wolf rein-
                                                                      upper elevation sector on the eastern portion of the northern
troduction showing monthly means for the period 1977–1987 in
                                                                      range. Source for (c): Yellowstone National Park.
the Yellowstone area, and after wolf reintroduction (2007–2009)
in the southern and eastern Yellowstone National Park for
females (b) and males (c). Lines were plotted using a cubic           elk abundance and the diet of grizzly bears and are con-
smoothing spline. The line in (a) is not directly comparable with
                                                                      sistent with both Craighead, Sumner & Mitchell (1995)
lines in (b) and (c). Year to year variability and data by sex are
not shown in (a) because monthly data by year and sexual identi-      and Kay (1995) who argued that abundant elk in Yellow-
ties of grizzly bears were not available. See more details in text.   stone impacted the growth and production of fruit-
Source for (a) Mattson, Blanchard & Knight (1991).                    producing shrubs. Our findings are also consistent with
                                                                      Mattson (2000, p. 129), who suggested the abundance of
respectively, P = 098) or for the period before wolf rein-           exotic plants and lower quality grizzly bear foods were
troduction (1981–1996) vs. after the first serviceberry               directly correlated with elk population levels, stating: ‘The
stems originated in 2003 (2003–2012) (mean = 314 m vs.               likelihoods that dandelions, elk thistles, and graminoids
297 m, P = 059).                                                    were grazed by bears increased with numbers of elk’.
                                                                         We found support for our first hypothesis in that we dis-
                                                                      covered a significant inverse correlation between elk popu-
Discussion
                                                                      lation size and fruit consumption by grizzly bears during
Our findings are consistent with the trophic cascade                  the period 1968–1987 when elk numbers were generally
hypothesis that decreased elk densities following the rein-           increasing (Fig. 3). The alternative hypothesis of increased
troduction of wolves contributed to increased fruit                   fruit consumption by grizzly bears after the closing of the
production and fruit consumption by grizzly bears. The                garbage dumps was not supported because fruit consump-
results provide rare evidence of the potential link between           tion exhibited a decreasing trend after these closures.

                            © 2013 The Authors. Journal of Animal Ecology © 2013 British Ecological Society, Journal of Animal Ecology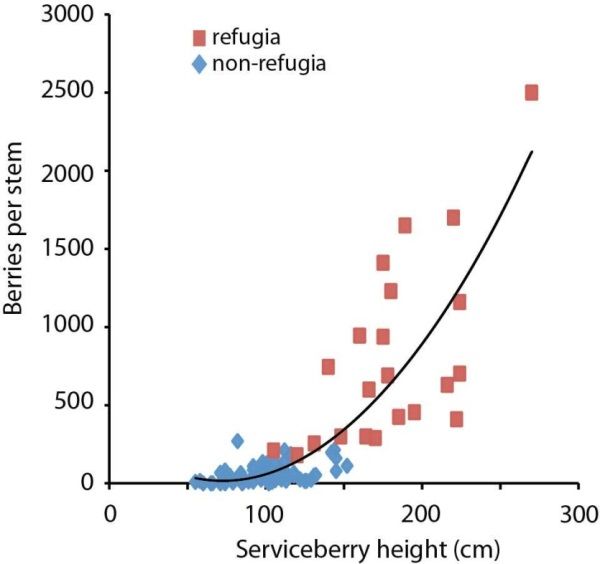
Trophic cascades from wolves to grizzly bears 7

                                                                     ecosystem vs. from the south and central part of
                                                                     Yellowstone National Park for the later period.
                                                                        We also uncovered support for our third hypothesis of
                                                                     an increase in berry-producing shrubs after wolf reintro-
                                                                     duction. While serviceberry stems (n = 247) inside a
                                                                     nearby ungulate exclosure had established both before
                                                                     and after wolf reintroduction, we found that all sampled
                                                                     serviceberry stems (n = 240) in our study area (outside of
                                                                     enclosures) established after wolf reintroduction (Fig. 5).
                                                                     During recent years, we found a dramatic decrease in
                                                                     local elk densities, decreases in browsing and a
                                                                     corresponding increase in serviceberry stem heights. These
                                                                     results are consistent with other studies that show other
                                                                     woody browses growing taller in some, but not all,
                                                                     places since wolf reintroduction and inverse relationships
Fig. 6. Mean values and standard errors for percentage browsing
and stem height based on plant architecture measurements for         between percentage browsing and woody plant height (see
serviceberry during 2008–2012 showing trends and the inverse         review by Ripple & Beschta 2012). We found no support
relationship between browsing levels and plant height [n = 12        for site productivity or snowpack depth to be associated
patches (20 plants/patch or 240 total plants)].                      with the increase in serviceberry stem establishment or an
                                                                     increase in stem heights.
                                                                        During the seven decades without wolves in Yellow-
                                                                     stone, the spatial extent of aspen appears to have
                                                                     decreased dramatically with most aspen stands on the
                                                                     northern range having died out (Renkin & Despain 1996).
                                                                     We expect that a similar decline happened to the number
                                                                     and size of berry-producing shrubs. With diminished plant
                                                                     communities, seed production and dispersal capabilities
                                                                     may have lessened during those seven decades.
                                                                        Although wolves are now again in the park, we sug-
                                                                     gest that more significant increases in the number of
                                                                     berry-producing shrubs, shrub height and fruit produc-
                                                                     tion may take many years. Nevertheless, a recent study
                                                                     found that several species of berry-producing shrubs are
                                                                     growing taller on the eastern portion of the northern
                                                                     range (Beschta & Ripple 2012), which has lower elk den-
Fig. 7. Average annual snowpack water equivalent accumulation        sities than the western side of the northern range (White,
(SWEacc) by year (October through April) for the Canyon
                                                                     Proffitt & Lemke 2012; Painter 2013). These species
(elev. = 2400 m) and Northeast Entrance (elev. = 2240 m) SNO-
TEL sites. Annual values of SWE were compiled from daily data        include twinberry (Lonicera involucrata), serviceberry,
over their concurrent 32-year period of record (1981–2012); SWE      gooseberry (Ribes spp.), rose (Rosa spp.) and snowberry
data were obtained from the USDA National Resource Conser-           (Symphoricarpos spp.). Furthermore, in a 2012 random
vation Service. Line was plotted using a cubic smoothing spline.     sample of 87 aspen stands across the northern range, we
                                                                     found gooseberry in 31%, serviceberry in 22%, buffalo-
   We found support for our second hypothesis when we                berry in 17% and chokecherry in 15% of the stands
compared the percentage fruit in the grizzly bear diet               (W. J. Ripple, unpublished data). At least one of these
before and after wolf reintroduction. Percentage fruit in            four species was present in 56% of the surveyed stands.
the bear’s diet during July and August was, on average,              Although occurrences are relatively low for each of these
20 times higher and nearly twice as much, respectively,              four species of berries, they have not been extirpated.
after wolf reintroduction compared with the period before            Thus, it is likely they can provide sources for seed dis-
wolf reintroduction. We suggest that this change in the              persal in the future. These berry-producing shrubs are
amount of fruit consumed between the two periods may,                highly palatable to elk (and likely bison), ranking very
at times, be biologically significant to the grizzly bears           high in terms of year-round browsing preferences (Nelson
(e.g. for females, 39% fruit in August diet in 2008).                & Leege 1982). In addition to benefits for bears, berry-
Because some of the area burned in the 1988 fires, this              producing shrubs are important for overall biodiversity
increase may have been partly due to the effects of the fire         by providing cover and food web support for a wide
or other factors. For example, there were also differences           variety of other taxa including invertebrates, canids, lag-
in the geographic extent of the scat collections with the            omorphs, rodents, birds, ungulates and others (Beschta
scat from the early period from the larger Yellowstone               & Ripple 2012).

© 2013 The Authors. Journal of Animal Ecology © 2013 British Ecological Society, Journal of Animal Ecology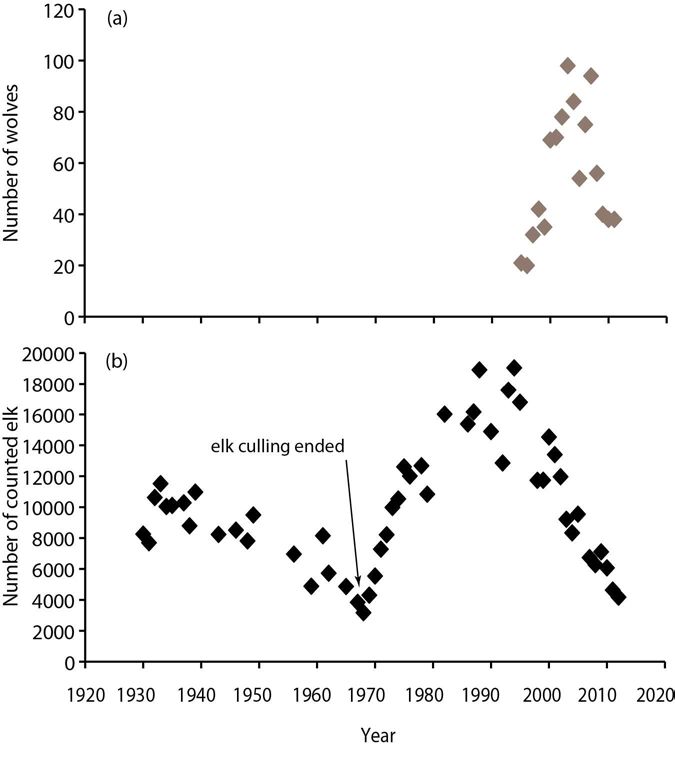
8 W. J. Ripple et al.

   We found bison density, as indexed by scat, to be much          of ungulates, (ii) spawning cutthroat trout (Oncorhynchus
greater than that of elk or other ungulates within the             clarkii), (iii) cutworm moths (Euxoa auxiliaris) at insect
shrub study area. We have repeatedly seen and docu-                aggregation sites and (iv) whitebark pines. We recommend
mented bison browsing of shrubs (Ripple et al. 2010;               the IGBST also establish permanent berry-producing
Painter & Ripple 2012). An increasing bison population             shrub transects both inside and outside the park that
on the northern range may impede increased fruit produc-           could be monitored on an annual basis. Three variables
tion on these plants.                                              of interest would include shrub height, browsing levels
   The long period of open-pit garbage dumps from the              and fruit production by species. Although not a shrub,
1890s to the 1970s may have buffered grizzly bears from            strawberry (Fragaria spp.) production could also be
major food shortages, possibly masking any cascading               included in these surveys because it is common in many
effects on berry production due to the extirpation of              forest understories (Craighead, Sumner & Mitchell 1995).
wolves. Food availability is a major determinant of grizzly        Monitoring key tall forbs or at least umbels such as cow
bear productivity in Yellowstone. For example, nearly all          parsnip, angelica (Angelica spp.) and fern-leaved lovage
cub and yearling deaths within the park between 1983               (Ligusticum filicinum) would also be useful, particularly in
and 2001 were due to starvation and predation, and griz-           areas with and without livestock outside the park bound-
zly bear survival declined during years of low whitebark           ary. Furthermore, grizzly bear scat surveys should be
pine nut production (Schwartz et al. 2006). These findings         periodically conducted for comparing historical to con-
are consistent with density-dependent mechanisms,                  temporary fruit and forb consumption by bears.
suggesting that Yellowstone’s bears have been at or near
carrying capacity, but at the same time have been at rela-
                                                                   alternative hypotheses
tively low densities compared with grizzly bear popula-
tions in several other interior regions (Schwartz, Miller &        An alternative to the trophic cascades explanation as to
Haroldson 2003; Schwartz et al. 2006).                             why Yellowstone has had such a scarcity of berries and
   Our findings of low berry production before wolf rein-          other important fruit was offered by the U.S. Fish and
troduction may be indicative of the status of other impor-         Wildlife Service suggesting that the climate is not condu-
tant plant-based foods for grizzly bears in Yellowstone.           cive to higher production of these grizzly bear foods:
For example, key forbs have also been lacking in the               ‘Although several berry-producing shrubs occur in the
Yellowstone grizzly bear diet, especially tall umbels              area [Yellowstone], these are relatively limited by climatic
such as cow parsnip (Heracleum lanatum; Mealy 1975;                factors’ (Federal Register 72 FR 14866, March 29, 2007).
Knight, Blanchard & Kendall 1982; Mattson, Blanchard                  This alternative explanation is contradicted by five lines
& Knight 1991). Cow parsnip is highly favoured by both             of evidence: (i) historically, berries appear to have been
ungulates and grizzly bears, and it is high in digestible          common in Yellowstone, (ii) high levels of berry production
energy and protein (McLellan & Hovey1995). These tall              occurred inside ungulate exclosures, with low production
umbels are highly sensitive to ungulate grazing and                outside of exclosures, (iii) an inverse relationship between
declined significantly after just 6–9 weeks of cattle grazing      elk population size and amount of fruit in grizzly bear scat
(Stivers & Irby 1997). High levels of ungulate herbivory           during a period of increasing elk numbers, (iv) an increase
can eliminate cow parsnip from the landscape                       in the percentage fruit in grizzly diets after wolf reintroduc-
(Daubenmire 1970). In the early 1900s, Yellowstone elk             tion and (v) an increase in serviceberry stem establishment
regularly foraged on cow parsnip during July–November              after wolf reintroduction. Taken collectively, these lines of
(Skinner 1928). Furthermore, cow parsnip can be an                 evidence support the hypothesis that trophic interactions
important tall forb in the early summer diet of interior           rather than climate represents the more important factor
grizzlies, but in recent times has been extremely low in           affecting fruit production dynamics.
Yellowstone grizzly bear scats (Fig. S5, Supporting infor-            We considered if fruit production might be affected by
mation). This paucity of cow parsnip in the Yellowstone            the unproductive rhyolite-derived soils on major parts of
grizzly diet contrasts sharply with what was found in griz-        Yellowstone’s central plateau. We conclude that these
zly bear scats in both British Columbia (McLellan &                rhyolite areas likely have some effect on fruit production,
Hovey 1995) and Alberta (Munro et al. 2006), where it              but suggest the effects are not massive because spatially,
was ranked as the number one diet item consumed in                 rhyolite only covers 16% of Yellowstone National Park
early summer (Fig. S5, Supporting information). As with            and only 7% of the larger grizzly bear recovery zone
fruits, the near elimination of cow parsnip as an impor-           (Christiansen 2001). We also wondered if the low level of
tant food for Yellowstone grizzly bears may have been              berry consumption by grizzly bears might be attributed to
partially caused by competition with ungulates for these           a high abundance of alternative bear foods (e.g. trout,
forbs. Alternatively, historical cow parsnip production in         elk) in Yellowstone. We suggest that the availability of
Yellowstone may have been less than found in these other           alternative foods may have been an influence, but was
areas because of soils, moisture or other climatic factors.        likely not the main factor here because grizzly bears in
   Currently, the IGBST monitors ‘key grizzly foods’ in            many other interior regions of the world have high-quality
the Yellowstone area including: (i) the availability or use        alternative foods, but fruit is typically still the dominate

                         © 2013 The Authors. Journal of Animal Ecology © 2013 British Ecological Society, Journal of Animal Ecology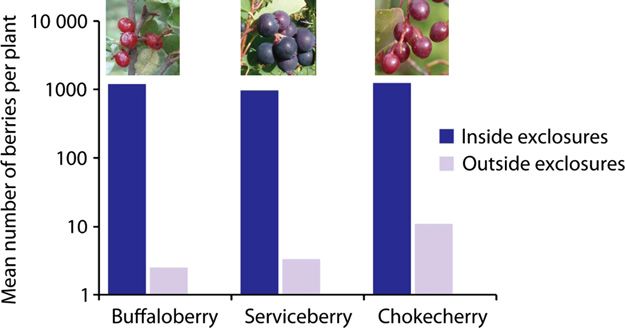
Trophic cascades from wolves to grizzly bears 9

grizzly bear food in late summer (McLellan & Hovey                   with grizzly bears could be a management option for
1995; Mattson 1998).                                                 potentially improving the availability of plant-based foods
   The 9th Circuit Court of Appeals based their 2011 rul-            for the bears. Likewise, reductions in livestock numbers
ing primarily on inadequate documentation of the poten-              or bison densities may similarly affect plant-based foods
tial impacts of declining whitebark pine nut crops on                available to grizzly bears because these ungulates, just as
grizzly bears. Based on the multiple lines of evidence, we           elk, can browse on berry-producing shrubs and graze on
suggest there is also a need to consider trophic interac-            forbs, which creates additional competition for bears.
tions involving wolves and competition between ungulates             Thus, retiring livestock allotments in the Yellowstone
and bears for berry-producing shrubs and forbs. It is                grizzly bear recovery zone could benefit bears through
plausible that competition for food between elk and bears            increases in vegetal foods. We suggest researchers and
in Yellowstone was significantly affected by intense elk             policy makers consider wolves, trophic interactions and
browsing following the extirpation of wolves in the 1920s.           competition from wild and domestic ungulates when
Livestock grazing in grizzly bear habitat adjacent to the            addressing research and management of grizzly bears.
national park and bison herbivory in the park likely also
contribute to increased foraging pressure on shrubs and
forbs. Active livestock grazing allotments occurred across           Acknowledgements
some 32% of the grizzly bear recovery zone outside the               This research was funded in part by the L.L. Stewart Faculty Scholars
park in 1998, decreasing to 19% by 2011 (IGBST, unpub-               award for 2011 to W.J.R. by the Oregon State University Foundation and
                                                                     to C.T.R. by United States Geological Survey (USGS), Biological
lished data). This decrease in livestock use is likely to            Resources Division Natural Resources Preservation Program, Interagency
improve plant communities for bears, ungulates and other             Grizzly Bear Study Team of the USGS Northern Rocky Mountain Science
wildlife in addition to reducing grizzly-livestock conflicts         Center, Washington State University Bear Center and Bear Management
                                                                     Office of the Yellowstone Center for Resources in Yellowstone National
and wolf-livestock conflicts.                                        Park. Personnel support was provided by Bear Management Office, the In-
   The reintroduction of wolves may be helping buffer                teragency Grizzly Bear Study Team and Washington State University. J.
grizzly bears from climate change effects on whitebark               Batchelor and L. Painter assisted in plant field data collection, while S.
                                                                     Arbogast and R. Comforto assisted in manuscript preparation. We thank
pine nut production. For example, grizzly bear use of                C. Whitman, C. Dickinsen, J. Ball, G. Rasmussen and S. Thompson for
wolf-killed ungulate carcasses increased sharply during              their trapping effort and T. Coleman, S. Ard, K. West, S. Podruzny, G.
years with poor whitebark pine nut production (r = 081,             Monroe, T. Rosen, J. Erlenbach, K. Quinton, C. Rumble, G. Wilson, R.
                                                                     Mowry, C. Wickhem, B. Fitzpatrick, S. McKenzie, P. Cross, N. Counsell,
n = 9 years, Hebblewhite & Smith 2010). Likewise, in our             K. Miller, S. Hobbs, B. Harlow, S. McGeehan for help with sample collec-
diet study, fruit consumption by grizzly bears was highest           tion or analyses. We also thank the many national park rangers who
in 2007 and 2008 when whitebark pine nuts were uncom-                assisted us in many ways, from occasional transportation to monitoring
                                                                     our safety. We thank D. Mattson for enlightening conversations and shar-
mon (15 and 9 cones/tree, respectively), but lowest when             ing ideas as well as D. Smith and F. van Manen for conducting helpful
whitebark pine nuts were abundant (46 cones/tree) in 2009            reviews of an early version of this manuscript. Finally, we much appreciate
(Haroldson & Podruzny 2012). Additional evidence for                 comments and suggestions by two journal reviewers.

this potential buffering effect is derived from work by
McLellan & Hovey (1995), who found that the grizzly
                                                                     References
bears in an area with high berry production in the Flat-
head drainage of British Columbia selected berries rather            Aune, K. & Kasworm, W. (1989) Final Report: East Front Grizzly Studies,
                                                                       332 p. Montana Department of Fish, Wildlife, and Parks, Helena, MT,
than whitebark pine nuts when both were available to                   USA.
them. McLellan & Hovey (1995, p. 710) stated ‘Although               Barber-Meyer, S.M., Mech, L.D. & White, P.J. (2008) Elk calf survival
                                                                       and mortality following wolf restoration to Yellowstone National Park.
white-bark pine are common in the Flathead study area,
                                                                       Wildlife Monographs, 169, 1–30.
we have only once found evidence of bears eating their               Beschta, R.L. (2005) Reduced cottonwood recruitment following extirpa-
seeds, and none have been found in the scats’.                         tion of wolves in Yellowstone’s northern range. Ecology, 86, 391–403.
                                                                     Beschta, R.L. & Ripple, W.J. (2012) Restoring berry-producing shrubs
                                                                       with wolves in Yellowstone National Park. Forest Ecology and Manage-
                                                                       ment, 276, 132–138.
Conclusions
                                                                     Brown, D.E. (1996) The Grizzly in the Southwest, 304 p. University of
In ecosystems where wolves have been displaced or locally              Oklahoma Press, Norman, OK, USA.
                                                                     Christiansen, R.L. (2001) Geology of Yellowstone National Park – the
extirpated, their reintroduction may represent a particu-              Quaternary and Pliocene Yellowstone Plateau Volcanic Field of Wyo-
larly effective approach for passive restoration of berry-             ming, Idaho, and Montana. U.S. Geological Survey Professional Paper,
                                                                       729–G.
producing shrubs and important forbs for grizzly bears
                                                                     C^
                                                                      ote, S.D. (2005) Extirpation of a large black bear population by intro-
and a host of other mammals, birds and pollinators.                    duced white-tailed deer. Conservation Biology, 19, 1668–1671.
Nevertheless, this is one of the first studies on this topic,        Craighead, J.J., Sumner, J.S. & Mitchell, J.A. (1995) The Grizzly Bears of
and much more research is needed on the trophic cas-                   Yellowstone. Island Press, Washington D.C., USA.
                                                                     Daubenmire, R. (1970) Steppe vegetation of Washington. Technical Bulle-
cades hypothesized herein. Specifically, more studies are              tin, Washington Agricultural Experiment Station, no. 62, 131 p.
needed on the effects of wolves and ungulates on berry               Estes, J.A., Terborgh, J., Brashares, J.S., Power, M.E., Berger, J., Bond,
                                                                       W.J. et al. (2011) Trophic downgrading of planet Earth. Science, 333,
production and how any effects vary in space and time.
                                                                       301–306.
   Managing for ‘ecologically effective’ wolf populations            Fortin, J.K., Schwartz, C.C., Gunther, K.A., Teisberg, J.E., Haroldson,
(e.g. eliminating wolf harvesting) where they are sympatric            M.A., Evans, M.A. et al. (2013) Dietary adjustability of grizzly bears

© 2013 The Authors. Journal of Animal Ecology © 2013 British Ecological Society, Journal of Animal Ecology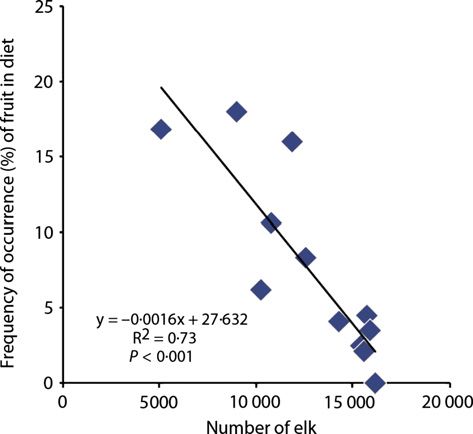
10 W. J. Ripple et al.
and American black bears in Yellowstone National Park. The Journal Reinhart, D.P., Haroldson, M.A., Mattson, D.J. & Gunther, K.A. (2001)
of Wildlife Management, 77, 270–281. Effects of exotic species on Yellowstone’s grizzly bears. Western North
Garrott, R.A., Eberhardt, L.L. & White, P.J. (2003) Climate-induced vari- American Naturalist, 61, 277–288.
ation in vital rates of an unharvested large-herbivore population. Cana- Renkin, R. & Despain, D. (1996) Notes on postfire aspen seedling estab-
dian Journal of Zoology, 81, 33–45. lishment. Ecological Implications of Fire in Greater Yellowstone (ed. J.M.
Halofsky, J. & Ripple, W.J. (2008) Linkages between wolf presence and Greenlee), pp. 95–103, 105–106. International Association of Wildland
aspen recruitment in the Gallatin elk winter range of southwestern Fire, Fairfield, WA, USA.
Montana, USA. Forestry, 81, 195–207. Ripple, W.J. & Beschta, R.L. (2012) Trophic cascades in Yellowstone: the
Haroldson, M.A. & Podruzny, S. (2012) Whitebark pine cone production. first fifteen years after wolf reintroduction. Biological Conservation, 145,
Yellowstone Grizzly Bear Investigations: Annual Report of the Interagen- 205–213.
cy Grizzly Bear Study Team, 2011 (eds F.T. van Manen, M.A. Harold- Ripple, W.J. & Larsen, E.J. (2000) Historic aspen recruitment, elk, and
son & K. West), pp. 39–40. U.S. Geological Survey, Bozeman, MT, wolves in northern Yellowstone National Park, USA. Biological Conser-
USA. vation, 95, 361–370.
Hebblewhite, M. & Smith, D. (2010) Wolf community ecology: ecosystem Ripple, W.J., Painter, L.E., Beschta, R.L. & Gates, C.C. (2010) Wolves,
effects of recovering wolves in Banff and Yellowstone National Park. elk, bison, and secondary trophic cascades in Yellowstone National
The Wolves of the world: New Perspectives on Ecology, Behavior, and Park. Open Ecology Journal, 3, 31–37.
Policy (eds M.P.C. Musiani & P.C. Paquet), pp. 69–120. University of Robbins, C.T., Ben-David, M., Fortin, J.K. & Nelson, O.L. (2012) Mater-
Calgary Press, Calgary, AB, Canada. nal condition determines birth date and growth of newborn bear cubs.
Hewitt, D.G. & Robbins, C.T. (1996) Estimating grizzly bear food habits Journal of Mammalogy, 93, 540–546.
from fecal analysis. Wildlife Society Bulletin, 24, 547–550. Rush, W.M. (1932) Northern Yellowstone Elk Study. Montana Fish and
Hilderbrand, G.V., Schwartz, C.C., Robbins, C.T., Jacoby, M.E., Hanley, Game Commission, Helena, MT, USA.
T.A., Arthur, S.M. et al. (1999) The importance of meat, particularly sal- Schullery, P. & Whittlesey, L. (1992) The documentary record of wolves
mon, to body size, population productivity, and conservation of North and related wildlife species in the Yellowstone National Park area prior
American brown bears. Canadian Journal of Zoology, 77, 132–138. to 1882. Wolves for Yellowstone? A Report to the United States Congress
Jonkel, D.J. (1985) The Blackfeet Reservation: dilemmas in range and (eds J.D. Varley & W.G. Brewster), Vol. 4 Research and Analysis, pp.
grizzly bear management. Western Wildlands, Spring, 11, 25–27. 750. National Park Service, Yellowstone National Park, WY, USA.
Kay, C.E. (1995) Browsing by native ungulates: effects on shrub and seed Schwartz, C.C., Miller, S.D. & Haroldson, M.A. (2003) Grizzly bear. Wild
production in the Greater Yellowstone Ecosystem. Proceedings: Wild- Mammals of North America: Biology, Management, and Conservation,
land Shrub and Arid Land Restoration Symposium (eds B.A. Roundy, 2nd edn (eds G.A. Feldhamer, B.C. Thompson & J.A. Chapman), pp.
E.D. McArthur, J.S. Haley & D.K. Mann, compilers), pp. 310–320. US 556–586. The Johns Hopkins University Press, Baltimore, MD, USA.
Forest Service, INT-GTR-315, Ogden, UT, USA. Schwartz, C.C., Haroldson, M.A., White, G.C., Harris, R.B., Cherry, S.,
Knight, R.R., Blanchard, B.M. & Kendall, K.C. (1982) Yellowstone Griz- Keating, K.A. et al. (2006) Temporal, spatial, and environmental influ-
zly Bear Investigations: Report of the Interagency Study Team 1981. ences on the demographics of grizzly bears in the Greater Yellowstone
National Park Service, USA. Ecosystem. Wildlife Monographs, 161, 68 pp.
Mattson, D.J. (1998) Diet and morphology of extant and recently extinct Skinner, M.P. (1928) The elk situation. Journal of Mammalogy, 9, 309–317.
northern bears. Ursus, 10, 479–496. Smith, D. & Tyers, D. (2012) The history and current status and distribu-
Mattson, D.J. (2000) Causes and consequences of dietary differences among tion of beavers in Yellowstone National Park. Northwest Science, 86,
Yellowstone grizzly bears (Ursus arctos). PhD dissertation, University of 276–288.
Idaho, Moscow, ID, USA. Stivers, T.S. & Irby, L.R. (1997) Impacts of cattle grazing on mesic grizzly
Mattson, D.J., Blanchard, B.M. & Knight, R.R. (1991) Food habits of bear habitat along the east front of the Rocky Mountain, Montana.
Yellowstone grizzly bears, 1977–1987. Canadian Journal of Zoology, 69, Intermountain Journal of Sciences, 3, 17–36.
1619–1629. White, P.J., Proffitt, K.M. & Lemke, T.O. (2012) Changes in elk distribu-
McDonald, P., Edwards, R.A. & Greenhalgh, J.F.D. (1981) Animal Nutri- tion and group sizes after wolf restoration. The American Midland Natu-
tion, 3rd edn. Longman, New York, NY, USA. ralist, 167, 174–187.
McLellan, B.N. & Hovey, F.W. (1995) The diet of grizzly bears in the Wilmers, C.C., Crabtree, R.L., Smith, D.W., Murphy, K.M. & Getz,
Flathead River drainage of southeastern British Columbia. Canadian W.M. (2003) Trophic facilitation by introduced top predators: grey wolf
Journal of Zoology, 73, 704–712. subsidies to scavengers in Yellowstone National Park. Journal of Animal
Meagher, M.M. & Phillips, J.R. (1983) Restoration of natural populations Ecology, 72, 909–916.
of grizzly and black bears in Yellowstone National Park. International Wolf, E.C., Cooper, D.J. & Hobbs, N.T. (2007) Hydrologic regime and
Conference on Bear Research and Management, 5, 152–158. herbivory stabilize an alternative state in Yellowstone National Park.
Mealey, S.P. (1975) The Natural Food Habits of Free-Ranging Grizzly Ecological Applications, 17, 1572–1587.
Bears in Yellowstone National Park, 1973–74. MS Thesis, 158 pp. Wright, G.M., Dixon, J.S. & Thompson, B.H. (1933) A preliminary survey
Montana State University, Bozeman, MT, USA. of faunal relations in national parks. USDI National Park Service
Munro, R.H.M., Nielsen, S.E., Price, M.H., Stenhouse, G.B. & Boyce, Fauna Series No. 1, 157 pp. A preliminary survey of faunal relations in
M.S. (2006) Seasonal and diet patterns of grizzly bear diet and activity National Parks. U.S. National Park Service, Fauna Series 1. U.S. Gov-
in west-central Alberta. Journal of Mammalogy, 87, 1112–1121. ernment Printing Office, Washington, D.C., USA.
National Research council (NRC) (1975) Report of Committee on the Yel- Yellowstone National Park (YNP) (1958) Management Plan for Northern
lowstone Grizzlies. National Academy Press, Washington, DC, USA. Elk Herd, Yellowstone National Park. National Park Service, Mammoth
National Research Council (NRC) (2002) Ecological Dynamics on Yellow- Hot Springs, WY, USA.
stone’s Northern Range. National Academy Press, Washington, DC,
USA. Received 11 April 2013; accepted 16 July 2013
Nelson, J.R. & Leege, T.A. (1982) Nutritional requirements and food Handling Editor: Tim Coulson
habits. Elk of North America: Ecology and Management (eds J.W. Tho-
mas & D. E Toweill), pp. 323–367. Stackpile books, Harrisburg, PA,
USA. Supporting Information
Nelson, R.A., Folk, G.E. Jr, Pfeiffer, E.W., Craighead, J.J., Jonkel, C.J. &
Steiger, D.L. (1983) Behavior, biochemistry, and hibernation in black, Additional Supporting Information may be found in the online version
grizzly, and polar bears. International Conference on Bear Research and
of this article.
Management, 5, 284–290.
Painter, L.E. (2013) Trophic cascades and large mammals in the
Yellowstone ecosystem. PhD thesis, Oregon State University, Corvallis, Data S1. Early history of the study area.
OR.
Painter, L.E. & Ripple, W.J. (2012) Effects of bison on willow and cotton- Fig. S1. Comparison of fruit in the scat of grizzly bears in Alberta,
wood in northern Yellowstone National Park. Forest Ecology and
Management, 264, 150–158.
British Columbia and Yellowstone.
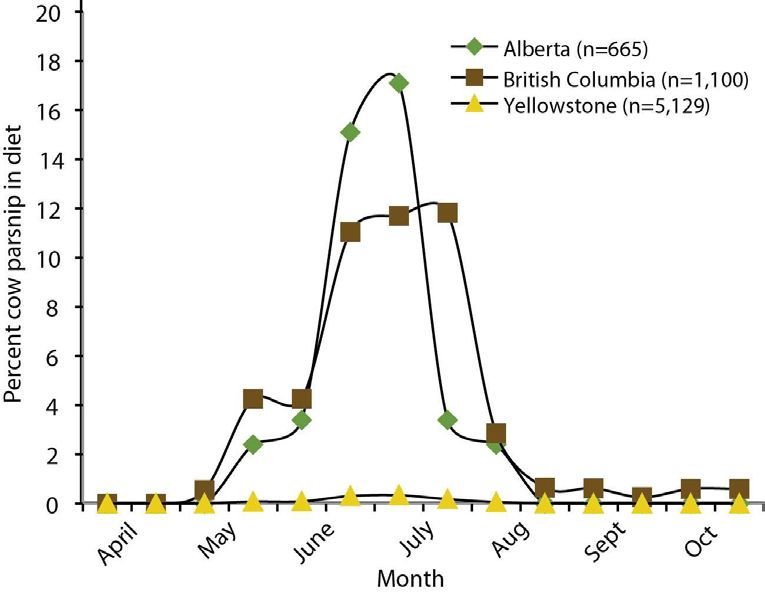
© 2013 The Authors. Journal of Animal Ecology © 2013 British Ecological Society, Journal of Animal EcologyTrophic cascades from wolves to grizzly bears 11 Fig. S2. Wolf population levels and elk counts for the northern Fig. S4. Photo of serviceberry patch within NE Yellowstone study winter range of Yellowstone National Park. area. Fig. S3. Scatter diagram showing the relationship between service- Fig. S5. Comparison of cow parsnip in the scat of grizzly bears in berry plant height and the number of berries produced. Alberta, British Columbia and Yellowstone. © 2013 The Authors. Journal of Animal Ecology © 2013 British Ecological Society, Journal of Animal Ecology
Supporting online material-Ripple et al. for “Trophic cascades from wolves to grizzly

       bears in Yellowstone”, Journal of Animal Ecology.

Early history of the study area
       The Yellowstone area was visited by Lewis and Clark in 1806, followed by a number of
explorers during the early to mid-1800s. According to early historical accounts during this
period, both wolves and grizzly bears were common and widely distributed throughout the
present Park and Greater Yellowstone Ecosystem (Schullery & Whittlesey 1992). An
examination of the writings and photographs from the early explorers to the Yellowstone area
also provide evidence of abundant berry-producing shrubs before Euro-American settlement and
park establishment (Kay 1995). For example, the journals of both the 1869 Cook-Folsom-
Peterson and the 1870 Washburn expeditions indicated abundant berries in the Yellowstone area
(Table 1 in the main text).
       Yellowstone was established as the world’s first national park in 1872, but uncontrolled
hunting had significant effects on both carnivore and ungulate populations in the early years after
park establishment. In 1886, the US Army assumed responsibility for protecting resources and
successfully reduced the poaching of ungulates and bears in the park. Between late 1886 and
1907, the ban on hunting and increases in the amount of garbage in the park likely contributed to
an increase in bears. Estimates of the numbers of grizzly bears in YNP were typically reported as
“numerous” during this period (Skinner 1928; Craighead 1995). Starting in 1907, grizzly bears
were commonly killed or shipped to zoos because they were considered to be “overabundant”
(Craighead et al. 1995). Wolves were present in the park and woody species such as aspen and
cottonwood were still recruiting into the overstory at this time (Ripple & Larsen 2000; Beschta
2005). Likewise, berries were still common in Yellowstone during these early years of the 20th
century, apparently providing grizzly bears with copious feasts in late summer and early fall
(Table 1 in the main text). From 1920 to 1933, it was estimated that the YNP grizzly bear
population increased from approximately 40 to 260 bears possibly because of the increase in the
number of tourists and correspondingly, an increase in the amount of garbage as a food subsidy
(Craighead et al. 1995).
Figure S1. Comparison of fruit in the scat of grizzly bears in three study areas: 1) west central Alberta, 2001-2003 (Munro et al. 2006), 2) Flathead River, British Columbia, 1979-1991 (McLellan and Hovey 1995), and 3) Yellowstone, 1977-1987 (Mattson et al. 1991). All data were corrected for differential disappearance according to Hewitt and Robbins (1996).
Figure S2. (a) Wolf population levels Yellowstone’s the northern range between 1995 and 2011
and (b) elk counts for the northern winter range between the late 1920s and 2012. The period
1968 through 1987 represents the years for our analysis of the grizzly diet, a time of increasing
elk populations after cessation of elk culling by park officials in 1968. Poor count years of 1977,
1989, 1991, and 2006 not shown.
Figure S3. Scatter diagram showing the relationship between serviceberry plant height and the
number of berries produced in 2011 on the northern range of Yellowstone National Park for
plants accessible to ungulate browsing (diamonds) and plants in refugia (squares). Refugia
included both plants in the exclosure and in a canyon protected from ungulate browsing.
        We collected data on plant height and berries produced in September of 2011 (n = 83
plants) to help understand the relationship between serviceberry height and berry production per
plant. We measured the heights of serviceberry plants and counted the corresponding number of
berries per plants sampled in the Lamar West ungulate exclosure (n = 17), in a canyon refugia (n
= 5), and at sites accessible to ungulates (n = 61) within the study area.
        In 2011, berry production was positively related to serviceberry height (r2 = 0.71).
Serviceberry stem height ranged from 55 to 270 cm and the corresponding number of berries
produced per stem ranged from 0 to 2,500. This relationship was curvilinear with taller plants
producing more berries (Figure 10). As of September 1, 2011, 96% of the serviceberries from the
shrubs sampled outside the exclosure had been removed by vertebrates as shown by residual
pedicels. At this same time, four large and fresh bear scats (likely grizzly bears) were found
within the study area. Three of the four scats were comprised entirely of serviceberries, in sharp
contrast to serviceberries found in only 2 of 5,129 Yellowstone grizzly bear scats collected
between 1977 and 1987 [annual reports of the Interagency Grizzly Bear Study Team (IGBST)].
In addition to bear utilization of serviceberries, cedar waxwings (Bombycilla cedrorum) and
American robins (Turdus migratorius) were observed harvesting the berries.
You can also read