TSX WDO - CORPORATE PRESENTATION February 2022
←
→
Page content transcription
If your browser does not render page correctly, please read the page content below
TSX WDO

          CORPORATE PRESENTATION
          February 2022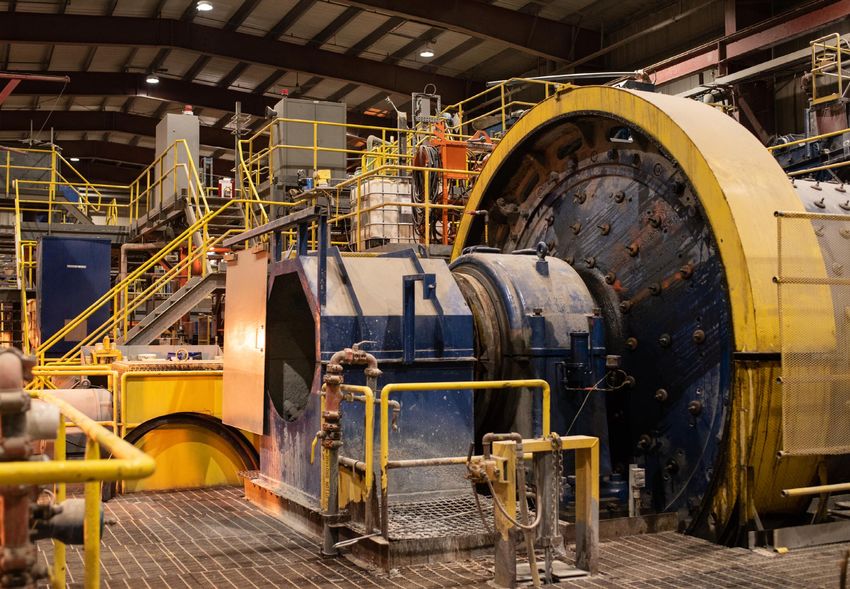
CAUTIONARY STATEMENTS

This presentation contains statements or information concerning the business,               fully discussed in the disclosure material filed with the securities regulatory
operations and financial performance and condition of Wesdome Gold Mines Ltd.               authorities in Canada and available on SEDAR under the Company’s profile at
(“Wesdome” or the “Company”) which constitute forward-looking statements or                 www.sedar.com. Readers are urged to read these materials and should not place
information (collectively, “forward-looking statements”) within the meaning of              undue reliance on the forward-looking statements contained in this presentation.
applicable Canadian securities legislation. Forward-looking statements relate to            Wesdome assumes no obligation to update the forward-looking information relating
future events or the anticipated performance the Company and reflect                        to beliefs, opinions, projections, or other factors, should they change, except as
management’s expectations or beliefs regarding such future events and anticipated           required by applicable securities laws
performance as of the date of this presentation. Forward-looking statements                 Estimates of Mineral Resources
include, but are not limited to, statements with respect to the timing and amount
of future production, costs of production, targeted cost reductions, capital                This presentation contains information regarding the mineral resource estimate
expenditures, the success of exploration activities, permitting time lines,                 at the Company’s Kiena Mine Complex, which has been classified in accordance
government regulation of mining operations, the future price of gold and other              with the Canadian Institute of Mining, Metallurgy and Petroleum’s “CIM
minerals, and the timing and issuance of permits. Generally, forward-looking                Definition Standards on Mineral Resources and Mineral Reserves” incorporated
information can be identified by the use of words such as “plans”, “expects”, “is           by reference into National Instrument 43-101 – Standards of Disclosure for
expected”, “budget”, “scheduled”, “estimates”, “forecasts”, “intends”, “anticipates”,
                                                                                            Mineral Projects (“NI 43-101”). Mineral resources are not economic mineral
“believes” and variations of such words and phrases or statements that certain
actions, events, or results “may”, “could”, “would”, “might”, or “will”, “occur” or “be     reserves and the economic viability of resources that are not mineral reserves
achieved” or the negative connotation thereof. By their nature, forward-looking             has not been demonstrated. The estimate of mineral resources may be
statements involve numerous assumptions, inherent risks and uncertainties, both             materially affected by geology, environmental, permitting, legal, title, socio-
general and specific, that contribute to the possibility that the predicted outcomes        political, marketing or other relevant issues. It is uncertain in all cases whether
could differ materially from those contained in such statements. These risks and            further exploration will result in upgrading the inferred mineral resources to an
uncertainties include, but are not limited to, fluctuations in prices of commodities,       indicated or measured mineral resource category.
fluctuations in currency markets, actual results of additional exploration and
development activities at the Company’s projects, the timing and amount of                  Qualified Person
estimated future production and the costs thereof, capital expenditures, the                The scientific and technical information in this presentation has been reviewed
availability of any additional capital required to bring future projects into production,
                                                                                            and approved by Michael Michaud, P. Geo and Vice President, Exploration of
the failure of plant, equipment or processes to operate as anticipated, accidents,
or labour disputes. Risks and uncertainties about Wesdome’s business are more               the Company, who is a “qualified person” within the meaning of NI 43-101.

                                                                                                                                                           TSX:WDO        1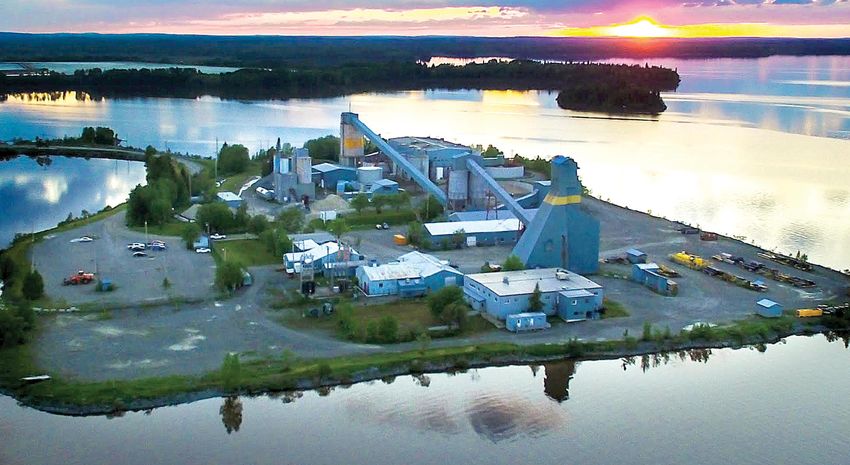
Wesdome’s INVESTMENT PROPOSITION
TIER 1 HIGH GRADE Building Canada’s next
JURISDICTIONS GROWTH
Successfully discovering, MID-TIER
100% owned assets in Canada developing and mining high
grade deposits GOLD PRODUCER
Production base in Ontario
Eagle River average reserve
Primary growth asset in Quebec grade of 13.4 g/t; Kiena reserve
grade 11.9 g/t
Relative Share Price Performance
New discoveries continue to WDO: 528%
extend high grade mineralization
LOW RISK PROVEN
PROFILE MANAGEMENT
Kiena represents fully-funded Track record of turning around
low capex re-start challenged assets and creating
significant value for shareholders
Assets located in prolific, multi
million ounce mining districts Majority of management
previously from St Andrews
Debt free entity
Jan-18
Jul-18
Jan-19
Jul-19
Jan-20
Jul-20
Jan-21
Jul-21
Mar-18
Mar-19
Mar-20
Mar-21
Nov-18
Nov-19
Nov-20
Nov-21
Sep-18
Sep-19
Sep-20
Sep-21
May-18
May-19
May-20
May-21
Goldfields (sold to Kirkland Lake
in 2016)
Gold Peers
TSX:WDO 2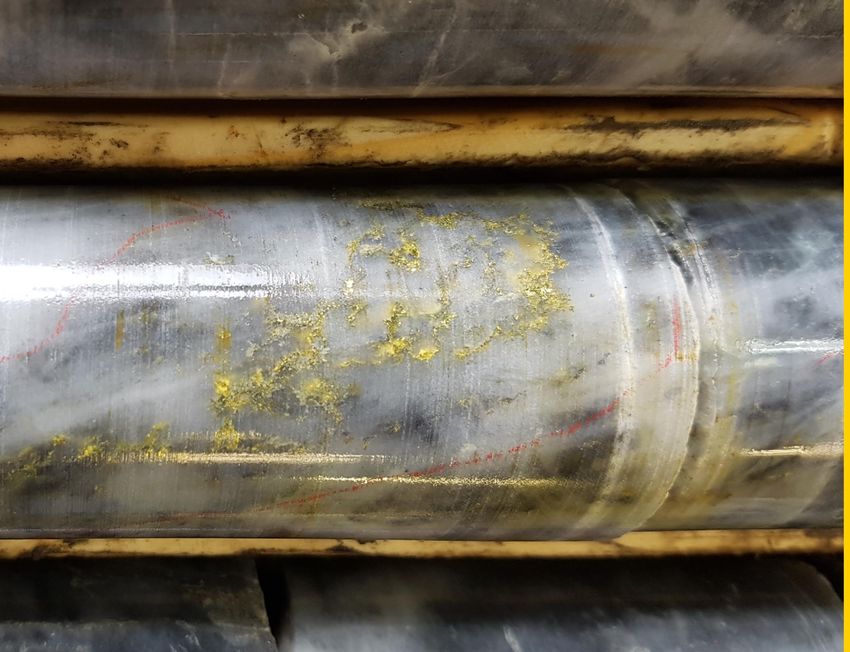
HIGH QUALITY ASSET BASE in Safe, Prolific Mining Districts
          Steady production base with

           FULLY-FUNDED GROWTH PIPELINE

                                                               EAGLE RIVER MINE 1                       KIENA PROJECT 1

                                                                              Wawa,                                   Val-d'Or,
                                                             Location                               Location
                                                                              Ontario                                 Quebec

                                                                                                                      PFS; Q3 2021
                                                             Stage            Producing
                                                                                                                      production
           Canada                                                                                                     restarted;
                                                                                                    Stage
                                                             Type             Underground                             commercial
                                        KIENA Québec                                                                  production Q2
                                                                                                                      2022
                                                             2021
                                                                              101,403 ounces
                                                             Production
                                                                                                    Type              Underground
                                                   Toronto
      EAGLE RIVER Ontario                                    2P Reserves      581,000oz | 13.4g/t
                                                                                                                      84,000oz/yr at
                                                                                                    LOM Profile
                                                                                                                      US$675 AISC
                                                             M&I Resources    102,000oz | 9.2g/t
                                                                                                    2P Reserves       601,800 I 11.9 g/t
                                                             Inf. Resources   205,000oz | 12.5g/t
                                                                                                    M&I Resources2    156,500oz | 7.5g/t
Notes:
(1) 2019 Mineral resources stated exclusive of reserves
(2) 2021 Mineral resources stated exclusive of reserves
                                                                                                    Inf. Resources2   649,200oz | 5.94 g/t TSX:WDO   3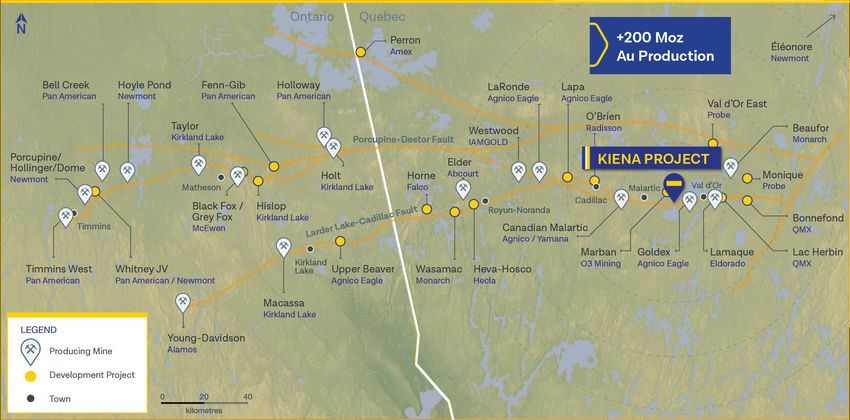
CORPORATE STRUCTURE

                               CAPITAL MARKETS DATA                    Analyst Coverage
  PEER LEADING
                             Symbol                        TSX:WDO
  RETURNS                                                              BMO Capital
                                                                       Markets
                                                                                             Industrial Alliance
                                                                                             Laurentian Bank
  with minimal record of     52 Week High/Low
                                                             $13.52/   Canaccord Genuity
                             (Average daily volume                                           M Partners
  dilution to shareholders   400,000 shares)
                                                              $7.78
                                                                       Desjardins            Mackie Research
                                                                       Echelon Wealth
                             Street Target Price             $14.64                          National Bank
 INVESTOR RECOGNITION                                                  Partners              Financial
                                                                       Eight Capital
                             Shares Outstanding              140.0M                          PI Financial
                                                                       Partners
                                                                                             TD Securities
                             Fully Diluted Shares            144.5M

                             Market Capitalization
                                                                       Major Shareholders
                                                             C$1.5B
                             ($10.93 – January 31, 2022)
                             P / NAVPS                                 Van Eck               T Rowe
                                                               0.9 x
                             (Consensus)                               1832 Asset            Triasima
                             Cash Position                             Management            Fiera
                                                             $69.5M
                             (September 30, 2021)                      Sprott
                                                                                             Fidelity
                                                                       Invesco
                             LT Debt                              –                          Gabelli
                                                                       Mackenzie Financial   CI Investments
                             Management and Directors          0.6%

                                                                                              TSX:WDO         4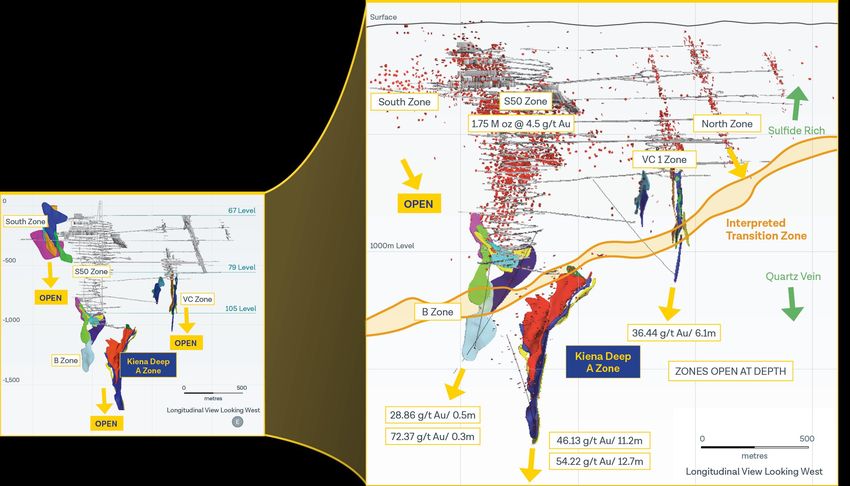
Peer Leading TRACK RECORD Eagle River Mine

   Cumulative Production vs. Reserves                              Consensus NAVPS Growth
                                                                 2016-2020                                DELIVERING
2020               581                                     464
                                                                                                          TANGIBLE RESULTS

2019               561                                 373                          290%
                                                                                    increase              Three Year Share Price Performance
2018                     415                         282
                                                                                                           268%

2017                 518                        210

2016                     446                   151

2015                     431               103

                                                                                                                        45%         43%
2014                       386            53

       Eagle 2P Reserves (koz)   Cumulative Production (koz)      2016       2017    2018   2019   2020    WDO          Gold        Peers

                                                                                                                               TSX:WDO      5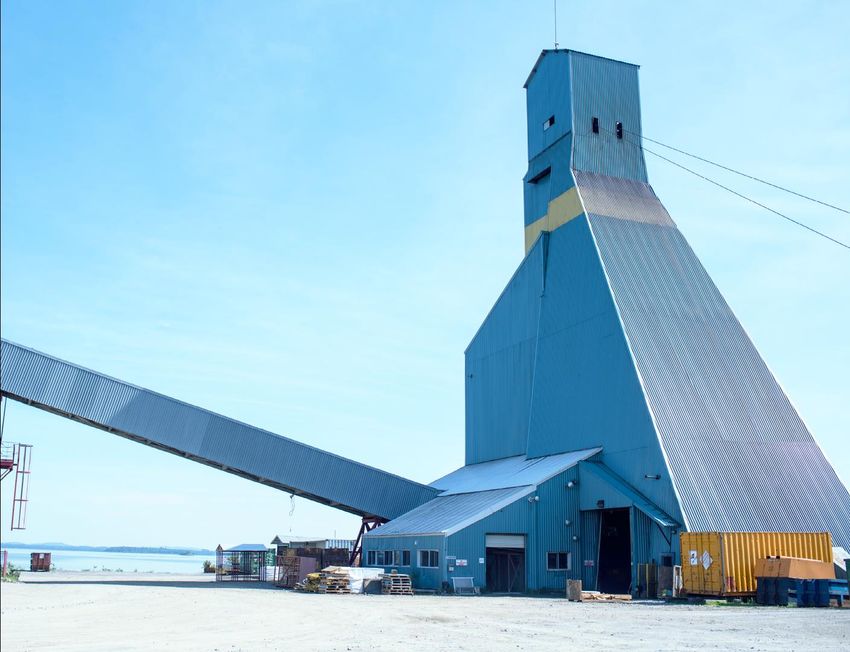
EXPLORATION SUCCESS Across Portfolio Continues
High grade brownfield discoveries at both Eagle and Kiena mines

  Eagle Mine Complex                                       Kiena Project

                                                                           TSX:WDO   6
Focused on OPERATIONAL AND PROJECT DELIVERY
Recent news flow continues to meet or exceed market expectations
 Q3 2020   Q2 results highlighted by strong free cash flow despite COVID impacts and resumption of drilling activities at Kiena
 Q3 2020   Exploration drilling at Eagle River mine confirms down plunge extension of the Falcon Zone to the Mine 7 zone
 Q3 2020   Added to the TSX30 second consecutive year
 Q4 2020   Kiena resource update
 Q1 2021   2020 production results achieved
 Q1 2021   Eagle Reserves increased net of depletion
 Q1 2021   Divesture of Moss Lake announced with upside potential retained
 Q1 2021   Footwall zone discovery at Kiena announced
 Q2 2021   Footwall zone expands
 Q2 2021   PFS Completed (98% IRR)
 Q2 2021   Kiena mine restart announced, production resumed in Q3 (5,511 ounces)
 Q3 2021   Added to the TSX30 for the third consecutive year
 Q3 2021   Falcon Zone at Eagle begins stope production
 Q4 2021   YE Production Results and 2022 Guidance
 Q1 2022   Ongoing Kiena and Eagle Exploration Results
 Q2 2022   Kiena in commercial production
                                                                                                                           TSX:WDO   7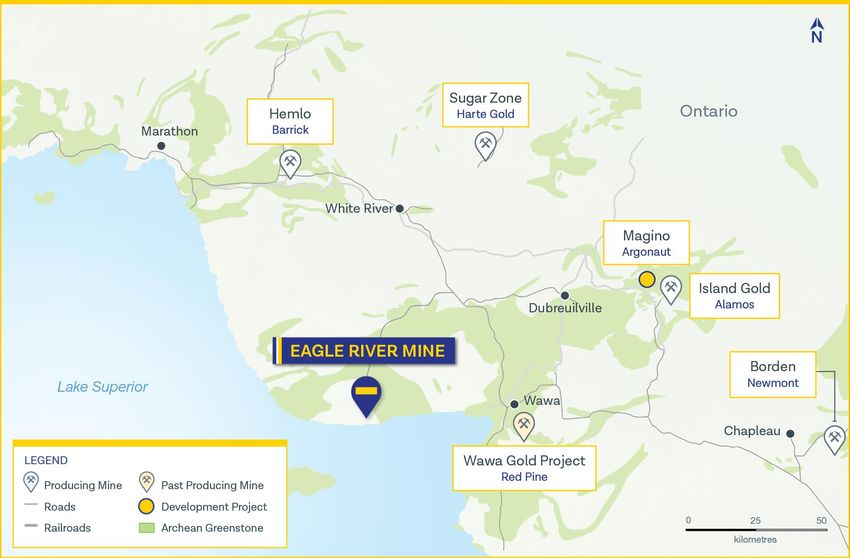
ESG Strength

         ENVIRONMENT                       Committed to
    Tailings Management Facilities
    upgraded at both sites enhance         STRONG
    reliability and increased monitoring
    capabilities
                                           SUSTAINABILITY
    Zero significant environment
                                           PERFORMANCE
    incidents YTD at both Eagle River
    Mine and Kiena Complex

         GOVERNANCE                             SOCIAL
                                           Community support for Kiena
   Among the Top 20 highest-ranked         restart with 86% of staff based
   companies in the materials              locally
   industry group – Globe and Mail
   2021 Board Games survey                 Community support in Wawa with
                                           various initiatives
   Recently published 2020
   Sustainability Report, available on     COVID-19 protocols in place at
   wesdome.com                             Eagle River Mine and Kiena
                                           Complex

                                                                             TSX:WDO   8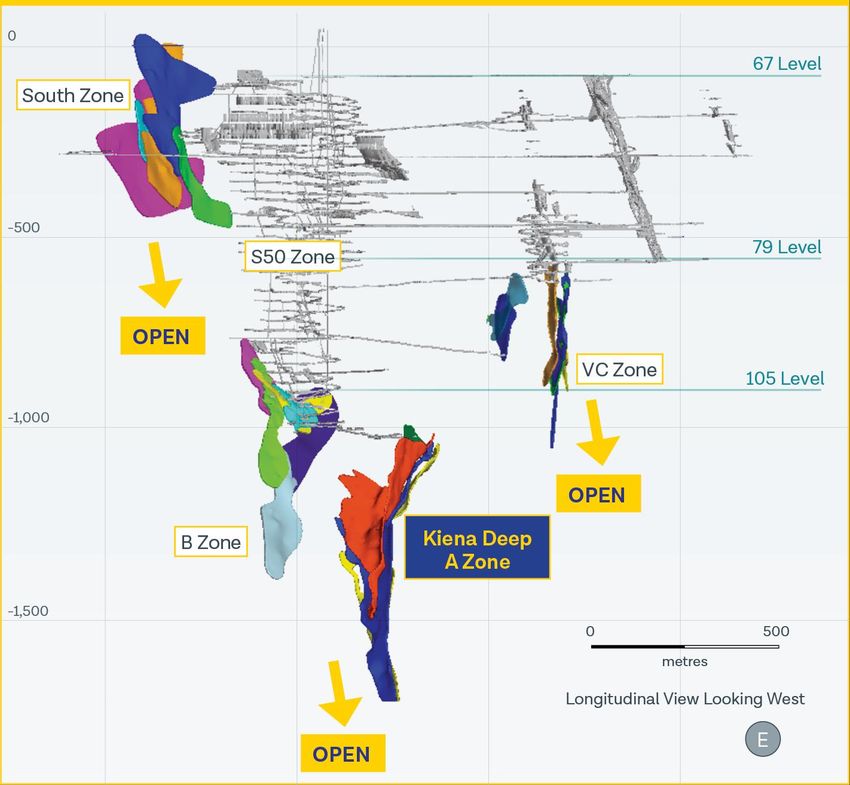
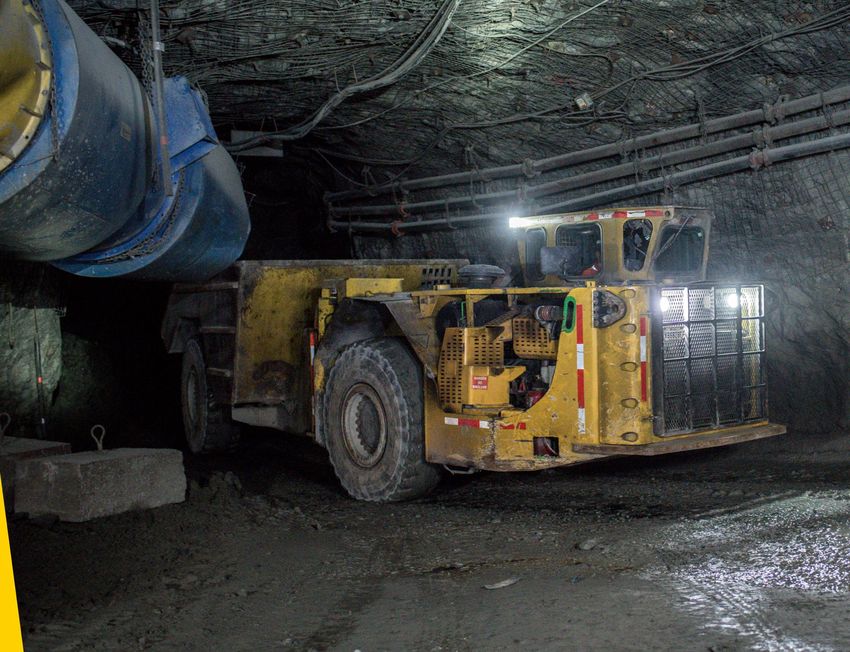
Wawa, Ontario

EAGLE
MINE
EAGLE RIVER Overview
Over 1.3Moz at 9.6g/t produced since 1995

 Located on prospective Mishibishu      Wawa/Hemlo Area
 Greenstone Belt

 Two new parallel structures
 identified in 2013 (No. 7 and
 No. 300)

 High grade 303 Lens continuing
 to have positive operational impact

 Aggressive underground
 and surface exploration
 programs planned

 2021 production: 101,403 ounces
 (Guidance: 92,000 – 105,000)

YTD 2021 costs tracking to guidance
(Operating costs, US $785; AISC
US$1,123)
                                                          TSX:WDO   10
EAGLE RIVER Asset Summary
Over 1.3Moz at 9.6g/t produced since 1995
ASSET SUMMARY Eagle River Complex
50km West of Wawa,
Location
Ontario
Ownership 100%
Land Package 11,013 ha
Underground longhole
Mining method
and open pit
Processing Conventional Merrill-Crowe
Mill Nameplate 850 tpd capacity
Capacity (1,200 tpd permitted)
Access roads
Infrastructure (HWY and gravel),
grid power
TSX:WDO 11Existing MINE PLAN
Eagle River Mine
OPERATIONAL
IMPROVEMENTS
EXPECTED
as additional zones are
delineated
303E zone open at depth
Falcon zone to enhance reserves and
improve operational flexibility
Targeting 700 tpd mining rate in 2022
TSX:WDO 12HIGH GRADE Near Mine Upside
Falcon Zone Connecting 7 Zone Recent Drilling 303 Lens
FALCON 7 ASSAYS
HOLE 622-E-02
51.3 g/t Au over 1.8m core length (38.2 g/t Au cut, 1.5m true width)
HOLE 622-E-11
18.6 g/t Au over 12.5m core length (18.4 g/t Au cut, 8.0m true width)
HOLE 622-E-12
56.8 g/t Au over 1.8m core length (42.9 g/t Au cut, 1.5m true width)
303 LENS
HOLE 925-E-135
41.0 g/t Au over 10.0m core length (34.8 g/t Au cut, 4.2m true width)
HOLE 925-E-166
54.9 g/t Au over 10.1m core length (35.8 g/t Au cut, 5.1m true width)
HOLE 925-E-167
47.3 g/t Au over 5.9m core length (29.4 g/t Au cut, 3.0m true width)
TSX:WDO 13Surface and Regional POTENTIAL
Greenfields Exploration
Brownfields Exploration
Wesdome has only begun
drilling at surface for
PARALLEL
ZONES
TSX:WDO 14Val d’Or, Quebec KIENA RESTART
KIENA RE-START PROJECT Overview
Rapidly advancing low-risk project into production – PFS Q2 2021
 Location
                                       Abitibi-Greenstone Belt: Regional Overview
  • Near Val d’Or, Quebec

 Low Complexity and
 High Grade
  • Located in highly prospective
    Val d'Or gold camp
  • Water rights / permitting status
    / proximity to power

 Low capital intensity
 First quartile cost structure
 Robust project economics

 Fully permitted
 Significant upside to
 current resource
  • Expansion to existing zones
  • First modern surface drill
    program to test property has
    just commenced

                                                                                    TSX:WDO   16
PRE-FEASIBILITY (PFS) Study Highlights
Decision made to proceed with restart of Kiena Complex: 5,511 Ounces Produced in Q3
After-tax NPV5% of $367 million at US$1,600 per ounce gold, increasing to an after-tax NPV5% of
$491 million at US$1,900 per ounce gold
Average annual gold production of 84,000 ounces per year, with over 100,000 per year run rate
expected in 2024
Mine life of 7 years based on October 31 2020 resource update (includes drilling up to September 18,
2020)
LOM average cash costs of $502 (US$380/oz) and all-in sustaining cost of $894 (US$676/oz)
Average annual FCF (2022 – 2027) of $85.5 million at US$1,600/oz of gold or $109.5 million at
US$1,900/oz
Life of mine capital of $230 million fully funded by existing liquidity and operating cash flows
Project scope expanded to include addition of a paste fill plant, water treatment facility, work at the
TMA, and ventilation and power upgrades
All figures in Canadian dollars unless otherwise stated TSX:WDO 17PRE-FEASIBILITY (PFS) Study Details
Strong margins and cash flows with upside from optimization opportunities
Description Unit Value PRODUCTION PROFILE
Total Tonnes Mined Mt 1.6 140,000 400
Average Diluted Gold Grade g/t 11.9 350
Tonnes Milled ('000t)
120,000
Gold Production (oz)
Total Gold Contained oz 601,653 100,000
300
Overall Gold Recovery % 98.4 250
80,000
Total Gold Payable oz 592,113 200
Mine Life years 7 60,000
150
Average Annual Gold Produced Au oz per year 83,574 40,000
100
Long Term Gold Price US$/oz 1,600 20,000 50
Exchange Rate CAD / USD 1.32
0 0
Discount Rate % 5 2021 2022 2023 2024 2025 2026 2027 2028
Total LOM NSR Revenue $M 1,250
Gold Production (oz) Tonnes Milled ('000 t)
Total LOM Operating Costs $M 296
Total LOM Capital Costs $M 230
LOM Operating Cost Detail Unit Value
Total LOM Pre-tax Cash Flow $M 723
Total LOM After-tax Free Cash Flow $M 471 Mining $/t milled $113.79
Pre-tax Summary
Paste $/t milled $5.58
Pre-tax NPV5% $M 569
Pre-tax IRR % 135 Processing $/t milled $28.25
Pre-tax Payback (after start of operations) year 2.2 Water treatment $/t milled $3.55
After-tax Summary
G&A $/t milled $36.53
After-tax NPV5% $M 367
After-tax IRR % 98 Total $/t milled $187.71
After-tax Payback (after start of operations) year 2.7
Cash Cost US$/oz $380
All-in Sustaining Cost (AISC) US$/oz $676
TSX:WDO 18Exploration Continues to EXPAND RESOURCE
Open to Depth – Transition to High Grade
A-zone and VC zone continues to suggest
ROBUST UPSIDE TO
CURRENT RESOURCE
INVENTORY
Parallel Zones
TSX:WDO 19KIENA DEEP A ZONE 3D View and New Footwall Intercepts
TSX:WDO 20UPSIDE FROM SURFACE TARGETS and Mill Expansion
Longer term options to leverage existing excess infrastructure
EXPANSION Surface Programs at Eagle and Kiena
POTENTIAL AT
BOTH EAGLE
AND KIENA
to process additional feed
Excess Mill Capacity
2,000 tpd
1,200 tpd 1,150
350
850 850
Eagle Kiena
Existing Permitted Capacity
TSX:WDO 212022 PRODUCTION AND COST GUIDANCE
Amounts are denominated in Canadian dollars, or otherwise
indicated
Guidance
Gold production
Eagle River 95,000 – 105,000 ounces
Mishi 1,000 – 2,000 ounces
Kiena 64,000 – 73,000 ounces
Consolidated 160,000 – 180,000 ounces
Head grade (g/t)
Eagle River 12.1 – 13.4
Mishi 2.0 – 2.5
Kiena 10.6 – 11.8
Cash cost per ounce sold 1 $875 - $970
US$700-US$775
All-in sustaining cost per ounce sold 1 $1,270 - $1,400
US$1,015 – US$1,125
1 Operating cost per ounce sold and All-in sustaining cost per ounce are non-IFRS measures, please reference the Company’s interim management discussion and analysis for the period ended September 30, 2020 filed on
SEDAR for their calculations.
TSX:WDO 22APPENDIX
MINERAL Reserves

        EAGLE RIVER – MINERAL RESERVES                                                                                      KIENA – MINERAL RESERVES
                                 DECEMBER 31, 2020                          DECEMBER 31, 2019                                                                                    April 12, 2021

                                                                                                                                                                 Tonnes                   Grade             Contained
                         Tonnes         Grade         Contained     Tonnes             Grade       Contained
                                                                                                                                                                  (000s)                  (g/t Au)           ounces
                          (000s)       (g/t Au)        ounces        (000s)           (g/t Au)      ounces

                                                                                                                 Proven                                             -                        -                 -
Proven                       370          12.6        150,000            331             15.5      165,000
                                                                                                                 Probable                                       1,574,400             11.89                 601,800
Probable                     982          13.7        431,000            855             14.0      385,000

Proven + Probable          1,352          13.4        581,000           1,186            14.4      550,000       Total Reserves                                 1,574,400             11.89                 601,800

        EAGLE RIVER PROVEN AND PROBABLE RESERVE                                                                              MISHI – MINERAL RESERVES
                      DECEMBER 31, 2020                                  DECEMBER 31, 2019                                                  DECEMBER 31, 2020                         DECEMBER 31, 2019
Structure
            Tonnes     Grade       Containe                 Tonnes         Grade        Containe
                                                  Percent                                            Percent
             (000s)   (g/t Au)     d ounces                  (000s)       (g/t Au)      d ounces                                  Tonnes          Grade     Contained       Tonnes                Grade      Contained
                                                                                                                                   (000s)        (g/t Au)    ounces          (000s)              (g/t Au)     ounces
No.300         756       14.9      362,000            62          798         15.5      397,000           72

No.7           394       12.6      160,000            28          267         12.9      110,500           20     Proven                52             2.5       4,200                 8               1.9          500

No.8           111       10.7       38,000             7          103         11.6       38,500              7   Probable              50             3.4       5,500           108                   2.9      10,000
Other           91        7.2       21,000             3          18            6.9        4,000             1
                                                                                                                 Proven +
                                                                                                                                      102             3.0       9,700           116                   2.8      10,500
TOTAL        1,352       13.4      581,000           100     1,186            14.4      550,000          100     Probable

                                                                                                                                                                                            TSX:WDO           24
MINERAL Resources
EAGLE RIVER – MINERAL RESOURCES1 KIENA MINE COMPLEX – MINERAL RESOURCES1
DECEMBER 31, 2020 DECEMBER 31, 2019 April 12, 2021
Tonnes Grade Contained Tonnes Grade Contained
(000s) (g/t Au) ounces (000s) (g/t Au) ounces Tonnes Grade Contained
(000s) (g/t Au) ounces
Measured 23.0 12.1 9,000 25.0 10.1 8,000
Indicated 643,700 7.56 156,500
Indicated 320.0 9.0 93,000 355.0 9.0 103,000
Measured Total Measured + Indicated 643,700 7.56 156,500
343.0 9.2 102,000 380.0 9.0 111,000
+ Indicated
Inferred 3,404,400 5.94 649,200
Inferred 510.2 12.5 205,000 403.0 12.3 159,000
MISHI – MINERAL RESOURCES1
DECEMBER 31, 2020 DECEMBER 31, 2019
Tonnes Grade Contained Tonnes Grade Contained
(000s) (g/t Au) ounces (000s) (g/t Au) ounces
Open pit
2,808.0 1.6 147,000 2,808.0 1.6 147,000
Inferred
Underground
373.0 5.4 65,000 373.0 5.4 65,000
Inferred
Total Inferred 3,182.0 2.1 212,000 3,182.0 2.1 212,000
Notes:
(1) Exclusive to Mineral Reserves
(2) Open Pit and Underground Potential Combined TSX:WDO 25MANAGEMENT and Board
Successful operating, development and exploration track record
MANAGEMENT DIRECTORS
Duncan Middlemiss P.Eng Scott Gilbert CPA, CA Warwick Morely-Jepson Charles Main CPA, CA
CEO, Director CFO Chairman Director
Michael Michaud P.Geo Lindsay Dunlop Nadine Miller P.Eng Brian Skanderbeg P.Geo
VP, Exploration VP, Investor Relations Director Director
Raj Gill CFA Heather Laxton Edie Thome Bill Washington
VP, Corporate Development Corporate Secretary and CGO Director Director
Stacy Kimmett
VP, Human Resources
TSX:WDO 26Wesdome Gold Mines
220 Bay St, Suite 1200
Toronto, ON
M5J 2W4
(416) 360-3743
info@wesdome.comYou can also read