U.S. Supply Chains & Inflation - Consumers are growing increasingly price conscious as inflation's grip tightens - Morning Consult
←
→
Page content transcription
If your browser does not render page correctly, please read the page content below

ANALYST REPORT

  U.S. Supply
  Chains & Inflation
  Consumers are growing increasingly price
  conscious as inflation’s grip tightens

                 MAY 2022

© 2022 Morning Consult. All rights reserved.
ABOUT THIS REPORT

Morning Consult’s monthly U.S. Supply Chains & Inflation Report provides a detailed assessment
of U.S. adults’ perception of supply chain disruptions and inflation, along with the impact of both
on consumer purchasing behavior.

Businesses and investors rely on this report to understand emerging trends in consumer demand
and shopping patterns across demographics.

The report draws on Morning Consult Economic Intelligence, a high-frequency, global economic
dataset reflecting more than 19,000 daily economic surveys across 44 countries.

                                                                                                      2
TABLE OF CONTENTS

4      Summary

8      Supply Chain Indexes of Consumer Inflation Pressures

16     Consumer Response to Inflation

21     Supply Chain Disruption

26     Methodology

                                                              3
SECTION 1

SUMMARY
EXECUTIVE SUMMARY

        Consumers became more        With inflation still elevated,      Persistent supply chain
         price sensitive in April,   consumer spending growth            disruptions continue to
      increasingly trading down to    is showing signs of losing        impact the availability of
          cheaper alternatives.           some momentum.              essential goods like groceries.

                                                                                                        5
SUMMARY

As inflation concerns weigh on        Inflation and supply chain disruptions are              of consumers either delayed or abandoned
                                      increasingly influencing purchasing decisions.          purchases as a result of higher-than-expected
consumer purchasing behavior, it
                                      Four of the 5 indexes that make up Morning              prices. This was the case in April for the vast
is critical to understand the         Consult’s newly developed Supply Chain Indexes          majority of all the goods and services tracked.
relationship between supply and       of Consumer Inflation Pressures increased last          Affordability concerns contributed to changes in

price dynamics and their              month, signaling rising inflationary impacts for the    purchasing behavior in other ways, such as an
                                      consumer. High prices are making certain items          increase in trading down to less expensive
implications for consumer
                                      increasingly unaffordable, discouraging purchases       alternatives, especially for services and
spending and overall growth. Even     or leading consumers to buy cheaper alternatives.       discretionary goods.
if monetary policy measures to        Meanwhile, several factors — including geopolitical
                                                                                              Supply chain disruptions continue to plague
tame inflation are successful,        disruption, lingering pandemic impacts and tight
                                                                                              groceries, vehicles and home-related products.
                                      labor markets — continue to restrict the availability
already high prices are likely to     and accessibility of certain goods and services.
                                                                                              A growing share of consumers reported having

remain elevated for some time.                                                                trouble obtaining products or services in April.
                                      In April, high prices deterred more purchases and       Factors new and old continue to disrupt the
Consumers’ response to inflation
                                      led consumers to pursue cheaper substitutes.            production and distribution of certain items:
is therefore likely to play a major   From March to April, the biggest increase in the five   Geopolitical unrest in Ukraine and pandemic-
role in shaping the outlook for the   Supply Chain Indexes of Consumer Inflation              related lockdowns in China are roiling supply

U.S. economy.                         Pressures was the one for price sensitivity. An         chains for food and other goods, while the global
                                      increase in this index signifies that a growing share   chip shortage continues to hamper auto production.

                                                                                                                                                   6
Views on current buying conditions remain negative as inflation continues to climb
               4-week % change in sentiment indicators, 5-day moving average                                           % change in real personal consumer expenditures, by category

                     Current buying conditions                 Index of Consumer Sentiment                                    Durables       Nondurables         Services           Total
        10%
                                                                                                               2.0%
         5%                                                                                                     1.5%
                                                                                                                1.0%
                                                                                                               0.5%
         0%
                                                                                                               0.0%
                                                                                                              -0.5%
        -5%                                                                                                    -1.0%
                                                                                                               -1.5%
       -10%                                                                                                   -2.0%
           Sep ‘21      Oct ‘21      Nov ‘21   Dec ‘21   Jan ‘22   Feb ‘22 Mar ‘22      Apr ‘22                          Sep ‘21   Oct ‘21   Nov ‘21   Dec ‘21   Jan ‘22      Feb ‘22       Mar ‘22
                                                             Source: Morning Consult Economic Intelligence                                                  Source: Haver, Bureau of Economic Analysis

      As supply chain disruptions persisted, inflation climbed to a 40-year high of                          A closer look at self-reported purchasing patterns in our proprietary Supply
      8.5% in March. Both overall consumer sentiment and views on current buying                             Chains & Inflation Survey shows that consumers are growing increasingly price
      conditions have trended lower in step with rising inflation since September.                           sensitive in the current inflationary environment, with a growing tendency to
      Despite these headwinds, consumer spending expanded in the first three                                 delay purchases or trade down to less-expensive products and services. With
      months of 2022, led by spending on services. However, going into April, the                            inflation expected to remain elevated throughout the remainder of the year,
      momentum in consumer spending showed some signs of dissipating in                                      evaluating how U.S. adults respond to rising prices and reduced inventory will
      Morning Consult data under the strain of high inflation.                                               be critical to understanding the path of consumer spending going forward.

U.S. Supply Chains and Inflation | May 2022                                                                                                                                                              7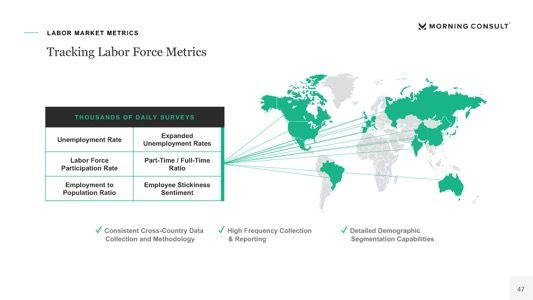
SECTION 2

SUPPLY CHAIN INDEXES OF
CONSUMER INFLATION PRESSURES
Measuring the impact of supply chain disruptions and inflation on consumers
                                                           OUR FRAMEWORK                                Morning Consult’s Supply Chain
                                                                                                        Indexes of Consumer Inflation
                                                                                Price was close to or   Pressures aim to measure the degree to
                                                                                 less than expected     which U.S. consumers are impacted by
                                                                                                        supply chain disruptions and their
                                               Did not
                                              consider                          Price was higher than   resulting price effects by evaluating
                                              purchase                                expected
                                                                    Purchased                           how consumers adapt their purchasing
            Product/                                                                                    behaviors over time.
             service
                                                                                  Purchased lower-
                                                                                  priced alternative    We ask U.S. adults a series of related
                                              Considered                                                questions (shown to the left) that are
                                               purchase
                                                                                                        designed to gauge both the availability
                                                                                                        and the prices of various goods and
                                                                                 Price was too high
                                                                                                        services relative to their expectations.
                                                                      Did not                           This information is then summarized
                                                                     purchase       Product was         into five indexes capturing different
                                                                                    unavailable
                                                                                                        aspects of purchasing behavior and
                                                                                                        compared over time.
                                                                                    Other reason

U.S. Supply Chains and Inflation | May 2022                                                                                                        9
Translating survey responses into index scores
                                                                                                         We measure the degree to which
                               Our Five Indexes Summarizing Consumer Purchasing Behavior                 consumers were unable to complete a
                                                                                                         desired purchase due to limited supply
                                                                                                         (Product Unavailability) or price (Price
                                                Did not purchase because product was unavailable minus
        Product Unavailability                                                                           Sensitivity). Or, for purchases that were
                                                purchased for price close to or less than expected
                                                                                                         completed, those that resulted in trading
                                                                                                         down to a cheaper priced alternative
                                                Did not purchase because price was too high minus        (Substitutability), required greater effort
        Price Sensitivity
                                                purchased for higher-than-expected price
                                                                                                         to find and secure an item (Purchasing
                                                                                                         Difficulty) or were slow to arrive
                                                Purchased lower-priced alternative minus                 (Delivery Delays).
        Substitutability
                                                did not purchase
                                                                                                         All five indexes are “scored,” with
                                                                                                         balanced shares of positive and
                                                Reported difficulty finding certain items minus          negatives responses captured by a score
        Purchasing Difficulty
                                                did not report difficulty finding certain items          of zero. Positive/negative values of each
                                                                                                         index then denote more/less of a
                                                Deliveries were slower than last month minus             purchasing behavior. Further details can
        Delivery Delays                                                                                  be found in the Methodology section.
                                                deliveries were faster than last month

U.S. Supply Chains and Inflation | May 2022                                                                                                            10
SUPPLY CHAIN INDEX OF CONSUMER INFLATION PRESSURES KEY TAKEAWAYS
1 Supply tightness and consumer inflationary pressure increased in April,
with price sensitivity, purchasing difficulty, substitutability and delivery
delays all up from the previous month.
2 By category, services registered the largest jump in price sensitivity, while
essential goods grew increasingly scarce.
3 Lower-income adults were more impacted by supply chain disruptions
and inflation in April, but high earners registered the largest net increases
from the prior month.
11Price sensitivity spiked and trading down picked up in April
Supply Chain Indexes of Consumer Inflation Pressures, U.S. adults • Consumers became increasingly price
sensitive in April, as supply chain
Mar '22 Apr '22 disruptions continued to put upward
pressure on prices.
10.7 • In response to higher prices, consumers
9.2 also exhibited a growing propensity to trade
6.5 down, with a rising share adjusting their
purchases toward lower-priced substitutes.
More
2.3 • While product availability increased slightly,
signaling some alleviation of supply chain
Less
disruptions, inflationary pressures persist.
-0.6 -0.4
-1.4 Both purchasing difficulty and delivery
-2.4 delays increased from a month ago.
Together, these shifts suggest continued
-6.4 shortages and pricing pressure for the
-7.5
affected product categories.
Unavailability Price sensitivity Substitutability Purchasing difficulty Delivery delays
Source: Morning Consult Economic Intelligence
U.S. Supply Chains and Inflation | May 2022 12Purchasing behavior for discretionary goods and services was most impacted in April
Supply Chain Indexes of Consumer Inflation Pressures, subindexes by category Supply chain disruptions and inflationary
pressures impact various goods and
Unavailability Price Sensititivy Substitutability Purchasing Difficulty Delivery Delays services differently. The spike in price
sensitivity and increase in trading down
18.6 18.4 behavior in April largely impacted
discretionary goods and services.
9.6 9.2
6.3 Consumers showed less price sensitivity
5.1 5.0
More
4.0 and were less willing to substitute for
0.3
nondiscretionary goods. However, due to
-0.6 supply constraints, these goods were also
Less
-6.4 -5.5 far and away the most difficult to purchase
-9.3 in April, with extensive delivery delays.
Services exhibited the most price sensitivity
and substitutability in April, emphasizing
-26.1 how consumers can delay or substitute
these purchases much more readily than
nondiscretionary goods.
Nondiscretionary goods Discretionary goods Services
Source: Morning Consult Economic Intelligence
U.S. Supply Chains and Inflation | May 2022 13Essential goods grew scarcer in April and price sensitivity jumped for services
Net change from March to April 2022, by category Nondiscretionary goods had several large shifts in index scores from March to April. Most
notable, however, was a jump in purchasing difficulty, driven by a large increase in reported
Unavailability Price Sensitivity Substitutability
difficulty finding various groceries. Consumers have continued to report worsening grocery
Purchasing Delivery Delays shortages even as backlogs ease for many other categories. Product unavailability increased
Difficulty
as well, also driven by more limited grocery stocks, as did price sensitivity although it
10.1 remained lower overall than for discretionary goods and services.
Nondiscretionary 10.8
Consumer responses for discretionary goods were little changed from March, with the
goods 0.3
16.8 biggest shift occurring in product availability. Unlike essential goods, discretionary goods
1.8 showed easing supply constraints in April, as products like exercise equipment and
electronics became more readily available. Price sensitivity increased less for discretionary
-5.5 goods than for other categories but maintained its lead over essential products since
3.3
Discretionary consumers facing affordability concerns are less willing to splurge on items that aren’t vital
0.9
goods
1.1 to household budgets.
2.7
On the other hand, price sensitivity surged higher for services in April, as did substitutability.
-0.8 Even as a growing share of spending is being directed back toward services, consumers are
Services 16.0 still adjusting their purchases on the margin to cope with inflation. Rising prices for food, fuel
4.1 and labor are driving up costs for restaurant meals, vacations and other services. Homes and
-2.3
apartments — categorized as services since they fulfill the need for shelter — are more
difficult to afford amid rising interest rates and limited inventory. As a result, consumers are
Less More deferring purchases until prices are more affordable or opting for less expensive alternatives.
Source: Morning Consult Economic Intelligence
U.S. Supply Chains and Inflation | May 2022 14Lower-income adults remain the most impacted by supply chain disruptions and inflation,
but higher earners partially closed the gap in April
Supply Chain Indexes of Consumer Inflation Pressures, by income
Unavailability Price Sensitivity Substitutability Purchasing Difficulty Delivery Delays
Less than $50k $50k-$99k $100k or More
14.2 14.2
9.8
7.0 7.7 6.3 7.6
4.5 3.9 4.4
2.9 4.3
3.7
-0.3 -1.1 -1.5 -0.4
-1.5 -3.3
-4.7 -3.1 -4.6
-6.0 -5.8
-7.2 -7.6
-8.5 -11.6 -9.2
March April -11.8
Source: Morning Consult Economic Intelligence
In both April and March, the purchasing behavior of adults from higher-earning In April, affordability concerns spread higher along the income spectrum, with
households was less impacted by inflation than that of their lower-earning the gap between high- and low-income earners narrowing in several of the
peers. Lower-earning households tend to have less money in savings and thus dimensions of purchasing behavior captured in our indexes. Adults with
are more financially vulnerable. This group served as the proverbial “canary in household income of $100,000 or more registered increases for all five
the coal mine” for the jump in gas and food prices in March. indexes, including the largest jump in price sensitivity.
U.S. Supply Chains and Inflation | May 2022 15SECTION 3 CONSUMER RESPONSE TO INFLATION
INFLATION KEY TAKEAWAYS

      1               Most product and service categories registered an increase in price
                      sensitivity in April.

      2              In addition to deferring or abandoning purchases in response to high
                     prices, a growing share of consumers are choosing cheaper alternatives.

      3               Gas prices remain a top concern for consumers, causing many to change
                      their routines to save on fuel costs.

U.S. Supply Chains and Inflation | May 2022                                                    17
                                                                                               17
Consumers showed higher price sensitivity for most goods and services last month
Net change in share of adults who reported not purchasing Price sensitivity increased for most products
various items because the price was too high in March vs. in April and services in April as elevated inflation
continued to pressure household budgets.
Personal care goods or services
A used car, pickup, van or SUV The biggest increases in price sensitivity
Education tended to occur with items that are easier to
Paper goods such as paper towels defer purchasing and for which finding
Health care services cheaper substitutes is difficult. For example,
Restaurant meals and takeout personal care services like haircuts can often
Specific types of groceries and food be delayed a few weeks without much
Furniture disruption, and used vehicles are already the
Vacations and travel lower-cost substitute to new vehicles, meaning
Gasoline they cannot be traded down.
A new car, pickup, van or SUV
Price sensitivity declined for some home-related
A house or apartment
categories such as home improvement
Exercise & sports equipment
supplies, potentially a sign that some
Clothing/apparel
consumers are prioritizing improvements to
Home appliances
their current homes as new home purchases
Electronics, computers or cellphones
become increasingly less affordable.
Home improvement supplies
-15 -10 -5 0 5 10 15
Source: Morning Consult Economic Intelligence
U.S. Supply Chains and Inflation | May 2022 18Consumers became more price sensitive in April, with a growing inclination to trade down
Net changes in Substitutability Index vs. Price Sensitivity Index, March-April 2022 Not only are consumers responding to high prices
8 by delaying or opting out of purchases, but a
I Home appliances
II growing share are increasingly substituting
Health care services
A house or A used car, cheaper alternatives for products and services that
6 apartment pickup, van or
SUV
they originally sought to purchase when faced with
More trading down
Exercise & sports
equipment Education
higher-than-expected prices.
4 Restaurant meals and
Clothing/apparel
takeout Both homes and used vehicles saw relatively large
Electronics, computers Paper goods such as increases in both price sensitivity and substitution
or cellphones 2
paper towels
Vacations and travel Furniture behavior in April. Those that want but don’t
Specific types of
groceries and food urgently need to move or purchase a car are
0
-20 -10 0 10 20 30
putting off those purchases, and those with more
Less trading down
Gasoline
immediate needs are choosing the most
Personal care goods
-2 affordable option available. These behaviors are
or services
A new car, pickup,
van or SUV already showing up in spending patterns and
-4 prices: Rising mortgage rates are showing signs of
dragging down housing demand and used vehicle
-6 price growth has begun losing momentum.
Home improvement
III IV
supplies -8
Less price sensitivity More price sensitivity
U.S. Supply Chains and Inflation | May 2022 19Fewer adults cut back on driving in April, but nearly all who did blame high prices
U.S. adults were asked if they drove more, less or about the same Share of U.S. adults who selected the following as the
as usual over the past month reason for driving less over the past month:
I drove more I drove my I drove less Don't know February March April
typical amount
April 10% 50% 35% 6% 82%
68%
March 9% 46% 39% 6%
57%
February 9% 53% 30% 8%
33%
27%
Gas prices reached a recent peak in March but remained elevated
18% 6% 6%
throughout April. Fewer consumers restricted driving miles in April compared 14% 3%
11% 1%
with the previous month, but those who did overwhelmingly cited gas prices
as the reason why. Gas prices My routine was Other Don't know
were higher different last month
Restricted driving bears implications not only for gas spending, but for other
categories as well. Cutting nonessential trips implies consumers are spending
more time at home rather than visiting shopping or entertainment destinations, Source: Morning Consult Economic Intelligence
potentially shifting or reducing discretionary spending allocations.
U.S. Supply Chains and Inflation | May 2022 20SECTION 4 SUPPLY CHAIN DISRUPTION
SUPPLY CHAIN DISRUPTION KEY TAKEAWAYS

1      Grocery remains the category most affected by supply disruptions,
       with war in Ukraine likely to continue impacting global food stocks.

2      Purchase outcomes for hard-to-find products vary depending on the
       nature of the good or service: Essentials like groceries are typically
       tracked down regardless of search difficulty, whereas purchases of some
       services or discretionary items are more easily deferred or abandoned.

3      Delivery delays worsened in April, with home-related products like
       furniture or home improvement supplies among the most impacted.

                                                                                 22
Grocery category remains the most impacted by supply chain disruptions
Groceries continue to be the category most impacted by Share of prospective buyers who reported experiencing shortages in April, U.S. adults
shortages, with about 6 in 10 adults who shopped for
food reporting difficulty finding certain items in April. Specific types of groceries and food 61%
The Ukraine conflict exacerbated supply chain
A house or apartment 42%
disruptions and prices for a slew of raw agricultural
products (including wheat, oils and fertilizers), adding to Paper goods such as paper towels 36%
supply pressures for various items. As disruptions flow
A new car, pickup, van or SUV 36%
downstream to finished food products, consumers are
likely to continue facing shortages. A used car, pickup, van or SUV 34%
Homes or apartments remain one of the most difficult-to- Home improvement supplies 33%
find items among those tracked. Demand is showing
signs of softening amid rising interest rates, helping to Electronics, computers or cellphones 24%
ease competition over homes. But inventory remains Home appliances 23%
limited. New construction starts have picked up in recent
months, but completions are lagging as enduring labor Furniture 22%
and material shortages hinder the pace of building.
Exercise & sports equipment 15%
Clothing/apparel 13%
Source: Morning Consult Economic Intelligence
U.S. Supply Chains and Inflation | May 2022 23Higher search effort often—but not always—associated with unavailability
Net changes in Unavailability Index vs. Purchasing Difficulty Index, March-April 2022 For most goods and services tracked, product
20 unavailability declined from March to April,
I II meaning a smaller share of prospective buyers
opted out of purchasing items because they
were out of stock or unavailable.
Product unavailability is related to but not
Less available
A new car, Home improvement always aligned with purchasing difficulty. When
pickup, van Furniture supplies Specific types of consumers report difficulty finding certain items,
or SUV groceries and food
it is often due to limited supply, explaining the
A house or
apartment positive correlation (0.57) for monthly shifts in
0 these behaviors for most items.
-10 -5 0 5 10 15 20
More available
Home appliances Electronics, computers However, if consumers who initially encounter
Paper goods such
or cellphones unstocked shelves eventually track down the
as paper towels A used car, pickup,
van or SUV Clothing/apparel desired item, that extra search effort is captured
in the purchasing difficulty index, whereas only
nonpurchases show up in the unavailability index.
Exercise & sports This is the case for essentials like groceries and
equipment
household paper products, which rated as hard to
III IV find but were usually also purchased.
-20
Less difficult to find More difficult to find
U.S. Supply Chains and Inflation | May 2022 24Housing-related products faced longest delivery delays in April
Delivery speed of goods ordered online in April relative to March, U.S. adults Share who said deliveries were slower less share who
said deliveries were faster, selected categories
Faster than last month About the same as last month Slower than last month Home improvement supplies Home appliances Furniture
0.3
Home improvement supplies 23% 37% 40%
0.2
Home appliances 23% 38% 38%
0.1
Furniture 27% 37% 36%
0.0
Sep '21 Oct '21 Nov '21 Jan '22 Feb '22 Mar '22 Apr '22
Exercise & sports equipment 25% 39% 36%
Among U.S. adults who ordered furniture, appliances, home
Electronics, computers
27% 40% 33% improvement supplies or groceries in April, more than 1 in 3
or cellphones
reported slower delivery times compared with the previous
Specific types of
groceries and food 22% 46% 32% month. Home-related categories also registered higher
purchasing difficulty scores from March to April, indicating
Paper goods such as paper towels 24% 44% 31% greater scarcity. Price shocks may also continue to affect
large durable goods: Commodity price growth exacerbated
Clothing/apparel 20% 51% 29% by the war in Ukraine could lead to higher material costs for
items like appliances.
Source: Morning Consult Economic Intelligence
U.S. Supply Chains and Inflation | May 2022 25SECTION 5 METHODOLOGY
Methodology: Supply Chains and Inflation Survey

      Morning Consult’s U.S. Supply Chain Survey measures the impact of                   •   Start date: September 2021
      shortages and rising prices on consumers and their purchasing habits. Each
      month, respondents are asked questions about which products they are                •   Frequency: Monthly (except December 2021)
      having difficulty procuring, how long they are waiting for deliveries and how       •   Fielding Period: Midmonth
      they are responding to supply disruptions and price increases for various
      goods and services.                                                                 •   Release Date: End of month

      The survey is fielded on a monthly basis among a representative sample of           •   Sample size: 2,200
      2,200 adults in the U.S., with a subset of supply chain questions included on
      the monthly Geopolitical Risk Survey. U.S. supply chain data is collected in        •   Geographic coverage: United States
      the first half of each month, with topline findings reported in Morning Consult’s
      Monthly Supply Chain & Inflation Report.

U.S. Supply Chains and Inflation | May 2022                                                                                               27
Process for converting survey responses into indexes tracking purchasing behavior
When you were purchasing the following items (clothing/apparel), which
of the following best describes the outcome?
Example: Price Sensitivity score
I purchased the item I wanted for a price close to or less than what
for clothing/apparel category I’d expected (42%)
Price Sensitivity score for
I purchased the item for a price higher than expected (23%) clothing/apparel (13%) =
Have you purchased or considered
purchasing goods from the following
categories (clothing/apparel) in the I did not purchase the item
of the 46% I purchased a similar but less expensive alternative (10%)
last month or not? because the price was too high
(36%)
Yes, purchased (46%)
minus
Yes, considered purchasing but When you decided not to purchase the following items (clothing/apparel), I purchased the item for a price
did not purchase (17%) which of the following best describes the outcome? higher than expected (23%)
of the 17%
I did not purchase the item because the price was too high (36%)
No, have not considered
purchasing (37%)
I did not purchase the item because it was out of stock or
unavailable (28%) Price Sensitivity subindex = Average of
all category Price Sensitivity scores,
I did not purchase the item for some other reason (36%) weighted by share of total spending from
the Consumer Price Index as shown on
the next slide for each category
U.S. Supply Chains and Inflation | May 2022 28Survey categories covered along with their weights in the indexes
Purchasing
Survey category Product Unavailability Price Sensitivity Substitutability Delivery Delays
Difficulty
Home appliances 0.3% 0.3% 0.3% 0.5% 1.7%
Electronics, computers or cellphones 1.4% 1.4% 1.4% 2.0% 7.3%
Furniture/home furnishings 1.3% 1.3% 1.3% 1.8% 6.6%
Clothing/apparel 3.2% 3.2% 3.2% 4.5% 16.8%
Specific types of groceries and food 10.8% 10.8% 10.8% 15.0% 55.8%
Supplies for home repairs, improvements
1.2% 1.2% 1.2% 1.7% 6.4%
or renovations
Exercise & sports equipment 0.7% 0.7% 0.7% 1.0% 3.9%
Paper goods, such as paper towels or toilet paper 0.3% 0.3% 0.3% 0.4% 1.4%
A new car, pickup, van or sport utility vehicle 5.4% 5.4% 5.4% 7.5% --
A used car, pickup, van or sport utility vehicle 5.5% 5.5% 5.5% 7.6% --
A house or apartment 41.8% 41.8% 41.8% 58.0% --
Gasoline 4.9% 4.9% 4.9% -- --
Restaurant meals and takeout 6.9% 6.9% 6.9% -- --
Vacations and travel 2.0% 2.0% 2.0% -- --
Personal care items and services 1.6% 1.6% 1.6% -- --
Education or tuition 3.4% 3.4% 3.4% -- --
Health care services 9.2% 9.2% 9.2% -- --
Weights derived from CPI relative spending importance, rebased so that the total for each index equals 100%.
U.S. Supply Chains and Inflation | May 2022 29Methodology: Geopolitical Risk Survey
Morning Consult’s Geopolitical Risk Survey measures major geopolitical and • Start date: January 2021
economic trends across the world’s largest markets, providing insights into hot
button issues and early signals for policymakers in the public sector and • Frequency: Monthly
decision-makers at multinational firms. It asks questions around inflation and • Fielding Period: Wednesday through Sunday in the last week of
purchasing behavior; price expectations; financial resiliency; housing; ESG; the month
business climate; national security; and trust in political figures and institutions,
both within and outside of the respondents’ home country. • Release Date: First week of the following month
The survey is conducted on a monthly basis among representative samples of • Sample size: 1,000 adults per country
1,000 adults from 17 countries, including the United States. The survey was first
run in January 2021. Data is collected in the last week of each month. • Geographic coverage: 17 countries
Starting in September 2021, the Geopolitical Risk Survey began asking adults
which products they are having difficulty procuring and how they have adapted
their buying behaviors when faced with delays and shortages.
U.S. Supply Chains and Inflation | May 2022 30Monthly Geopolitical Risk Survey sample sizes and start dates
Approx. Average
Country Start Date Monthly Sample Approx. Average
Country Start Date
Size Monthly Sample Size
United States Jan 2021 1,000
Turkey Mar 2022 1,000
Canada Jan 2021 1,000 Middle East &
Americas Africa
Mexico Jan 2021 1,000 South Africa Mar 2022 1,000
Brazil Jan 2021 1,000 India Jan 2021 1,000
United Kingdom Jan 2021 1,000
Japan Jan 2021 1,000
Germany Jan 2021 1,000
France Jan 2021 1,000 Asia Pacific China Jan 2021 1,000
Europe
Italy Jan 2021 1,000
South Korea Jan 2021 1,000
Spain Jan 2021 1,000
Russia Jan 2021 1,000 Australia Jan 2021 1,000
U.S. Supply Chains and Inflation | May 2022 31REPORT AUTHORS
SCOTT A. BRAVE LEARN MORE
Lead Consumer Spending Economist MorningConsult.com
FOLLOW US
@MorningConsult
MEDIA & SPEAKING
KAYLA BRUUN INQUIRIES
press@morningconsult.com
Economic Analyst
32GET THE LATEST ECONOMIC ANALYSIS CLICK HERE TO SIGN UP
ECONOMIC                                                                   MC E I D A T A I N T E L L I GE N C E C A P A B I L I T I E S

                                             INTELLIGENCE                                                               Economic Intelligence collects over 15,000 daily responses on
                                                                                                                        key global macroeconomic indicators including:

                                             Data Intelligence                                                           § Personal
                                                                                                                           Finances
                                                                                                                                                § Employment
                                                                                                                                                  Type
                                                                                                                                                                       § Pricing Effect
                                                                                                                                                                       § Supply
                                             On Key Economic Indicators                                                  § Buying               § Labor Market           Expectations
                                                                                                                           Conditions             Sizing               § Demand
                                             Morning Consult’s SaaS platform tracks key economic                         § Business             § Future Price           Expectations
                                                                                                                           Conditions             Increases            § Ability to Pay
                                             indicators including consumer sentiment, spending, labor
                                                                                                                         § Employment           § GDP
                                             conditions and more.                                                          Status                 expectations

Key Use Cases

T R A C K GL OB A L                       MON I T OR L A B OR &                            T R A C K I N F L A T I ON                         U N D E R S T A N D HOU S I N G
C ON S U ME R C ON F I D E N C E          E MP L OY ME N T C ON D I T I ON S               E X P E C T A T I ON S                             MA R K E T
Track global consumer confidence to       Compare labor market conditions across           Tracking consumer inflation expectations           Tracking supply and demand of housing
better understand and forecast consumer   and within countries to identify job             and their impact on spending and buying            including buying, renting and the ability to
spending.                                 seekers with appropriate skill sets.             habits.                                            make payments.

Available in 44 countries

 USA       CHINA      JAPAN        GERMANY       UK       FRANCE        INDIA      ITALY       BRAZIL       CANADA       S KOREA         RUSSIA       AUSTRALIA          SPAIN          MEXICO
© 2022 Morning Consult. All rights reserved.
You can also read


