Understanding and Improving Usability of Data Dashboards for Simplified Privacy Control of Voice Assistant Data (Extended Version)
←
→
Page content transcription
If your browser does not render page correctly, please read the page content below
Understanding and Improving Usability of Data Dashboards for
                                                              Simplified Privacy Control of Voice Assistant Data
                                                                             (Extended Version)

                                                                 Vandit Sharma                                                     Mainack Mondal
arXiv:2110.03080v1 [cs.CR] 6 Oct 2021

                                                   Indian Institute of Technology Kharagpur                           Indian Institute of Technology Kharagpur
                                                          vanditsharma@iitkgp.ac.in                                           mainack@cse.iitkgp.ac.in

                                                                    Abstract                                          1 Introduction

                                                                                                                      Voice assistants like Google’s voice assistant (GVA), Ama-
                                        Today, intelligent voice assistant (VA) software like Ama-
                                                                                                                      zon’s Alexa, Microsoft’s Cortana, or Apple’s Siri are ex-
                                        zon’s Alexa, Google’s Voice Assistant (GVA) and Apple’s
                                                                                                                      tremely popular today as they are well equipped to perform
                                        Siri have millions of users. These VAs often collect and an-
                                                                                                                      multiple tasks on users’ voice requests (e.g., searching the
                                        alyze huge user data for improving their functionality. How-
                                                                                                                      internet, calling a friend, or playing music). However, these
                                        ever, this collected data may contain sensitive information
                                                                                                                      voice assistants also collect and analyze a lot of user data
                                        (e.g., personal voice recordings) that users might not feel
                                                                                                                      (e.g., timestamps, audio recordings, transcripts, etc.) to im-
                                        comfortable sharing with others and might cause signifi-
                                                                                                                      prove their infrastructure across multiple devices (e.g., in
                                        cant privacy concerns. To counter such concerns, service
                                                                                                                      both smart speaker and smartphone). Unfortunately, this data
                                        providers like Google present their users with a personal data
                                                                                                                      can lead to a huge possible privacy nightmare since the voice
                                        dashboard (called ‘My Activity Dashboard’), allowing them
                                                                                                                      assistant might be used in private situations. E.g., GVA col-
                                        to manage all voice assistant collected data. However, a real-
                                                                                                                      lects three types of potentially sensitive data—audio clips of
                                        world GVA-data driven understanding of user perceptions
                                                                                                                      conversations, transcripts of conversations, and the ambient
                                        and preferences regarding this data (and data dashboards) re-
                                                                                                                      location of use. We refer to individual records of these three
                                        mained relatively unexplored in prior research.
                                                                                                                      data types as data elements in this paper.
                                           To that end, in this work we focused on Google Voice As-                      In this study, we take Google voice assistant (GVA) as
                                        sistant (GVA) users and investigated the perceptions and pref-                our experimental testbed. Previous studies on understand-
                                        erences of GVA users regarding data and dashboard while                       ing user perceptions and preferences for data collection by
                                        grounding them in real GVA-collected user data. Specifically,                 voice assistants (such as [38, 51]) have mainly focused
                                        we conducted an 80-participant survey-based user study to                     their attention on smart speaker users. However, recent re-
                                        collect both generic perceptions regarding GVA usage as                       ports [30, 53] have highlighted the significantly greater pop-
                                        well as desired privacy preferences for a stratified sample of                ularity of smartphone-based voice assistants over their smart
                                        their GVA data. We show that most participants had superfi-                   speaker counterparts. Intuitively, smartphones are easier to
                                        cial knowledge about the type of data collected by GVA. Wor-                  use in more contexts than smart speakers, multiplying poten-
                                        ryingly, we found that participants felt uncomfortable shar-                  tial privacy problems. To that end, the exact same GVA soft-
                                        ing a non-trivial 17.7% of GVA-collected data elements with                   ware runs in both Google smart speakers and Android smart-
                                        Google. The current My Activity dashboard, although useful,                   phones, effectively aggregating data from both. So, we focus
                                        did not help long-time GVA users effectively manage their                     on GVA users and conduct a real user-data driven study to
                                        data privacy. Our real-data-driven study found that showing                   uncover user perceptions regarding GVA-collected data.
                                        users even one sensitive data element can significantly im-
                                                                                                                         Specifically, to counter this problem of sensitive data col-
                                        prove the usability of data dashboards. To that end, we built
                                                                                                                      lection, service providers like Google often provide a dash-
                                        a classifier that can detect sensitive data for data dashboard
                                                                                                                      board to the users showcasing their GVA collected data
                                        recommendations with a 95% F1-score and shows 76% im-
                                                                                                                      (Google’s My Activity dashboard). We noted that the dash-
                                        provement over baseline models.
                                                                                                                      board includes data from both smart speakers and smart-
                                                                                                                      phones without differentiating markers. However, the effi-
                                            This extended version of our USENIX Security ’22 paper includes ap-       cacy of these data dashboards for controlling privacy in the
                                        pendices for interested readers.                                              GVA context is not well-understood. To that end, we un-

                                                                                                                  1
pack user perceptions and preferences regarding data collec- it was collected. There were no significant differences in
tion by GVA as well as data dashboards through a two-part user privacy preferences for data elements from different con-
survey-based user study. Our overall goal is to assess the use- trol and possibly sensitive classes (prepared from previous
fulness/efficacy of data dashboards. We specially focus on work [9, 35, 38]), suggesting the inherent complexity of find-
the context of data collected by voice assistants (in smart ing sensitive data.
devices) and investigate the efficacy of these dashboards to RQ4- Do data dashboards help users to control the privacy
enable the privacy goals of users in that context. of their GVA data? Can we further assist users by automated
Our research questions (RQs), as stated below, are de- means to improve their privacy-preserving behavior by im-
signed to unravel (i) whether data dashboards can indeed fa- proving the data dashboard? How?
cilitate a better understanding of what (possibly sensitive) 50% of our participants did not know about the Google-
data VAs collect, and (ii) the particular helpful (or not so provided My Activity data dashboard. Most participants
helpful) aspects of data dashboards from a user-centric view. found the dashboard easy to use; however, more long-time
Our RQs also investigate how to improve the usability of GVA users expressed a need for assistance in using the dash-
these data dashboards. In this study, we particularly contex- board, suggesting a lack of effectiveness for larger amounts
tualize our RQs with our focus on GVA. We selected GVA of data. Showing users even one sensitive data element col-
primarily because of the huge user base (boosted by the in- lected by GVA using our simple class-based sensitive content
clusion of GVA in all Android smartphones). Even though detection system made them highly (80%) likely to control
our choice of GVA poses some limitations, (e.g., GVA user- their collected data. This suggests that assisting dashboard
base and dashboard might not necessarily represent all VA users through automated means might improve their privacy-
users or dashboards), our approach is still useful—findings preserving behavior. We took the first step in this direction by
from our study answer broader questions about helpfulness exploring an Machine learning (ML)-assisted human-in-the-
of data dashboards in general and take a step forward towards loop (HITL) based design for data dashboards. We show that
improving their usability. it is possible to create Machine learning-based systems to
RQ1- How frequently do Android users leverage GVA? recommend sensitive content with more than 95% F1-score
What is their GVA usage context? showing a concrete, feasible direction to improve data dash-
Most (72.5%) of our participants had been using GVA for boards. We note that, although we used GVA as our exper-
around two years or more. 73.75% of participants used GVA imental testbed, our findings regarding the efficacy of data
frequently, at least a couple of times a week in home, office dashboards as well on improving data dashboards could be
and car. For the median participant, GVA collected 837.5 extended to contexts concerning other VAs. For example, our
data elements. The context of using GVA ranged from get- results show that dashboards are indeed useful for tracking
ting information to entertainment. VA-collected data. However, there also is a need for auto-
mated assistance in using the dashboards, notably for long-
RQ2- What are the user perceptions regarding the data col-
term users to control the privacy of large amounts of accumu-
lection and storage practices of GVA? What is their ideal ac-
lated data. These findings are potentially useful for designing
cess control preference for Google relative to their social re-
improved data dashboards for any VAs.
lations for accessing GVA data?
The rest of the paper is organized as follows- The back-
Although the majority (78.75%) of participants were
ground and related work in Section 2. Our methodology is
aware that Google collects and stores some form of data,
explained in Section 3. We describe the data analysis in Sec-
around 40% of users were unclear about the type of data (e.g.,
tion 4. The survey results are presented in Section 5. In Sec-
audio clips) being collected, signifying superficial knowl-
tion 6, we explore ML as a possible improvement to recom-
edge. Interestingly, statistical analysis shows that relative to
mend sensitive data elements in data dashboards. Finally, we
various social relations (proxemic zones [28]), participants
conclude the paper in Section 7.
considered Google mainly as a public entity.
RQ3- Do users desire to restrict access of Google to GVA
collected specific data elements? Do these access preferences 2 Background and Related Work
correlate with the data element class or the medium of the
data collection? GVA capabilities and usage: GVA is an intelligent voice-
Participants wanted to restrict Google’s access for 121 activated assistant software that Google introduced in May
(18.08%) out of 669 audio clips and 61 (17.03%) out of 2016 [36]. It allows users to perform a variety of actions
358 transcripts presented in our survey, a non-trivial fraction such as getting local information, playing media, perform-
of all collected data. They had similar preferences for data ing a Google search, managing tasks, and more [49] through
collected by smartphones and smart speakers but felt signif- simple voice-based commands. GVA supports cross-device
icantly less comfortable viewing data elements where they functionality and is available on a wide range of devices such
did not know or could not recall the device through which as smartphones, tablets, smartwatches, TVs, headphones, and
2and enables Google to store transcripts, location, and other
metadata for all interactions). For instance, Kröger et al. dis-
cussed the threat of unexpected inferences (such as obtain-
ing the speaker’s identity, personality, age, emotions, etc.)
from audio recordings stored by microphone-equipped de-
vices through voice and speech analysis [31]. The two major
classes of entities that can cause privacy violations with col-
lected VA data are (i) the technology companies who own the
voice assistants and store data on their servers (e.g., Google,
Amazon, etc.), and (ii) external third parties with access to
collected VA data, upon which technology companies might
rely to review collected data. These two entities comprise our
threat model.
Managing privacy of VA-collected data: A possible alter-
Figure 1: GVA interface on an Android smartphone. native to prevent privacy violations is limiting and control-
ling the data collected by voice assistants. Over the years,
researchers have proposed several techniques for this pur-
more [49]. As of 2020, GVA is available on more than 1 bil- pose, involving both hardware and software. Champion et
lion devices, spread across 90 countries and supports over al. developed a device called the Smart2 Speaker Blocker
30 languages. It has more than 500 million monthly active to address the privacy and security concerns associated with
users [12], reflecting its immense popularity. Figure 1 shows smart speaker use [16]. The device functioned by filtering
a visual of the GVA interface and some functionalities. and blocking sensitive information from reaching the smart
While most users of VAs use them on smartphones, tablets, speaker’s microphone(s). However, such an intervention can-
and smart speakers [15], recent privacy studies have been not be used in the case of smartphone-based voice assistants
paying increased attention to concerns surrounding the use since smartphones are portable devices. Vaidya et al. pro-
of smart speakers [45], primarily because they are always lis- posed another technique to limit privacy concerns (such as
tening devices. However, several works point out the popular- voice spoofing) by removing certain features from a user’s
ity of VA residing in smartphones which can capture more voice input locally on the device [52]. Qian et al. addition-
diverse contexts and potentially private data. This work fo- ally presented VoiceMask, a robust voice sanitization and
cuses on GVA, which runs on both smart speakers and smart- anonymization application that acts as an intermediate be-
phones. tween users and the cloud [47]. Earlier work also devel-
oped a user-configurable, privacy-aware framework to de-
Privacy concerns with VAs: Privacy concerns surrounding
fend against inference attacks with speech data.
voice assistants have been studied extensively. Several re-
searchers have proposed different approaches to launch pri- While these techniques may be effective in checking pri-
vacy attacks against voice assistants [5, 14, 58, 59]. Schon- vacy concerns, a significant downside is that they modify the
herr et al. explored the accidental triggering of voice assis- collected data, rendering it unusable by developers. This de-
tants [50], and Edu et al. conducted a detailed literature re- feats the purpose of collecting data in the first place since
view of Smart Home Personal Assistants (SPA) from a secu- voice assistant developers need user data to train better ML
rity and privacy perspective [22]. They highlighted several models and improve their services. Tabassum et al. presented
key issues such as weak authentication, weak authorization, this as a privacy-utility trade-off, suggesting the development
profiling, etc. Edu et al. also studied various attacks on SPAs, of privacy frameworks that allow users to control the amount
suggested countermeasures, and discussed open challenges of data collected by the voice assistant (in exchange for pos-
in this area. Courtney further summarized various privacy sibly limited services) [51]. The survey conducted by Malkin
concerns associated with voice assistants [19]. et al. on understanding the privacy attitudes of smart speaker
users also highlighted a demand for effectively filtering ac-
In recent years, there have been multiple instances of data
cidental recordings and sensitive topics [38]. We take a first
leaks associated with voice assistants managed by promi-
step in this direction by exploring a human-in-the-loop de-
nent technology companies [41, 44]. Such data leaks can
sign to identify and recommend sensitive data to GVA users.
be a huge cause of privacy concern since VA collected data
can include sensitive data such as audio recordings, location Privacy dashboards: Following up on the recommenda-
data, etc. Specifically, one interaction with GVA can lead to tions made by the Abramatic et al. for better user privacy con-
multiple data elements—audio clip, transcript, and location— trol [3], Irion et al. advocated the use of privacy dashboards
depending on the controls set in Google-wide settings (e.g., as a practical solution to enhance user control for data col-
Web & App Activity control, which is turned on by default lected throughout the online and mobile ecosystem, includ-
3ing platforms such as GVA [29]. They also highlighted the
potential of AI techniques and methods to users manage and
enforce their privacy settings. In this area, Raschke et al. pre-
sented the design and implementation of a GDPR-compliant
and usable privacy dashboard [48]. In fact, to that end, Feth
et al. proposed generic requirement and quality models to
assist companies with developing privacy dashboards for dif-
ferent domains [26]. Our research is motivated by this prior
work on the importance of privacy dashboards—we aim to
uncover the efficacy and possible improvement of today’s
privacy dashboards by specifically focusing on a deployed
system in our real-world data-driven study.
Figure 2: Three key sections of our study—generic Survey 1,
Google My Activity data dashboard: The Google My Ac-
ethical data collection and personalized Survey 2.
tivity dashboard is the primary data privacy control provided
by Google for all its products and services. It is a hub where
users can see and modify all of the key information that help of a short screening survey (Appendix A.1) which took
Google has been collecting about them over the years [46]. less than a minute with Prolific-suggested compensation of
Figure 13 (Appendix) shows the user interface of the Google $0.11 to identify potential participants. Ultimately, we in-
My Activity dashboard. Since GVA’s launch in 2016, not vited 249 participants (who satisfied our inclusion criteria)
much work has been done on studying user perceptions and for participating in our actual two-part study. Survey 1 and
the utility of such data dashboards to manage data privacy. Survey 2 of our study (seven days apart) took a total of 52
A recent and closely related study [25] investigated user minutes and 42 minutes on average, respectively. We com-
perceptions and reactions to the Google My Activity dash- pensated participants who completed both the parts with $12
board. Through a survey, this study showed that viewing ($5 for part 1 and $7 for part 2). In total, 80 participants
the My Activity dashboard significantly decreases concern completed both surveys (out of 119 who responded to our
about Google’s data collection practices. However, the au- initial invitation). This drop in the number of participants
thors were unsure if the dashboard actually provided valu- was potentially due to the task description and eligibility in
able assistance in reviewing the collected data and enforc- the recruitment text. We consider the data from only these
ing user privacy. The first part of our study partially revisits 80 participants in this paper as we wanted to combine data
this work. However, we answer several additional questions from both surveys (and, in effect, connect self-reported gen-
about the perceptions and preferences of GVA users. We also eral perception from Survey 1 with the user feedback on real-
answer some questions raised by this study, such as the effec- world GVA-collected data in Survey 2).
tiveness of the Google My Activity dashboard to enforce user
privacy. We then present a possible solution to improve data
dashboards—through recommending sensitive data elements 3.2 Overview of Study Design
to users. We also demonstrate a highly accurate proof-of-
concept human-in-the-loop-based machine learning model Figure 2 summarizes our institutional ethics committee-
for the same. approved study procedure. The study consisted of three main
sections- (i) generic Survey 1, (ii) Ethical GVA data collec-
tion and (iii) personalized Survey 2. First, participants were
3 Methodology explained the study design as well as the exact data they
needed to share. The participants who gave us informed con-
We conducted a two-part survey-based user study to unpack sent first took the generic Survey 1. This survey contained
perceptions and privacy preferences regarding GVA. generic questions (instrument in Appendix A.2) regarding
user knowledge and usage of Android smartphones as well
3.1 Recruitment and Inclusion Criteria as GVA. After completing Survey 1, participants installed
a browser extension developed by us for ethical GVA data
We deployed our study in the crowdsourcing platform Pro- collection. Our extension worked entirely on the client-side
lific Academic [2] during September 2020. We recruited 18+ and helped users create an archive of GVA data and upload
years old US nationals with >95% approval rating on Pro- it to their own Google account. Then, the participants man-
lific. Additionally, we required that our participants primarily ually shared a link to the online archive with us. Next, we
used an Android smartphone, used GVA more than once per leveraged an end-to-end fully automated pipeline to fetch
month in the past year, and were willing to install our browser participants’ shared GVA data and processed the data in a
extension to share their GVA-collected data. We took the secure computer. No researcher ever manually saw or ana-
4lyzed the raw data. This processing phase identified possi- users along with their downsides—a client-side data-analysis
bly sensitive data elements collected by GVA. Then, within approach was infeasible due to the scale of data and com-
seven days of completing Survey 1 and sharing data, we in- putation, a Google password sharing approach encouraged
vited the participants to return for a personalized Survey 2 oversharing private data, and approaching Google to analyze
(instrument in Appendix A.3). In Survey 2, we elicited user user data and performing our study could potentially be per-
perceptions of a stratified sample of these possibly sensitive ceived as diminishing user agency. We finally asked our par-
data elements. Since Survey 2 was generated programmati- ticipants to use Google Takeout 1 , create an archive of only
cally for each participant using elements in their own GVA- GVA data by selecting specific options in the Google Take-
collected data, we refer to it as a “personalized survey”. We out interface, and share the archive file with us after review-
also showed each participant all of their possibly sensitive ing the data. We created a Firefox browser extension to fa-
data elements identified by our data processing pipeline in a cilitate data collection—(i) The extension automatically se-
personalized Google Drive folder (with named files and sub- lected the right options in the Google takeout interface (in
folders for categories) created by us. Finally, we asked the client browser) to create an archive with only GVA data by
participants about the utility of automatically detecting sen- choosing the right options in the Google Takeout interface.
sitive GVA-collected data elements. Next, we explain each This approach diminished the chances of oversharing (e.g.,
of the three sections of our study. chances of accidentally adding all their emails). (ii) The ex-
tension automatically selected the option provided in Google
Takeout to create an archive in a user’s own Google cloud
3.3 Survey 1
storage 2 (associated with Google account). A participant
Our participants provided their online informed consent be- shared their unique link with us to allow processing of their
fore starting Survey 1. In the consent form, we highlighted archive file.
the purpose of our study, the specific data we would ask to Ensuring privacy of our collected data: In our protocol,
share, and our privacy-preserving data collection and pro- participant GVA data could only be accessed using unique
cessing approach. Then, in Survey 1, we first asked partici- individual links Moreover, we informed the participants that
pants some general questions to uncover their usage of An- they could revoke access anytime, All GVA-collected data
droid smartphones and GVA. Next, drawing from earlier was anonymous since it did not include any email or names
studies on privacy concerns surrounding voice assistants, we of users. On receiving a link, an automated pipeline checked
designed a set of GVA usage scenarios to ground the user the validity of the data (using data type and folder structure of
and uncover experiences with sensitive and even privacy- the shared data) and invited only participants with valid data
violating data collected by GVA [9, 35, 38]. These scenar- for Survey 2. All data processing was automated (no man-
ios ranged from “Using inappropriate language” and “Us- ual exploration of raw GVA-data) and was done in password-
ing GVA in places with audible background sounds” to “Ac- protected computers accessible only to the researchers.
cidental activation of GVA” (complete list in Table 11 of
Appendix D). Then, our participants self-reported whether
they recalled using GVA in these scenarios and their com-
3.5 Survey 2
fort in such contextual GVA usage. After this, participants re- Our personalized Survey 2 primarily involved eliciting user
sponded to questions about their perceptions regarding GVA reactions regarding specific data elements collected and
data collection (in general and under different transmission stored by GVA. We start with our data processing pipeline
principles [6]), storage, and access, including a few questions to select data elements for Survey 2.
specifically about Google My Activity dashboard. Finally, Creating a classifier to categorize data elements: We iden-
we concluded Survey 1 by asking questions related to gen- tified (and leveraged in Survey 1) a set of privacy-violating
eral privacy attitudes. scenarios where according to earlier work, potentially sensi-
tive data might be collected by GVA [9,35,38]. We analyzed
3.4 Ethical Collection of GVA Data these scenarios to create twelve classes that encompass po-
tentially sensitive GVA-collected data elements. These data
Given the sensitive nature of the GVA-collected data ele- elements were broadly of two types—GVA-collected audio
ments, we wanted to collect it in the most ethical manner pos- clips and transcripts of the commands given to GVA. Aside
sible, as we will describe next. Our data collection protocol from these twelve classes, we considered three additional
and analysis plan were thoroughly evaluated and approved classes—a separate class “location” for location data, and
by our Institutional Ethics Committee (equivalent to an IRB). two separate classes (“audio-rand” and “transcript-rand”)
Participants were briefed about the data collection process
1 A Google service that enables users to export part or all of data elements
through the consent form at the beginning of the study.
stored in Google servers in an archive file [55].
Deciding on an ethical data collection protocol: We ex- 2 We took due consent to store and share this data in participants’ per-
plored several options to collect GVA data ethically from sonal cloud storage. The consent form is in Appendix A.2.
5Class Description med. # Prolific.
audio-noise Audio with high background noise 3
audio-non-bkgd Audio with low background noise 94 Overview of Survey 2: We created a personalized Survey 2
audio-multi- Audio with multiple speakers 36 (instrument in Appendix A.3) for each participant using at
spkr most fifteen selected data elements, depending on the pres-
audio-non-gend Audio with non-dominant gender 57
speaker
ence/absence of a particular class. During the survey, we first
audio-grammar Audio with grammatical error 9 showed these data elements randomly to the participants and
audio-non-eng Audio with non-standard English 51 correspondingly asked some related questions, e.g., what are
word the contents of the data element and how comfortable is the
audio-regret Audio with regret word 25
participant in sharing it with people in different proxemic
audio-neg-sent Audio with negative sentiment 32
audio-rand Audio not in the above categories - zones [28] as well as Google. Note that participants were
transcript-typo Transcript with grammatical error 5 not provided with any clue about the possibly sensitive na-
transcript-non- Transcript with non-standard English 28 ture of these data elements at this stage of Survey 2. Next,
eng word we gave participants a brief explanation of the respective
transcript-regret Transcript with regret word 20
transcript-neg- Transcript with negative sentiment 19
classes from which the data elements for their personalized
sent survey were selected. The participants also rated the accu-
transcript-rand Transcript not in the above categories - racy of those explanations. Then, to demonstrate the possible
location Location data (e.g., latitude-longitude) 10 output of automated techniques to uncover sensitive data ele-
ments, we asked participants to review a personalized Google
Table 1: Description of fifteen classes from Survey 2 for clas-
Drive folder with named files and subfolders containing cat-
sifying GVA collected audio clips, transcript and location
egorized possibly sensitive GVA data. Then we asked ques-
data. The last column signifies the median number of data tions to measure user awareness about GVA after seeing this
elements per user for our participants.
folder. We concluded by asking about the utility of an auto-
mated system for detecting sensitive GVA-collected data. In
the end, we gave instructions to uninstall the browser exten-
which identify audio clips and transcripts not belonging to
sion.
any of the twelve classes and act as a baseline for data ele-
ments. These total fifteen classes are presented in Table 1.
We then created automated classifiers to categorize data 3.6 Limitations
elements in each of these classes for each user. These classi- First, our study is limited in recruitment since we recruited
fiers primarily relied on off-the-shelf signal processing (e.g., only US Prolific users who primarily use Android smart-
measuring Signal to Noise Ratio or detecting the number and phones and are familiar with GVA. In other words, we might
gender of speakers) and NLP techniques (finding a grammat- have chosen primarily English speaking users who are also
ical error, non-English word or negative sentiment). We cre- more frequent Android and GVA users than average. How-
ated one binary classifier for each of the above-mentioned ever, US-based users are still an important portion of the
twelve classes in Table 1 (aside from “location”, “audio- GVA user base and any privacy issue uncovered by explor-
rand” and “transcript-rand” classes). These classifiers cate- ing experienced GVA users possibly also affects lesser expe-
gorized GVA-collected audio clips and transcripts into one rienced users. Second, we focused on GVA users who also
or more of these classes. The motivation and detailed descrip- used an Android device as their primary smartphone. Since
tion of each classifier is in Appendix D. GVA is also available in iOS and third-party IoT devices,
Selecting individual data elements for Survey 2: Once we we might have missed those users. However, this is expected
classified each data element into one or more categories (with since, in this study, we aimed to investigate the most promi-
the help of classifiers) from Table 1, we used a stratified sam- nent users of GVA—Android users (GVA is installed by de-
pling approach. In short, we randomly selected one data el- fault in Android, unlike iOS). Consequently, some of our sur-
ement from each category (without replacement) and used vey participants’ perceptions about data collection might not
them to create the Survey 2 questionnaire. We also created be representative of data collected by other voice assistants,
a personalized Google Drive folder for each participant to which might be used in a different context (e.g., a voice as-
review in Survey 2. The folder contained all possibly sen- sistant integrated into a children’s toy Third, a few of our
sitive data elements found in their GVA data, arranged in participants might consider some of our questions as prob-
thirteen respectively named files and subfolders (excluding ing based on both language of the question and their prior
“audio-rand” and “transcript-rand” categories). Note that our experience—introducing bias in some of our self-reported
pipeline handled all of the above tasks automatically. Once data-based results. Lastly, our results might have underes-
personalized Survey 2 was generated, one researcher manu- timated privacy needs as very privacy-sensitive individuals
ally invited the corresponding participant (within seven days would be unlikely to participate in a study that aimed to inves-
of data upload) to participate in Survey 2 via messaging on tigate their GVA data. Not covering such privacy-sensitive
6individuals is a common concern with user studies related Basic demographics: Our participant pool had a slight gen-
to privacy [40]. However, we strongly feel that this work is der bias—68.8% self-identified as male, 30% as female, and
still valuable since we unpack common privacy perceptions 1.2% as non-binary. In terms of age—30% were 18-24 years
of GVA users regarding their data and identify possible av- old, 31.3% were 25-34 years old, and 26.3% of the par-
enues to improve data dashboards and simplify privacy con- ticipants were between 35 and 44 years. Our participants
trols for this data. self-identified themselves with several ethnicities—66.3%
reported themselves as White, 13.8% as Asian or Pacific
Islander, 8.8% as Black or African American and 6.3% as
4 Data Analysis Hispanic or Latino. The rest had mixed ethnicity. The ma-
jority of our participants were employed—47.5% employed
We performed both quantitative and qualitative analyses of full-time and only 20% identified as students. In our sam-
participants’ survey responses. In this section, we briefly ple, 53.75% of participants had a bachelor’s degree or higher,
elaborate on our data analysis process. and only 30% were associated with computer science or a re-
Qualitative open coding: We performed qualitative open lated field. Overall, our participants came from a wide demo-
coding to analyze free-text responses [33]. First, an author graphic spread.
analyzed the responses to each question and created a code-
Usage of Android smartphones: Even though we did
book. Next, two researchers independently coded the re-
not specifically attempt to recruit long-time Android users,
sponses using this shared codebook. Across all questions, Co-
91.3% of our participants reported using an Android smart-
hen’s kappa (inter-rater agreement) ranged from 0.769 to 1.0
phone for three years or more. Furthermore, 90% of partici-
signifying near-perfect agreement. At last, the coders met to
pants also mentioned using their current Google Account on
resolve disagreements and finalized a code for each response.
Android smartphones for three years or more. We had an ac-
Quantitative statistical analysis: To gain more insight into tive Android-user sample— 61.3% of participants used their
the collected quantitative data, we performed several statis- smartphones daily for 2 to 6 hours and 26.3% for 6 to 10
tical tests [21, 23]. When the independent variable was cate- hours and 6.3% daily for more than 10 hours. The partici-
gorical, and the dependent variable was numerical, we found pants used different smartphone applications—54.5% partic-
all distributions were non-normal (using the Shapiro Wilkes ipants had more than 50 apps on their phones at the time
test) and nearly all independent variables with more than two of the study. The majority of our participants were familiar
levels. Therefore, we decided to opt for the Kruskal Wallis with advanced Android features such as rooting, developer
test for comparing distributions in such cases. When both in- options, and launchers (over 70% participants for each). In
dependent and dependent variables were categorical, we used our sample, 87.5% of participants owned devices running re-
either the χ2 test or Fisher’s exact test (when individual cell cent Android versions (9 or 10) manufactured by nine differ-
values in the contingency table were < 5) to find significant ent manufacturers. Overall, our participants were long term
correlations. We also used difference in proportions as a mea- Android users, well aware of advanced features, and had mod-
sure of effect size in our analysis. Apart from statistical tests, erate to high daily usage.
we used standard evaluation metrics such as accuracy, preci-
sion, and recall to test our prediction model [4, 11].
5.2 Characterizing GVA usage (RQ1)
5 Results In this subsection, we present results on general usage pat-
terns of GVA as well as the context for such usage.
In this section, we present results from our study on under- General usage: 72.5% of our participants were long-time
standing user perceptions and privacy preferences regarding GVA users, with 43.8% participants using GVA for three
GVA data. Unless otherwise specified, results in this section years or more, and 28.8% using it for two years and 17.5%
will correspond to self-reported data and not actual usage for a year. In terms of usage frequency, 43.8% of participants
data. In specific analyses (e.g., sharing comfortability) in- used GVA at least once a day, 30% used it a couple of times
volving audio clips and transcripts from Survey 2, we some- per week, and the remaining 26.2% of participants used it
times discounted very few elements due to lack of user feed- once a week to a couple of times per month. Participants used
back. different methods to activate GVA (with some using multi-
ple methods)—76.3% of participants used a hotword (e.g.,
5.1 Participants “OK Google”), and 56.3% activated GVA by touching, press-
ing, or holding buttons on their device. Interestingly, 97.5%
A total of 80 participants completed both Survey 1 and Sur- of participants used GVA in three broad zones: home, of-
vey 2. We start by checking the basic demographics of those fice, and car encompassing both professional and personal
participants in this section. lives. Additionally, 38.8% of participants also reported using
7Data element Total Min. Median Max. Data Type Description
# Audio w/ transcript 83,635 12 354 19,451 audio Audio clip of conversation
# Only transcripts 55,243 0 273.5 4671 transcript Transcript of conversation
# Ambient location 84,309 1 407.5 12,504 location Ambient location at the time of use
Total # data elements 138,878 16 837.5 22,073 date Date of conversation
Age of data (yrs.) NA 1 3 8 epoch Time of conversation
noti Notifications sent by GVA
Table 2: Overview of participants’ GVA data. trig Activation method (w/ or w/o hotword)
Table 3: Types of data collected by GVA
Google smart speakers. Using actual usage data collected in
part 1 of the study (as described in Section 3.4), we found
that interactions with GVA resulted in 138,874 data elements
5.3 User Perceptions of GVA Data (RQ2)
stored in Google’s servers. The median participant had 837.5 Next, we check whether participants understood how Google
data elements, signifying non-negligible usage of GVA. An handled any GVA-related data. Specifically, we investigate
overview of participants’ GVA data is in Table 2 and year- user perceptions regarding GVA data collection and storage
wise statistics are in Table 10 (Appendix C). using data from Survey 1.
Understanding context of GVA usage: To understand the Perceptions of overall data collection: First, we identified
context for using GVA, we analyzed participant responses to (using the Google account of the authors) that there are seven
the question-For what purposes do you use Google Assistant different types of data collected (at most) by GVA. We ver-
on your Android smartphone? from Survey 1. The common ified these types in our automated data collected phase too.
reasons for using GVA were getting local information (50), Table 3 shows the seven different types of data collected
communicating with others (29), resolving a query (28), play- (at most) by GVA. The top three are the most obviously
ing audio and video files (27), navigating through devices sensitive data types (audio, transcript, location), whereas the
(25), controlling other devices (24), entertainment such as rest can be considered metadata. Recall that we referred to
games, jokes, etc. (16), and planning their day (14). Thus, these three obviously sensitive data types as data elements
participants used GVA for a wide number of purposes. in this work. To understand the awareness about GVA data
collection, we asked participants-Do you think that Google
Usage of GVA in smartphones: For each of the 1,027 data Assistant on your Android smartphone collects any kind of
elements (audio and transcript) presented in Survey 2, we data while you are using it? in Survey 1. 78.8% of our par-
asked participants to choose the device that, according to ticipants responded affirmatively with “Yes”, and an addi-
them, collected each data element (GVA can run in multi- tional 20% responded “Maybe”, signifying the participants
ple devices). Participants reported that 494 (73.9%) out of are well-aware of possible data collection by GVA.
668 audio clips were collected by GVA installed on smart-
Perceptions of specific data collection: However, then we
phones, whereas smart speakers collected only 92 clips, in-
dug deeper and asked -What pieces of data do you think are
dicating a bias towards smartphones for GVA usage. For a
collected when you use Google Assistant on your Android
non-trivial 81 clips, participants either did not recall or even
smartphone?, showing participants the list given in Table 3.
did not know. The results are similar for transcripts where
Most participants expressed that GVA collected data such
229 (63.78%) out of 359 transcripts were collected by GVA
as the date (89.1%) and time (85.7%) of conversations as
on smartphones, and smart speakers collected 57 transcripts;
well as the activation method (81.5%). Interestingly, com-
the participants could not recall or didn’t know the source for
paratively fewer participants were aware that GVA collected
the rest. Thus, most data elements presented in Survey 2 were
sensitive data types such as the transcripts of conversations
collected by GVA on smartphones. We note that this bias to-
(73.9%) and the ambient location (70.58%). Just 61.3% of
wards GVA use on Android smartphones could be because
participants believed that GVA collected audio clips of con-
of our inclusion criteria since we recruited users of Android,
versations, implying that a non-trivial 38.7% of users were
which has GVA pre-built into it. Still, our finding hints at an
unaware about the collection of audio clips by GVA.
important domain of heavy data collection by GVA on smart-
phones in a wide variety of contexts. Correlation between awareness of data collection and
comfort in sharing data with Google: Next, we asked par-
Summary: 73.8% of our participants used GVA frequently ticipants to indicate how comfortable they would feel if GVA
(at least a couple of times per week or more). The majority collected data from each of the seven data types. The top
of GVA usage happened in smartphones in multiple contexts, three data types where most participants felt most uncomfort-
and our median participant contributed a total of 837.5 data able to share with Google were audio clips of conversations
elements. The median age of GVA data was 3 years. (58.8%), transcripts of conversations (45.4%), and ambient
8the type of data stored was lacking—a non-trivial fraction
was unaware of the collection of sensitive data types. In
fact, the participants were uncomfortable sharing the data el-
ements they were not aware GVA was collecting (e.g., audio
clips).
5.4 Unpacking Preferred Access Control for
Google to Collect GVA Data (RQ2)
Most participants were aware that Google collects and stores
some data using GVA in their servers. Thus, we investigated
the desired access control rules for Google in the context
of specific classes of GVA data elements. We analyzed par-
ticipant responses to this question in Survey 2 for specific
data elements—After going through the audio clip/Google
Assistant command, how comfortable would you feel if some-
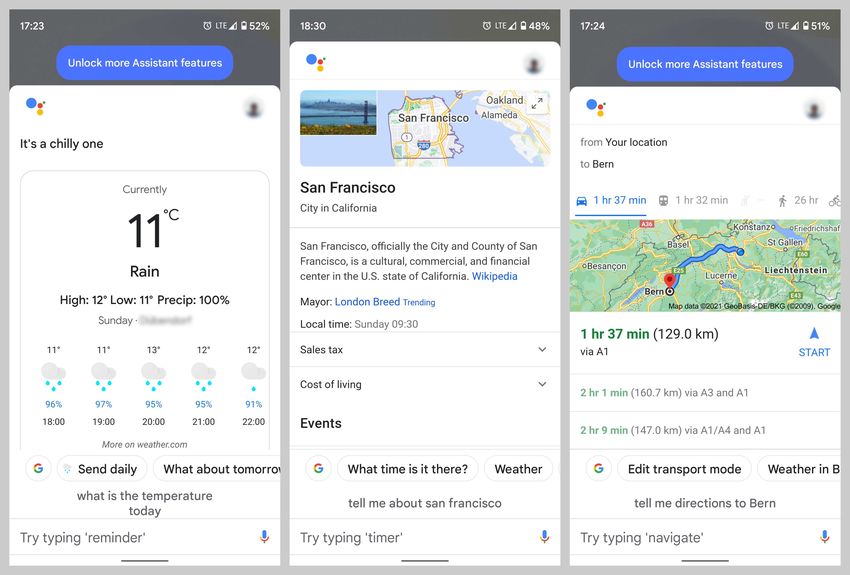
Figure 3: Participant awareness of collected data types and one in your intimate/private/social/public relations/Google
comfort in sharing them with Google. Data types perceived heard it/came to know about it?. This question checked the
to be collected/not-collected correlated with participant com- sharing (i.e., access control) preferences for GVA data with
fort in sharing with Google (Fisher’s exact, p < 0.0001). people in four proxemic zones–intimate, private, social pub-
lic [28] as well as Google. Then, we used statistical analysis
to check the proxemic zone closest to Google in terms of
location (45.4%). The top three data types where most par- these sharing preferences. A Fisher’s exact test found that
ticipants felt comfortable with data collection were activation there was a statistically significant correlation between de-
method (66.4%), notifications (56.3%), and time of conversa- sired access rules for Google and all proxemic zones (Fis-
tions (48.7%). Next, to check if the data types that most par- cher’s exact p < 0.05) across all classes of data elements
ticipants felt uncomfortable with being collected were also from Table 1. Then we used difference in proportions as a
the ones participants were least aware of, we performed a measure of effect size on 2 × 2 contingency tables containing
correlation analysis. Figure 3 presents the analysis result— comfort data elements between a proxemic zone and google
participant awareness about the collection of each data type (one table for each class of data element) [23]. For each class,
and their comfort level in sharing the data type positively cor- the zone(s) with the smallest effect size had the closest shar-
related. These results signify that the data types for which ing preference with Google. The average effect size for each
people were less aware of collection (e.g., audio clips), peo- proxemic zone across all classes revealed that participants as-
ple were also less comfortable with them being collected. sociated Google most closely with the public zone (average
This result indicates a superficial understanding of GVA data effect size 0.81) and farthest from the private zone (average
collection. We surmise that this shortcoming might cause effect size 0.92). Table 9 (Appendix C) contains all the effect
a decreasing interest in GVA users to delete the GVA col- sizes.
lected data via existing privacy controls—e.g., deleting or
Summary: Across all specific data elements, our partici-
even browsing their stored data through the data dashboard.
pants expressed that the access control rules for Google
Perceptions of data storage: We asked our participants should be similar to a public entity. To understand how this
Where do you think the data, if collected by Google Assis- observation translates to actual user behaviour, we now ana-
tant on your Android smartphone (and voice-enabled Google lyze user privacy preferences for sharing specific files with
smart speakers) is stored? 86.3% of our participants cor- Google.
rectly responded that the data is stored on Google data stor-
age facilities (servers). However, 10% of participants re-
sponded that the data is stored only on the respective de- 5.5 Desired Privacy Preferences of GVA Data
vice, whereas 3.7% of participants responded that the data (RQ3)
is stored completely or partially in both places. So, the ma- For specific data elements across different classes presented
jority of participants had a clear idea of about data storage in Survey 2, we asked participants if they are comfortable
practices of GVA. sharing specific data elements with Google today.
Summary: Most (78.8%) participants thought that Google Users want to restrict access of Google for specific GVA
collected some data using GVA, and the majority were aware data: Our participants were uncomfortable sharing 121
of where this data is stored. However, their awareness about (18.1%) out of 669 audio clips and 61 (17%) out of 358 tran-
9complex tools to identify such sensitive data elements that
users are uncomfortable sharing.
5.6 Understanding Utility of Data Dashboard
for privacy control (RQ4)
As highlighted in the previous subsection, GVA users wanted
to restrict access to 17.7% of GVA-collected data. Today
the My Activity Dashboard is the only Google-provided way
Figure 4: User preferences for sharing audio clips collected
(aside from legal interventions) for the users to delete this
by different devices with Google. Preferences for transcripts
data (albeit post-facto) and control privacy. Therefore, we
followed a similar trend.
sought to understand user perceptions regarding the utility
of this dashboard.
scripts (presented to them in Survey 2) with Google. These Perceptions of data accessibility: First, we checked
numbers indicate that participants felt uncomfortable sharing whether participants were aware that they could access the
a non-trivial fraction of their GVA-collected data. Next, we data collected by GVA. 61.3% participants believed that the
will check the correlation between this preference with the data could be accessed, while 32.5% responded that it might
medium of data collection and class of data. be accessed, indicating the majority are at least aware of the
possibility of a tool like the data dashboard.
Correlation with medium of data collection: We checked
the correlation between the device of data collection with Popularity and usage of data dashboard: Now, we check
user comfort to share data. Figure 4 presents this result. Our if participants knew about the My Activity dashboard. 40
statistical test did not reveal any significant difference in com- (50%) participants responded that they had heard of it, 10%
fort across data collected via GVA on phones or smart speak- were not sure, whereas a surprisingly high 40% of partici-
ers. However, we did find a significant correlation (p = 0.00) pants had never heard of the data dashboard. Among the 40
between user knowledge of the medium of data collection participants who had heard of the My Activity dashboard,
and user comfort in sharing the data element (both audio and 4 participants had never visited it, and 33 of the remaining
transcript) with Google. Participants felt significantly more 36 participants visited their dashboards less than once per
comfortable sharing data elements where they knew about or month. In effect, only 3 (3.8%) out of 80 participants visited
could recall the origin of the collected data element. Inter- their dashboards more than once a month. According to the
estingly, today, Google My Activity Dashboard only shows 36 participants who had visited their respective dashboards
whether a data element was collected by a Google smart before our study, the top reasons for visiting it were–(i) To
speaker, completely ignoring smartphone devices. Future simply check it out (30), (ii) To view collected data (18), (iii)
dashboard designs could add these missing details to make To change activity settings (11), and (iv) To delete some data
users more comfortable while viewing their data. (9). We asked 50 participants who were unsure/unaware to
visit the data dashboard to check their GVA-collected data
Correlation with auto-detected classes of data element: before continuing with the study.
Participants felt most uncomfortable sharing audio clips con- Unpacking perceptions of data dashboard: Since all par-
taining regret words (24.4% of all elements from that class), ticipants had explored their dashboards at least once by this
followed by audio clips having multiple speakers (21.1%) point in the study, we asked them how comfortable they felt
and transcripts containing regret words (20.8%). However, while viewing the data on their dashboard and why. On a
a Kruskal Wallis test revealed no significant differences be- scale of 1 to 5 (1 being very uncomfortable), the average
tween privacy preferences for data elements belonging to dif- comfortability rating was 3.26 (σ = 1.06, median = 3), indi-
ferent classes. This result implies that perhaps these simple cating that most participants felt neither comfortable nor un-
classes (often based on word matching) were insufficient to comfortable viewing the data. In fact, our qualitative analysis
accurately identify the GVA-collected data elements where revealed that participants had mixed reactions to GVA data
participants wanted to restrict access. presented in the dashboard. 37.5% of our participants were
Summary: Participants want to restrict access for a non- either bothered or surprised by the information collected. For
trivial fraction of their GVA-collected data, which underlines instance, P31 said, “I know that google is collecting informa-
a need to simplify data dashboards for identifying such data tion, but I am not 100% comfortable to see the amount they
elements. Interestingly, showing users the origin of their col- collect. There is really no privacy.” 15% of participants were
lected data made them more comfortable sharing their data. glad that the data was available, and 6.25% of participants
Our simple NLP and signal processing based classes were un- were unsure of their choice. The remaining 41.25% of par-
able to capture sensitive data elements. Thus, we need more ticipants were neither bothered nor surprised. For example,
10P12 told, “I already know Google was collecting all of the 5.7 Moving towards Improving Utility of Data
information I saw.” Using a Kruskal Wallis test (p = 0.029), Dashboards (RQ4)
we found that participants who had heard of the Google My
Activity dashboard before the study were more comfortable Currently, Google’s My Activity Dashboard provides two
(N = 40, µ = 3.525) in viewing collected data, as compared to ways to delete collected data- (i) users can either inspect and
participants who had never heard of the dashboard (N = 32, delete each data element individually, or (ii) delete all data
µ = 2.875). Therefore, participants grew more comfortable elements stored within a specified date-time range. The for-
with the dashboard as they became more familiar with it. Our mer is particularly not useful from a privacy perspective be-
results strongly support the need for data dashboards since cause inspecting a large number of collected data elements
participants feel more in control (and thus comfortable) when (most of which are non-sensitive) is quite time-consuming
they can see and manage their data. and laborious to be practically feasible, as seen in the pre-
vious subsection. On the other hand, the latter can help en-
force privacy but is not a good option for users who might
Understanding usability of data dashboard: To check the want to retain some/all of their collected data for future refer-
usability of the data dashboard, we asked our participants ence, assisting product development, etc. To assist users with
the question-How easy was it to reach and find what you finding their possibly sensitive data collected by GVA, we
were looking for?, using a 5-point scale (1 being very dif- did a simple proof-of-concept test—around the end of Sur-
ficult and 5 being very easy). The average rating was 4.025 vey 2, we showed them a personalized Google drive with
(σ = 0.899, median = 4). Thus, most participants found My data elements divided into subfolders according to their auto-
Activity Dashboard easy to reach. To get a better idea of any detected classes from Table 1 (with classes as subfolder
difficulties faced by participants during navigation, we then names) and asked if a system which can show such classi-
asked them the question-Did you face any difficulties or prob- fications will be useful. Recall that these classes were con-
lems in navigating through your Google My Activity Dash- structed with privacy-violating scenarios in mind, and hence
board? Qualitative analysis showed that 8 (10%) out of 80 some of the data elements were expected to be sensitive.
participants found it hard to navigate through the dashboard
Recommending elements in data dashboards: After par-
to find their data. For example, P62 said, “There is so much
ticipating in the study, 56.3% of participants reported that
data it is a little overwhelming.” 2 participants did not check
they were very likely to delete some of their data collected
their dashboards, and 1 participant faced some problems with
by Google. 65% of participants said that our classifier pro-
navigation but did not elaborate on it. The remaining 69
vided valuable assistance in finding sensitive data on Google
participants did not report any difficulties with navigation.
servers, and 72.5% told that they would recommend others to
16.25% of participants said they would like some assistance
try it out if made publicly available. This percentage was 50%
in using the dashboard, and another 10% told that they might
higher than the 27.5% of participants who expressed a need
want some assistance. The remaining 73.75% of participants
for assistance in finding sensitive data on Google servers in
indicated that they would not like any assistance. We found a
Survey 1, indicating a strong demand for such a recommen-
positive correlation (Fisher’s exact test, p = 0.048) between
dation system in data dashboards.
the duration of using GVA (less or more than around 2 years)
with the need for assistance in using the dashboard, highlight- The efficacy and challenge in providing recommenda-
ing a possible cognitive overload for long-time GVA users. tions: The primary challenge that we faced while developing
our sensitive content detection system was related to the ac-
curacy of the system in assigning classes to the data elements.
Summary: We found an interesting knowledge gap within On a 5-point Likert scale (1 is very inaccurate and 5 is very
our participants—93.8% of participants thought their GVA- accurate), the average rating provided by participants to our
collected data can or may be accessed. However, only 50% classifier was just 2.67 (σ = 0.96, median = 3), suggesting
of the participants were aware of the data dashboard, show- that most participants did not find it highly accurate. Addi-
ing a lack of actionable knowledge. Even the people who tionally, 20 participants provided qualitative feedback regard-
knew about data dashboards, just 3.75% visited it regularly. ing the study. 9 out of these 20 participants pointed out that
In fact, more than one-third participants (37.5%) felt both- the system accuracy could be improved. For example, P60
ered or surprised while viewing the collected data. Quite as- stated: “Overall I found the sensitive content system not to
suringly, most participants found the dashboard easy to use; be very accurate. It some cases it was correct, but in more
however, 10% of participants also found it difficult to access cases it was rather incorrect.” Despite the low perceived ac-
their data. We observed that more long-time GVA users ex- curacy of the classification, we found it surprising that 65%
pressed a need for assistance in using the dashboard, suggest- of participants found it useful to find sensitive content. P71
ing the more they become familiar with the dashboard, the further explained the connection between classification accu-
more overwhelmed they might get with the huge data col- racy and helpfulness of our recommendation system: “Per-
lected by GVA over time. haps try improving the accuracy. I noticed that while it did
11You can also read