Understanding attitudes and perceptions of cycling & walking - WAKA KOTAHI - FEBRUARY 2021
←
→
Page content transcription
If your browser does not render page correctly, please read the page content below

FEBRUARY 2021

Understanding
attitudes and
perceptions of
cycling & walking
WAKA KOTAHI

WAKA KOTAHI 2

          BACKGROUND OF OUR RESEARCH PROGRAMME

          This study provides a way              Increasing the share of travel by public transport, walking and
                                                 cycling in New Zealand’s cities has a critical role to play in improving

          of monitoring attitudes and            the wellbeing of New Zealanders by creating more accessible and
                                                 inclusive cities that are prosperous, safe, healthy, and sustainable.

          behaviours around walking
                                                 The government aspires to provide genuine travel choices as a key
                                                 way to improve access to social and economic opportunities.

          and cycling, in response to            Over the last six years, Waka Kotahi and our council partners have
                                                 significantly increased investment in improving the quality and

          ongoing efforts to improve             quantity of walking and cycling facilities and programmes to support
                                                 their use. While there is a high overall level of car use in our cities,

          our cities for people getting
                                                 public transport and active modes already play an important role
                                                 in meeting some of the country’s most critical transport tasks –
                                                 especially at peak times. In recent years, there has been significant

          around on foot or by bike              growth in the use of these shared and active modes in our cities but
                                                 there remains a need to do much more.

APPROVED FOR PUBLIC RELEASE © TRA 2021
WAKA KOTAHI 3

          Revisiting the                 1   Measure and monitor walking and cycling behaviour.
                                             • Comparing results over time (2020 vs 2019 & 2018).

          primary objectives                 • Comparing results across main urban centres.

          of the research                2   Understand attitudes and perceptions towards walking,
                                             cycling, and recent investments and initiatives.

          programme
                                         3   Identify opportunities to increase the number of trips,
                                             and the proportion and diversity of people traveling by
                                             active modes.

APPROVED FOR PUBLIC RELEASE © TRA 2021
WAKA KOTAHI 4

          The approach
          Monitoring the effectiveness of the Urban Cycling Programme roll-out by measuring behaviour
          and understanding attitudes and perceptions around urban walking and cycling.

          A 15-minute online survey           Fieldwork ran from May 28th             Interlocking quotas
          of n=2,256 New Zealanders           2020– June 30th 2020                    were utilised
          With a focus on key regions of:     Invitations were sent daily             Age and gender within each
                                              over the fieldwork period, to           region, to ensure data is
          •     Auckland n=596                ensure there was no bias due            representative according
          •     Wellington n=543              to weather conditions.                  to Stats NZ 2018 census.
          •     Christchurch n=502
          •     Hamilton n=209                                                        Post fieldwork, the data was
          •     Tauranga n=204                                                        weighted according to age/
          •     Dunedin n=202                 Fieldwork was completed via             gender.
                                              an online survey using Dynata’s
          Margin of error at a 95%            research panel
          confidence interval on              Respondents on the panel
          sample of:                          were invited to participate in a
          • n=2,256 +/-2.1%                   survey; they were not told the
          • n~500 is +/-4.4%                  subject of the survey prior to
                                              starting, as per industry best
          • n~200 is +/-6.9%
                                              practice, to avoid any self-
                                              selection bias.

APPROVED FOR PUBLIC RELEASE © TRA 2021
WAKA KOTAHI 5

          Changes to the survey
          IMPACT COMPARISON OVER TIME

          In 2020, there have been some improvements made to questions
          and question order. Changes include clarification of response
          options and rationalisation of questions to prevent people
          needing to answer similar questions. It is also important to note
          that the question order was changed to ensure questions are
          asked in a logical flow in line with travel behaviour.

          The change in question order and questions means that the
          direct comparability of results is impacted. Where question
          wording and response options are the same comparisons have
          been included, and any impacts of the changes have been
          highlighted.

          For ongoing measurement, all results will be able to be
          compared to 2020.

APPROVED FOR PUBLIC RELEASE © TRA 2021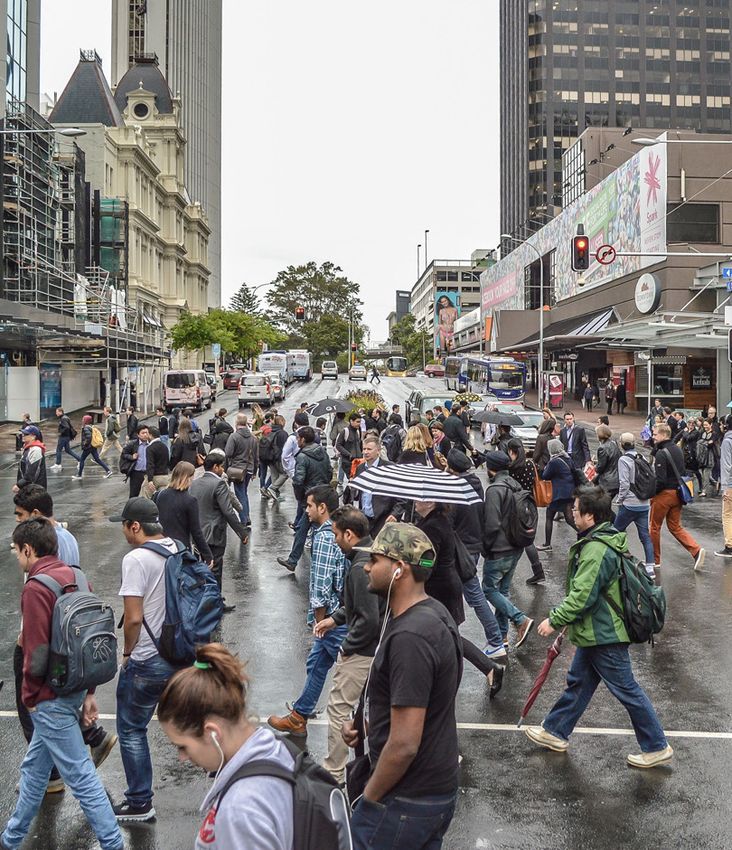
WAKA KOTAHI 6

                                Summary: Key findings

APPROVED FOR PUBLIC RELEASE © TRA 2021
WAKA KOTAHI 7

          Summary: Overall

          CONTEXT                                                            OVERALL TRAVEL BEHAVIOUR
          Fieldwork was conducted 28 May                                     Regular use                               Trips
          to 30 June, during Covid-19 Alert
          Levels 2 and 1.                                                    •   Active modes* are used on a           •   Walking and cycling (including
                                                                                 regular basis (at least once a            e-bike) make up 36% of all trips
          Covid-19 has impacted how New                                          week) by almost three quarters            made in a given week. However,
          Zealanders move around their cities                                    (71%) of urban New Zealanders.            New Zealanders continue to be
                                                                                                                           reliant on their cars, with private
                                                                             •   68% are walking on a regular
          •     During the fieldwork period, daily                                                                         motor vehicles accounting for
                                                                                 basis which has increased since
                essential journeys have started to                                                                         49% of trips.
                                                                                 2019 (up from 60%).
                return to what they were during
                the initial Level 1 period. However,                         •   Regular use of bikes (including
                there are still some journeys which                              e-bikes) hasn’t yet seen a shift
                have remained much behind                                        and is stable at 13%.
                stated pre-lockdown rates.
                                                                             •   Whilst there have been positive
                                                                                 shifts for walking, there has also
                                                                                 been an increase in regular use of
                                                                                 motorised vehicles (private motor
                                                                                 vehicle, taxi/ride share, motorbike
                                                                                 or scooter). 77% use motorised
                                                                                 vehicles on a regular basis (up
                                                                                 from 70% in 2019).
          *Active modes include use of walking, bicycle, e-bike, e-scooter

APPROVED FOR PUBLIC RELEASE © TRA 2021
WAKA KOTAHI 8

          Summary: Walking

          SUPPORT FOR WALKING                       SAFETY AND                             TRAVEL BEHAVIOUR
                                                    INFRASTRUCTURE
                                                    PERCEPTIONS
          •     Perceptions of walking and          •   For walking there are fewer        •   Walking is an activity most
                cycling as ways of getting around       perceived barriers than for            people do with 76% of urban
                are positive. 73% of urban New          cycling but there are more basic       New Zealanders walking* in the
                Zealanders view walking as a            preconceptions to overcome;            last 12 months.
                great way to get around town            such as people don’t have
                                                                                           •   70% of New Zealanders are walking
                easily and efficiently.                 enough time to walk or they live
                                                                                               for commuter trips including to/from
                                                        too far from destinations for
                                                                                               work or study or to get around town.
                                                        walking to be practical.
                                                                                               21% are committed commuters and
                                                    •   Overall, perceptions of safety         are walking for these trips most days.
                                                        are strong with 86% viewing
                                                                                           •   The level of walking differs at
                                                        walking as safe in their region.
                                                                                               a regional level; Auckland and
                                                        However, safety perceptions drop
                                                                                               Hamilton have the lowest levels
                                                        when walking at night (52%) and
                                                                                               of walking, while Wellington has
                                                        around cyclists on shared paths
                                                                                               the highest.
                                                        (56%).
                                                                                           •   For walking, the challenge is less
                                                    •   Safety is more of a concern for
                                                                                               about getting people to walk in
                                                        Auckland walkers compared to
                                                                                               general but enabling walking as an
                                                        other urban centres.
                                                                                               option to replace trips which would
          *walking 100m or crossing the road.
                                                                                               otherwise be taken by vehicle.

APPROVED FOR PUBLIC RELEASE © TRA 2021
WAKA KOTAHI 9

          Summary: Cycling

          SUPPORT FOR CYCLING                       SAFETY AND INFRASTRUCTURE PERCEPTIONS                                             TRAVEL BEHAVIOUR
          •     Perceptions of walking and          •   Safety continues to be a key          •   Infrastructure helps to create      •   One quarter of urban New
                cycling as ways of getting around       barrier to cycling. Safety                a safe environment for both             Zealanders (24%) have cycled
                are positive. 60% of urban              perceptions of cycling are at             cyclists and non-cyclists. Safety       in the past year and 20% are
                New Zealanders view cycling as          much lower levels than walking.           perceptions increase when there         riding for commuter trips. Overall
                a great way to get around town          Overall, 56% of urban New                 is a greater separation between a       cycling numbers remain stable.
                easily and efficiently.                 Zealanders feel that they are,            vehicle and cyclist.
                                                                                                                                      •   The level of cycling differs at a
                                                        or would be safe cycling.
                                                                                              •   Those who ride more frequently          regional level; Auckland has the
                                                    •   Since 2019, there has been an             are more satisfied with the             lowest level of current cyclists,
                                                        increase in safety overall - across       current cycling infrastructure,         while urban cycling shows
                                                        quiet local roads, reduced speed          while recreational riders have          strength through Hamilton,
                                                        zones, public roads (with or              lower satisfaction.                     Tauranga and Christchurch.
                                                        without painted cycle lanes)
                                                                                                                                      •   For cycling it is about
                                                        and on footpaths.
                                                                                                                                          encouraging people to take up
                                                                                                                                          cycling as a transportation mode
                                                                                                                                          as well as getting current riders
                                                                                                                                          to cycle more frequently, and for
                                                                                                                                          different types of trips.

          *walking 100m or crossing the road.

APPROVED FOR PUBLIC RELEASE © TRA 2021
WAKA KOTAHI 10

                                         1                     2               3
      Contents

                                         The context for       Support for     Overall travel
                                         walking and cycling   Active Modes    behaviour

                                         4
                                         A closer look
                                                               5
                                                               A closer look
                                                                               6
                                                                               Growing walking
                                         at walking            at cycling      and cycling

APPROVED FOR PUBLIC RELEASE © TRA 2021
1 The context for walking and cycling
WAKA KOTAHI 12

          Summary: The context
          for walking and cycling

          • Covid-19 has impacted how New Zealanders move
            around their cities.
          • With the enforced nationwide restrictions for New
            Zealand, there has been a significant reduction in
            people travelling about their towns and regions. During
            the fieldwork dates when this research was conducted
            travel started to increase back to regular levels.
          • Although travel behaviour started to increase during
            fieldwork, the number of journeys made is still behind
            pre-lockdown levels.
          • Over time we will be able to monitor changes and
            identify whether any movements in metrics are an
            impact from Covid-19.

APPROVED FOR PUBLIC RELEASE © TRA 2021
WAKA KOTAHI 13
Covid-19 restrictions have
created a unique experience
of the urban landscape
We need to be conscious that this year
focuses on results through Covid-19
COVID-19 LOCKDOWN TIMELINE
BEFORE
Fieldwork: May 28th
to June 30th COVID-19
DURING
L3 L4 L3 L2 L1 LOCKDOWN
March April May June July
L4 – People instructed L3- People instructed L2 – People can socialise L1 - No restrictions on
to stay at home in their to stay at home in their in groups of up to 100, domestic transport.
bubble. bubble other than for go shopping, or travel No restrictions on
essential movement. domestically. workplaces or services.
Businesses can open
premises but cannot
physically interact with
customers.
APPROVED FOR PUBLIC RELEASE © TRA 2021WAKA KOTAHI 14
Covid-19 restrictions have had
an impact on travel behaviour
Results from the Waka Kotahi Covid-19 Transport Impact Monitor
indicate that during the fieldwork for this research there was
rapid change in travel behaviour due to easing of restrictions:
• Concerns about Covid-19 • As workers returned to the • Use of active modes (walking and
dropped with just under half of workplace, working from home cycling) peaked during Covid-19
New Zealanders concerned about decreased from 27% to 21% of Alert Level 4, with 77% of
the risk of Covid-19 infection to those working. respondents stating use during
themselves or transmitting it to the past 7 days, over two thirds
• The proportion of New
others. This was ~70% in peak of New Zealanders continued to
Zealanders travelling to work
Level 4. use active modes at least weekly
at least weekly increased from
during Alert Levels 1 and 2. Fieldwork: May 28th
• At the start of fieldwork, 10% of 41% to 51% during the fieldwork
New Zealanders were moving period. to June 30th
around as they normally would -
this increased to 38% by the end
of fieldwork.
L3 L4 L3 L2 L1
March April May June July
APPROVED FOR PUBLIC RELEASE © TRA 20212 Support for Active Modes
WAKA KOTAHI 16

          Summary: Support
          for Active Modes

          • Perceptions of walking and cycling as ways of getting
            around are positive. 60% of urban New Zealanders view
            cycling as a great way to get around town easily and
            efficiently. This view is even higher for walkers at 73%.
          • Overall, there is a high level of support towards cycling
            with almost three quarters of urban New Zealanders
            being supportive of cycling in their communities. This
            support is strong across the regions but is heightened
            in Tauranga and Hamilton.
          • Beyond valuing cycling as a way of getting around,
            there is support for investment in cycling infrastructure.
            This investment is seen as important not only for more
            transport options, but for exercise purposes as well.

APPROVED FOR PUBLIC RELEASE © TRA 2021
WAKA KOTAHI 17
Most people view walking and cycling
as easy and efficient ways to get around
PERCEPTIONS OF WALKING & CYCLING - % STRONGLY AGREE / AGREE
73 %
60 %
Walking is a great way Cycling is a great way
to get around town to get around town
easily and efficiently easily and efficiently
Q7 - Now please tell us how much you agree or disagree with the following statements (Strongly agree + agree)
Base: Total sample n=2,256
APPROVED FOR PUBLIC RELEASE © TRA 2021WAKA KOTAHI 18
Public support for cycling is strong; almost three
quarters are supportive of cycling in their community
SUPPORT OF CYCLING IN THE COMMUNITY NET: SUPPORTIVE(6-10)
2018 2019 2020
3% 7% 7% 12% 25% 45% 73% 71% 70%
Don’t know Very unsupportive(0-2) Unsupportive(3-4) Neutral(5) Supportive(6-7) Very supportive(8-10)
Q6c: There are varying levels of support in the community for people who choose to cycle for journeys such as traveling to work,
going to shops or other activities. To what degree do you support cycling in your community? Base: Total n=2,256
No change to question wording and response options. Question order changed
APPROVED FOR PUBLIC RELEASE © TRA 2021WAKA KOTAHI 19
Support is strong across regions, which is
heightened in Tauranga and Hamilton
SUPPORT OF CYCLING IN THE COMMUNITY NET: SUPPORTIVE(6-10)
2018 2019 2020
Total 3% 7% 7% 12% 25% 45% 73% 71% 70%
Auckland 4% 8% 8% 13% 24% 44% 69% 68% 68%
Hamilton 2% 4% 5% 12% 32% 45% 77% 70% 78%
Tauranga 2% 3% 9% 7% 25% 53% 77% 71% 78%
Wellington 2% 8% 8% 10% 25% 46% 74% 72% 71%
Christchurch 4% 8% 7% 13% 24% 44% 72% 73% 68%
Dunedin 5% 5% 6% 16% 26% 42% 73% 70% 68%
Don’t know Very unsupportive(0-2) Unsupportive(3-4) Neutral(5) Supportive(6-7) Very supportive(8-10)
Q6c: There are varying levels of support in the community for people who choose to cycle for journeys such as traveling to work,
going to shops or other activities. To what degree do you support cycling in your community?
Base: Total n=2,256, Auckland n=596, Hamilton n=209, Tauranga n=204, Wellington n=543, Christchurch n=502, Dunedin n=202
No change to question wording and response options. Question order changed
APPROVED FOR PUBLIC RELEASE © TRA 2021WAKA KOTAHI 20
Over half of New Zealanders think investing
in cycling infrastructure is important
PERCEPTIONS OF CYCLING INFRASTRUCTURE - % STRONGLY AGREE / AGREE
There is support
60 %
59 % across the regions,
this is highest in
Hamilton
Investing in cycle lanes is Investing in cycle lanes is
important because it gives important because it gets
people more travel options people outside exercising
Q7 - Now please think about walking and cycling in general. How much do you agree or disagree with each of the following
statements? Base: n=2,256
APPROVED FOR PUBLIC RELEASE © TRA 20213 Overall travel behaviour
WAKA KOTAHI 22

          Summary: Overall
          travel behaviour

          • Walking and cycling play a significant role in how New
            Zealanders move around their cities. 71% of urban New
            Zealanders use active modes on a regular basis (at least
            once a week) which has continued to increase since 2018.
          • 68% of New Zealanders are walking at least once a
            week which has increased since 2019. However, regular
            motorised vehicle use has also increased.
          • Regular bike (including e-bike) use remains stable at 13%.
          • 36% of all trips in a given week are done by walking or
            cycling (including e-bike). Trip types made by walking and
            cycling are vast. Walking and cycling aren’t only used for
            recreation but also key point-to-point journeys.

APPROVED FOR PUBLIC RELEASE © TRA 2021
WAKA KOTAHI 23
7 in 10 urban New Zealanders use an active
mode of transport at least once a week
REGULAR MODES OF TRANSPORTATION - AT LEAST ONCE A WEEK
71% of urban New Zealanders are using walking
or cycling as regular transportation modes.
73% 73% 68% of people take part in walking at least once
NET: Motorised Vehicle NET: Active modes 2018 2019 2020 a week, which has significantly increased since
68% 2020 – 77% 68% 2020 – 71% 2019.
2019 – 70% 2019 – 65%
2018 – 74% 2018 – 64% Regular cycling is consistent with 2019. There is
60% 60%
a steady increasing trend for electric bike use.
Car use has significantly increased back to
2018 levels after a decrease in 2019.
NET: Cycling NET: Public Transport
2020 – 13% 2020 – 23%
2019 – 13% 2019 – 23%
2018 – 14% 2018 – 23%
20% 20%
18%
Included
in 2020 13%
11% 12
%
7% 8% 7%
5% 1% 2% 3% 2% 3% 1% 1% 1%
3% 3% 4%
Private or Taxi/ride Motorbike or Walking* Bicycle Electric bike Electric scooter Bus Train Ferry
company motor share scooter (e-bike) (e-scooter)
vehicle
Q24. On average, how often do you use each of the following modes of transport, for any reason Significantly higher than previous period Significantly lower than previous period
Base: Total sample, 2018 n=2,115, 2019 n=2,174, 2020 n=2,256.
*walking 100m or crossing the road
NET: Motorised vehicle (Private or company motor vehicle, taxi/ride share, motorbike or scooter) NET: Active Modes (Walking, Bicycle, Electric bike, Electric scooter) NET: Cycling (Bicycle, Electric bike) NET: Public Transport (Bus, Train, Ferry)
Change in question response options. No change in ‘at least once a week’ response options, ability to compare.
APPROVED FOR PUBLIC RELEASE © TRA 2021WAKA KOTAHI 24
Transportation choices differ by region; active modes
are less established in Auckland and Hamilton
REGULAR MODES OF TRANSPORTATION - AT LEAST ONCE A WEEK
Total Auckland Hamilton Tauranga Wellington Christchurch Dunedin
Auckland and Hamilton
have lower levels of regular
NET: Motorised vehicle 77% 73% 81% 81% 74% 82% 75%
walking.
Tauranga and Christchurch
Walking* 68% 62% 61% 72% 71% 71% 71% have the highest levels of
regular cycling.
NET: Cycling 13% 11% 11% 20% 9% 21% 5%
NET: Public transport 23% 29% 14% 14% 37% 15% 16%
Q24. On average, how often do you use each of the following modes of transport, for any reason Significantly higher than total Significantly lower than total
Base: Total sample, 2018 n=2,115, 2019 n=2,174, 2020 n=2,256.
*walking 100m or crossing the road
NET: Motorised vehicle (Private or company motor vehicle, taxi/ride share, motorbike or scooter) NET: Cycling (Bicycle, Electric bike) NET: Public Transport (Bus, Train, Ferry)
APPROVED FOR PUBLIC RELEASE © TRA 2021WAKA KOTAHI 25
71% of people surveyed walk or cycle
at least once a week
REGULAR MODES OF TRANSPORTATION - AT LEAST ONCE A WEEK
Females, 55+ and those
Gender Age Ethnicity of asian ethnicity are
less likely to cycle on
a weekly basis.
Total Male Female 18-34 35-54 55+ Pakeha/NZ Māori Pasifika Asian
European Māori, Pasifika and
Asian are less likely to
NET: Motorised vehicle 77% 77% 76% 67% 79% 85% 80% 65% 67% 73% engage in regular use
of walking.
Walking* 68% 67% 69% 67% 68% 69% 72% 58% 47% 61%
NET: Cycling 13% 18% 8% 17% 14% 10% 14% 9% 11% 12%
NET: Public transport 23% 26% 20% 33% 24% 13% 20% 28% 36% 33%
Q24. On average, how often do you use each of the following modes of transport, for any reason Significantly higher than total Significantly lower than total
Base: Total sample, 2018 n=2,115, 2019 n=2,174, 2020 n=2,256.
*walking 100m or crossing the road
NET: Motorised vehicle (Private or company motor vehicle, taxi/ride share, motorbike or scooter) NET: Cycling (Bicycle, Electric bike) NET: Public Transport (Bus, Train, Ferry)
APPROVED FOR PUBLIC RELEASE © TRA 2021WAKA KOTAHI 26
Walking and cycling account for over a third of trips
made over the course of a week
TRIPS TRAVELLED IN LAST WEEK - SHARE OF TOTAL TRIPS BY MODE
36% of all recent trips measured
6 % were made by either walking or
cycling.
9% Across all recent trips, walking accounts
4% for almost 1/3 of all trips. Cycling only
accounts for a small number of trips.
New Zealanders continue to be
36%
49 %
NET: Walking and
reliant on their cars, with private motor
vehicles accounting for 49% of trips.
Cycling (incl e-bike)
32%
Motorised vehicle (private Walking Cycling (bicycle NET:Public transport NET: Other
motor vehicle, taxi/ride share, or e-bike) (bus, train, ferry) (e-scooter,wheelchair, other)
motorbike or scooter
Base: Total sample, 2018 n=2,115, 2019 n=2,174, 2020 n=2,256.
*Walking 100m or crossing the road
Changes to question structure and wording
APPROVED FOR PUBLIC RELEASE © TRA 2021WAKA KOTAHI 27
Different transportation options are used
for different types of trips
TYPES OF TRIPS TRAVELLED IN THE LAST WEEK – BY MODE TRAVELLED
*
TOTAL
The types of trips that people walk for are:
To / from shops 22% 22% 13% 23% 13% 14% • to get to/from shops
To / from work 19% 20% 18% 17% 26% 28% • to work
• visit friends and family
To / from visiting friends or family 17% 18% 13% 17% 14% 20%
The types of trips people cycle for are:
To / from somewhere else 9% 6% 7% 11% 5% 11% • to get to appointments
(doctor, dentist etc.)
To / from a place of recreation 8% 7% 15% 9% 6% 5%
• to work
As a part of my job 8% 10% 3% 6% 6% 4% • to recreation
To / from doctor/dentist/pharmacy 7% 5% 20% 7% 12% 6%
Take children to school/day care 6% 8% 3% 6% 11% 4%
To / from school, college, university 4% 3% 7% 5% 6% 6%
Q26. Thinking about the past week, how many times did you use each type of transport when traveling for these occasions? Base: Significantly higher than total Significantly lower than total
Trips travelled in last week by mode
*walking 100m or crossing the road
Changes to question structure and wording
APPROVED FOR PUBLIC RELEASE © TRA 20214 A closer look at walking
WAKA KOTAHI 29

          Summary: A closer
          look at walking

          • Walking is something most people do, with
            76% of urban New Zealanders walking* in the
            last 12 months.
          • There has been an increase in total walking,
            which sees more people walking than in 2019.
            This may be a result of Covid-19.
          • The level of walking differs at a regional level;
            Auckland and Hamilton have the lowest levels
            of urban walking, while Wellington shows
            strength with the highest proportion of walking.

          *walking 100m or crossing the road

APPROVED FOR PUBLIC RELEASE © TRA 2021
WAKA KOTAHI 30
This segmentation framework differentiates
people based on the type of walking they do
THIS IDENTIFIES WALKERS BASED ON HOW FREQUENTLY THEY TRAVEL BY FOOT FOR CERTAIN TRIPS
Non-walker Recreational walker Occasional walker Regular walker Committed commuter
Haven’t walked* in Walk for recreational Walk to commute to and from Walk to commute to and from Walk to commute to and from
the last 12 months. purposes at least once work / study or to get around work / study or to get around work / study or to get around
or twice a year. town a few times a month or town every few days or once town most days.
once or twice a year. or twice a week.
*walk for at least 100m and/or cross the road
APPROVED FOR PUBLIC RELEASE © TRA 2021WAKA KOTAHI 31
Walking is something most New Zealanders
engage with
WALKING SEGMENTATION FRAMEWORK – % BASED ON WALKING* IN THE LAST 12 MONTHS
NET: Total Walking
76 % 2019 – 70%
71% of urban New Zealanders
choose to walk as a way of
getting around.
NET: Urban Walking Total walking has increased
71%
since 2019.
For walking, the challenge is
less about getting people to
30% walk in general but enabling
24% walking as an option to replace
20% 21% trips which would otherwise be
taken by vehicle.
5%
Non-walker Recreational Occasional Regular Committed
walker walker walker commuter
2019 29% Change in response options 24% 20%
Q23a. Which of the following have you used in the past 12 months? Significantly higher than 2019
W2. How often do you travel by foot… To commute to and from work/study, To get around town – to run errands, to go to shops, visit family, friends etc, For recreational purposes.
Base: Total sample, 2020 n=2,256 Significantly lower than 2019
*Walk for at least 100m and/or cross the road.
Changes made to response options which impact ability to compare recreational walker and occasional urban walker.
APPROVED FOR PUBLIC RELEASE © TRA 2021WAKA KOTAHI 32
Wellington, Christchurch and Dunedin
have the highest levels of walking
WALKING SEGMENTATION FRAMEWORK – % BASED ON WALKING* IN THE LAST 12 MONTHS
NET: Urban Walking
2020
Total 24% 5% 20% 30% 21% 71%
30% 5% 17% 27% 21% 64% The level of walking differs
Auckland
at a regional level; Auckland
and Hamilton have the lowest
Hamilton 29% 6% 21% 32% 12% 65% levels of urban walking, while
Wellington has the highest.
Despite Auckland having lower
Tauranga 23% 8% 24% 29% 17% 69% levels of urban walking, there is
a relatively high proportion of
committed commuters.
Wellington 22% 2% 18% 30% 28% 75%
Christchurch 21% 6% 24% 32% 17% 73%
Dunedin 21% 5% 15% 31% 27% 73%
Not currently walking Recreational walker Occasional walker Regular walker Committed commuter Significantly higher than 2019
Q23a. Which of the following have you used in the past 12 months? Significantly lower than 2019
W2. How often do you travel by foot… To commute to and from work/study, To get around town – to run errands, to go to shops, visit family, friends etc, For recreational purposes.
* Walk for at least 100m and/or cross the road.
Base: Total n=2,256, Auckland n=591, Hamilton n=207, Tauranga n=201, Wellington n=542, Christchurch n=499, Dunedin n=201
APPROVED FOR PUBLIC RELEASE © TRA 2021WAKA KOTAHI 33
The profile of walkers differs across the
segmentation framework
Total Not currently Recreational Occasional Regular Committed Recreational walkers are more
walking walker walker walker commuter likely to be older, while committed
commuters are more likely to be
18-34 33% 33% 17% 29% 35% 39%
younger.
35-54 34% 34% 26% 37% 33% 34%
Who isn’t walking?
55+ 33% 33% 57% 34% 33% 27%
24% have not walked in the past year.
Male 49% 54% 47% 50% 45% 46%
Those not currently walking are more
Female 51% 46% 53% 50% 55% 54%
likely to be:
Pakeha/NZ Euro 68% 58% 78% 73% 72% 67%
• Male
Māori 8% 12% 3% 7% 9% 6% • Māori ethnicity
Pacific 4% 6% 2% 2% 3% 3% • Asian ethnicity
Asian 16% 20% 9% 15% 13% 16%
Less than $50k 28% 31% 29% 22% 30% 27%
$50k-$99k 30% 27% 33% 30% 30% 29%
$100k or more 27% 21% 19% 36% 26% 28%
Significantly higher than total Significantly lower than total
Q23a. Which of the following have you used in the past 12 months?
W2. How often do you travel by foot… To commute to and from work/study, To get around town – to run errands, to go to shops, visit family, friends etc, For recreational purposes.
* Walk for at least 100m and/or cross the road Base: Total n=2,256 Not currently walking n=542, Recreational walker n=119, Occasional urban walker n=446, Regular urban walker n=674,
Committed commuter n=471
APPROVED FOR PUBLIC RELEASE © TRA 20215 A closer look at cycling
WAKA KOTAHI 35

          Summary: A closer
          look at cycling

          • One quarter of urban New Zealanders have cycled
            in the past year and 20% are riding at least
            occasionally. Overall, there has not been a significant
            change in the number of people cycling since 2019.
          • The majority of those who are not currently riding are
            supportive of cycling in their communities, however,
            there is still one quarter of New Zealanders who are
            less supportive.
          • The level of cycling differs at a regional level;
            Auckland has the lowest level of current cyclists,
            while urban cycling shows strength through
            Hamilton, Tauranga and Christchurch.

APPROVED FOR PUBLIC RELEASE © TRA 2021
WAKA KOTAHI 36
This segmentation framework differentiates people
based on the type of cycling they do
THIS IDENTIFIES CYCLISTS BASED ON HOW FREQUENTLY THEY TRAVEL BY BIKE FOR CERTAIN TRIPS
Less supportive Supportive Recreational rider Occasional rider Regular rider Committed
not currently riding not currently riding Use a bike for Use a bike to commute Use a bike to commute commuter
Haven’t travelled on Haven’t travelled on recreational purposes to and from work / to and from work / Use a bike to commute
a bike in their region a bike in their region at least once or study or to get around study or to get around to and from work /
in the last 12 months in the last 12 months twice a year. town a few times town every few days or study or to get around
and are less supportive but are supportive a month or once or once or twice a week. town most days.
of cycling in their of cycling in their twice a year.
community. community.
APPROVED FOR PUBLIC RELEASE © TRA 2021WAKA KOTAHI 37
One quarter of urban New Zealanders have engaged with
cycling in the past year and one in five are urban riders
CYCLING SEGMENTATION FRAMEWORK – % BASED ON CYCLING IN THE LAST 12 MONTHS
Compared to 2019, overall
NET: Not
NET: Total Riding participation levels in cycling
currently riding
76% 2019 - 78%
24% 2019 – 22% are stable.
2018 – 26%
2018 - 74% Those who haven’t cycled in the
49 % last 12 months account for three
quarters of urban New Zealanders.
Majority of those who are not
currently riding are supportive,
however, there are still one quarter
26% 20% NET: Urban Riding of New Zealanders who are less
supportive.
5% 6% Those less supportive are more
10 % 3% likely to be aged 55 and over.
Less supportive not Supportive not Recreational Occasional Regular Committed
currently riding currently riding rider rider rider commuter
2019 6% 3%
Change in response options
2018 6% 3%
Q23a. Which of the following have you used in [REGION] in the past 12 months? Q6. How often do you currently ride a bicycle or e-bike? Significantly higher than 2019 Significantly lower than 2019
Base: Total sample: n=2,256
Changes made to response options which impact ability to compare not currently riding, recreational riders and occasional riders
APPROVED FOR PUBLIC RELEASE © TRA 2021WAKA KOTAHI 38
Across urban regions, Christchurch has the
highest levels of cycling participation
CYCLING SEGMENTATION FRAMEWORK – % BASED ON CYCLING IN THE LAST 12 MONTHS
NET: Total riding
2018 2019 2020 Across the regions,
Christchurch shows strength
Total 76% 5% 10% 6% 3% 26% 22% 24% in cycling, with the highest
levels of participation.
21% 21% 20% This region has also seen
Auckland 79% 3% 9% 6% 2%
a significant increase in
2020, regaining high levels
Hamilton 73% 5% 11% 6% 5% 30% 25% 27% recorded in 2018.
Wellington and Dunedin have
consistently had the lowest
Tauranga 71 %
5 %
12 %
8 %
4 % 30%
26 %
29 %
levels of participation over
the past three years.
Wellington 82% 4% 8% 4% 3 % 22% 19% 19%
Christchurch 64% 6% 15% 9% 5% 33% 26% 35%
Dunedin 86% 4% 5% 3% 1% 21% 21% 13%
Not currently riding Recreational Occasional rider Regular rider Committed commuter Significantly higher than 2019 Significantly lower than 2019
Q23a. Which of the following have you used in [REGION] in the past 12 months? Q6. How often do you currently ride a bicycle or e-bike?
Base: Total n=2,256, Auckland n=596, Hamilton n=209, Tauranga n=204, Wellington n=543, Christchurch n=502, Dunedin n=202
APPROVED FOR PUBLIC RELEASE © TRA 2021WAKA KOTAHI 39
The profile of riders differs across
the cycling framework
Total Not currently Recreational Occasional Regular Committed Those who are more
riding rider rider rider commuter likely to cycle are:
18-34 33% 31% 26% 35% 52% 47% • Younger (18-34)
35-54 34% 32% 45% 39% 35% 32% • Male
55+ 33% 37% 29% 26% 12% 21% There is a core group of New Zealanders
that don’t cycle. They are more likely
Male 49% 45% 51% 51% 70% 74%
to be:
Female 51% 55% 49% 49% 30% 26%
• Older (55+)
Pakeha/NZ Euro 68% 67% 71% 74% 63% 75% • Female
Maori 8% 9% 4% 7% 7% 8% • Lower income
Pacific 4% 4% 2% 3% 4% 3% This group have lower safety perceptions
of cycling in their community. This will be
Asian 16% 16% 12% 13% 21% 13% explored more in the next section.
Less than $50k 28% 31% 14% 17% 21% 22%
$50k-$99k 30% 28% 38% 31% 40% 34%
$100k or more 27% 24% 38% 37% 33% 33%
Significantly higher than total Significantly lower than total
Q23a. Which of the following have you used in [REGION] in the past 12 months? Q6. How often do you currently ride a bicycle or e-bike?
Base: Total n=2,256, Not currently riding n=1,726, Recreational riders n=99, Occasional riders n=232, Regular riders n=140, Committed commuters n=70
APPROVED FOR PUBLIC RELEASE © TRA 20216 Opportunities to increase the number of people walking and cycling
WAKA KOTAHI 41

          Summary: Walking

          • For walking there are fewer perceived barriers than for
            cycling. However, there are more basic preconceptions
            to overcome that people don’t have enough time to walk
            or that they live too far from destinations for walking to
            be practical.
          • Overall, perceptions of safety are strong with 86% viewing
            walking as safe in their region. However, there are some
            concerns around walking at night and with cyclists on
            shared paths. Safety is more of a concern for Auckland
            walkers compared to other urban centres.
          • Amongst pedestrians, there is low perception of positive
            shared path behaviours which help to create a sense of
            safety. This low perception is not particular to one area but
            rather seen across the regions.

APPROVED FOR PUBLIC RELEASE © TRA 2021
WAKA KOTAHI 42
Summary: Cycling
• In recent years, there has been continual development
and improvements made to cycling infrastructure across
New Zealand. Since 2019 there has been an increase in
safety perceptions overall and in certain environments.
• However, safety continues to be a key barrier to cycling.
Safety perceptions of cycling are at much lower levels than
walking. Overall, 56% of urban New Zealanders feel that
they are, or would be safe cycling.
• Infrastructure helps to create a safe environment for both
cyclists and non-cyclists. Safety perceptions increase when
there is a greater separation between a vehicle and cyclist.
• Those who ride more frequently are more satisfied with the
current cycling infrastructure, while recreational riders have
lower satisfaction. The continuity and connectivity of cycle
lanes and paths should be a focus area for improvement.
APPROVED FOR PUBLIC RELEASE © TRA 2021WAKA KOTAHI 43
Compared to walking, perceptions of safety
for cycling are at much lower levels
PERCEPTIONS OF SAFETY – % OF PEOPLE WHO FEEL SAFE WALKING / CYCLING (6-10)
1%
WALKING
86% view walking as safe in
their region. This drops down
6% 7% 86% to 56% for cycling.
For both walking and cycling,
those who are less likely to feel
Neutral (5) safe are more likely to be:
NET: Not safe (0-4) NET: SAFE (6-10) • Female
Don’t know • 55+
CYCLING
7% 23% 15% 56%
Neutral (5)
Don’t know NET: Not safe (0-4) NET: SAFE (6-10)
Q7A - In general, how safe are you/would you be walking in the [REGION] area? Base: Physically able to walk n=1,949
A5 - In general, how safe are you/would you be, riding a bicycle in [REGION]? Base: Physically able to cycle n=1,962.
APPROVED FOR PUBLIC RELEASE © TRA 2021WAKA KOTAHI 44
Concerns around safety hold
people back from cycling
BARRIERS TO CYCLING
41+A 35+A 35+A
Safety is a key perceived barrier
to cycling more often, expressed
by both cyclists and non-cyclists.
This is a consistent picture across
New Zealand. There are, however,
Safety and
confidence
41% Logistical
barriers
35% 35% regional differences in relation
to the weather and geographical
landscapes being mentioned.
I don’t feel safe because I dont have access It’s not enjoyable This is consistent with 2019.
35+A37+A 32+A 31+A
of how people drive to a bike because of the weather
35% 37% 32% 31%
I’m concerned about the I don’t feel safe I always have too Cycling is not a quick
speed of other road users cycling in the dark much stuff to carry way for me to get where
I need to go
Q11b. Sometimes people tell us there are things that stop them from cycling as much as they otherwise would. When it comes to cycling, which of these statements, if any, apply to you? Base: Physically able to cycle n=1,962.
No change to question wording and response options. Question order changed
APPROVED FOR PUBLIC RELEASE © TRA 2021WAKA KOTAHI 45
Safety is a barrier to walking more, but there are
also more practical barriers to overcome
BARRIERS TO WALKING
32+A 27+A
Perceived travel time
and safety in the dark
prevent people walking
more often.
Ease and 32% Safety Logistics 27% This is a consistent
picture to 2019.
access
Walking is not a quick way for It’s not enjoyable because
me to get where I need to go of the weather
26+A 24+A 32+A 24+A
26%
I live too far away for it
to be practical
24%
Walking adds too much
time to my journey
32%
I don’t feel safe
walking in the dark
24%
I always have too
much stuff to carry
Q34A. Sometimes people tell us there are things that stop them walking as much as they otherwise would. Which of these statements, if any, apply to you? Base: Physically able to walk n=1,949.
No change to question wording and response options. Question order changed
APPROVED FOR PUBLIC RELEASE © TRA 2021WAKA KOTAHI 46
Those who don’t walk or cycle have lower safety
perceptions – this is more evident in cycling
PERCEPTIONS OF SAFETY – % OF PEOPLE WHO FEEL SAFE WALKING / CYCLING (6-10)
88% 90% 88% 88% Those who walk generally
84% feel safe regardless of
77% 75%
frequency, but this does
73% drop for those not currently
walking.
59% For those who ride,
committed commuters feel
50%
Walking
safe but safety perceptions
Cycling
decrease as frequency of
cycling decreases.
Not currently Recreational Occasional Regular Committed Not currently Recreational Occasional Regular Committed
walking walker walker walker commuter riding rider rider rider commuter
Q7A - In general, how safe are you/would you be walking in the [REGION] area? [NET Safe - 6-10 out of 10]
Base: Physically able to walk Total n=1,949
A5 - In general, how safe are you/would you be, riding a bicycle [NET Safe - 6-10 out of 10]
Physically able to cycle Total n=1,962,
APPROVED FOR PUBLIC RELEASE © TRA 2021WAKA KOTAHI 47
Across the regions, Auckland has lower levels
of cycling and walking safety perceptions
PERCEPTIONS OF SAFETY – % OF PEOPLE WHO FEEL SAFE WALKING / CYCLING (6-10)
92% 93%
86% 85% 88% 86%
79%
69%
50% 62% 63%
56%
48% 58%
Total Auckland Hamilton Tauranga Wellington Christchurch Dunedin
Walking Cycling
Q7A - In general, how safe are you/would you be walking in the [REGION] area? [NET Safe - 6-10 out of 10]
Base: Physically able to walk Total n=1,949, Auckland n=516, Hamilton n=174, Tauranga n=172, Wellington n=475, Christchurch n=429, Dunedin n=172
A5 - In general, how safe are you/would you be, riding a bicycle [NET Safe - 6-10 out of 10]
Physically able to cycle Total n=1,962, Auckland n=522, Hamilton n=177, Tauranga n=174, Wellington n=482, Christchurch n=425, Dunedin n=171
APPROVED FOR PUBLIC RELEASE © TRA 2021WAKA KOTAHI 48
Where infrastructure is laid there
is a greater sense of safety
PERCEPTIONS OF CYCLING SAFETY – % OF PEOPLE WHO FEEL SAFE CYCLING (6-10)
2018 2019
There has been an increase in
Overall 56% 38% 42%
safety across quiet local roads,
reduced speed zones, public
On public roads,
with no cycle lanes 37% 21% 24% roads (with or without painted
cycle lanes), and on footpaths.
On the footpath 58% 53% 54% Parks and domains are
perceived to be the safest,
On public roads, although this perception has
with painted cycle lanes 64% 60%
decreased compared to 2019.
Even the most basic cycling
In a reduced speed zone 65% 58%
infrastructure helps people feel
(e.g. 30kph speed limit)
a lot safer.
On a shared path or cycle path 68% 69% 68%
Only 56% feel safe overall,
however, if cycling on a shared
On public roads, with cycle lanes 69% 67% path or road with cycle lanes,
separated from traffic safety perceptions increase
significantly.
On quiet local roads 73% 68% 65%
At a park/domain 78% 84% 82%
A5 - In general, how safe are you/would you be, riding a bicycle [NET Safe - 6-10 out of 10] Base: Physically able to cycle n=1962 Significantly higher than 2019 Significantly lower than 2019
No change to question wording and response options. Question order changed
APPROVED FOR PUBLIC RELEASE © TRA 2021WAKA KOTAHI 49
Infrastructure creates a sense of safety
for those who aren’t currently riding
PERCEPTIONS OF CYCLING SAFETY – % OF PEOPLE WHO FEEL SAFE CYCLING (6-10)
For both cyclists and
86% 89% non-cyclists, perceptions
83% 86% 82% 86%
75% of safety increase
79% 80%
76 %
78% 68% 75%
significantly when a road
73% has dedicated cycle lanes.
71% 71%
64%
66%
62% The greater the separation
60% 61%
59% between vehicle and
53% cyclist, the greater the
50% 51%
sense of safety.
33% 33%
Not currently riding
Recreational rider
Overall On public On the On public In a reduced On a shared On public On quiet local At a park/
Urban rider (Occasional, Regular,
roads, with no footpath roads, with speed zone(e.g. path or cycle roads, with roads domain
Committed commuter)
cycle lanes painted cycle 30kph speed path cycle lanes
lanes limit) separated
from traffic
A5 - In general, how safe are you/would you be, riding a bicycle [NET Safe - 6-10 out of 10]
Physically able to cycle Total n=1,962, Not currently riding n=1,469 Recreational rider n=93 Urban rider (Occasional rider, Regular rider, committed commuter) n=400
APPROVED FOR PUBLIC RELEASE © TRA 2021WAKA KOTAHI 50
The development of
infrastructure plays a key
role in encouraging cycling
56 %
49 %
2020 2019
Agree that the opening of cycleways
or paths has encouraged them
to cycle more
Q7 - Now please think about walking and cycling in general. How much do you agree or disagree with each of the following statements Base: Cyclists n=567
APPROVED FOR PUBLIC RELEASE © TRA 2021WAKA KOTAHI 51
For walking, shared paths and walking at night are
where people feel less safe, particularly in Auckland
PERCEPTIONS OF WALKING SAFETY – % OF PEOPLE WHO FEEL SAFE WALKING (6-10)
Auckland
86% of people feel safe walking
Overall 86% 79%
overall. This is a strong perception
in most environments but drops
At night 52% 45% down significantly at night and
on shared paths.
On shared paths with
bicycles and e-scooters 56% 56% Regionally, this is a consistent
pattern, however, Aucklanders
are more likely to see walking
Adjacent to a street with 78% 72%
environments as unsafe.
speed limit of 50km/hr+
On a shared street with 80% 80%
a speed limit of 10km/hr or less
Around the town centre(s)
82% 75%
At a park/domain 84% 78%
Around schools
84% 80%
Adjacent to a street with
speed limit of 30km/hr 85% 81%
Q7A - In general, how safe are you/would you be walking in the [REGION] area? [NET Safe - 6-10 out of 10]
Base: Physically able to walk Total n=1,949,
APPROVED FOR PUBLIC RELEASE © TRA 2021WAKA KOTAHI 52
Shared paths create a sense
of safety for cyclists, but
not so much for pedestrians
68 %
When cycling
In the context of cycling, shared pathways are
seen as safe. Safety of shared paths drops
56 %
down by 12 percentage points for walking.
There is a desire to share these pathways but
cyclists and pedestrians will need to ‘share with
When walking
care’ to make this infrastructure most effective.
Q7A - In general, how safe are you/would you be walking in the [REGION] area? [NET Safe - 6-10 out of 10]
Base: Physically able to walk Total n=1,949
A5 - In general, how safe are you/would you be, riding a bicycle [NET Safe - 6-10 out of 10]
Physically able to cycle Total n=1,962
APPROVED FOR PUBLIC RELEASE © TRA 2021WAKA KOTAHI 53
Most people aren’t seeing positive shared path behaviours often.
It is these behaviours which create a sense of safety for pedestrians
POSITIVE SHARED PATH BEHAVIOURS
NET: Never / NET: See this
hardly ever see happen all the
this happen time / a lot
Nationally, positive
Slowing down on shared
cyclist behaviours on
paths when approaching
pedestrians
13% 27% 37% 20% 3% 40% 23% shared paths are not
seen frequently.
Giving a safe amount of space
when riding near pedestrians
on shared paths
10% 24% 43% 20% 3% 34% 23%
Using bells on shared paths
to let pedestrians know they
are approaching
24% 31% 29% 13% 3% 55% 15%
I never see I hardly ever I see this I see this I see this happen
this happen see this happen happen a little happen a lot all the time
Q22 - How often do you see the following behaviour on the road, or shared path, from cyclists? I see this happen all the time + a lot Base: Total sample n=2,256.
APPROVED FOR PUBLIC RELEASE © TRA 2021WAKA KOTAHI 54
Walkers generally find it easy to get out and about
while using footpaths, this drops down for cyclists
HOW EASY DO YOU FIND IT TO – % VERY / SOMEWHAT EASY
Getting to the places they want
Getting to the places
you want to go*
74% to go is easy for both cyclists and
pedestrians.
79%
Perceived ease of using cycle
lanes and crossing the road is
significantly lower for cyclists than
Using cycle lanes/ 66% pedestrians.
footpaths*
84% Perceptions of ease drop down
even further among recreational
cyclists.
Crossing the roads*
58%
78%
Cyclists Walkers Significantly lower than walkers
Q29 / Q29a – Using the scale below, how easy do you find it to
Base: Cyclists n=567 Walkers n=1,710
*don’t know excluded from analysis
APPROVED FOR PUBLIC RELEASE © TRA 2021WAKA KOTAHI 55
Continuity and connectivity are more
of an issue for cyclists
SATISFACTION WITH INFRASTRUCTURE - % SATISFIED (5-7)
Walkers are generally satisfied with
68%
Signage and wayfinding* the infrastructure that is in place.
75%
Cyclists are satisfied with signage
and wayfinding, shared paths, and
65% the quality of bicycle lanes but it is
The quality of shared use paths*
70% the continuity and connectivity of
cycle lanes where this drops.
64%
The quality of bicycle lanes/
footpaths* 68%
The continuity and connectivity of 60%
cycle lanes/footpaths* 75%
Cyclists Walkers Significantly lower than walkers
Q29b / Q29c – Now please think about cycling / pedestrian infrastructure in [region]].How satisfied are you with
Base: Cyclists n=567 Walkers n=1,710
*don’t know excluded from analysis
APPROVED FOR PUBLIC RELEASE © TRA 2021WAKA KOTAHI 56
For cycling, connectivity and parking are areas
where satisfaction is lower
SATISFACTION WITH CYCLING INFRASTRUCTURE - % SATISFIED (5-7)
There are particular areas where
infrastructure can be improved.
Signage and wayfinding* 68% Connectivity of cycle lanes and bike
parking should be key focus areas for
Bike racks on buses* 66% improving infrastructure.
Across all infrastructure environments,
The quality of shared use paths* 65 % recreational cyclists are less satisfied
and regular riders are more satisfied.
The quality of bicycle lanes* 64%
Space for bicycles on trains* 64%
Bicycle parking at public transport
stops / stations* 61%
The continuity and connectivity
of cycle lanes and paths* 60%
Bicycle parking generally* 58%
Q29b - Now please think about cycling infrastructure in [REGION].How satisfied are you with…?
Base: Total Cyclist n=567
*don’t know excluded from analysis
APPROVED FOR PUBLIC RELEASE © TRA 2021WAKA KOTAHI 57
For walking, quality of footpaths and shared paths
show the most room for improvement
SATISFACTION WITH WALKING INFRASTRUCTURE - % SATISFIED (5-7)
Satisfaction of walking
The amount of stair-free footpaths to key
destinations (e.g. grocery store, school, work)*
81% infrastructure is consistent across
the segmentation framework.
The amount of marked
pedestrian crossings*
77%
The continuity and
connectivity of footpaths* 75%
The amount of footpaths/
shared use paths* 75%
Signage and wayfinding* 75%
The quality of shared use paths* 70%
The quality of footpaths* 68%
Q29c - Now please think about cycling infrastructure in [REGION].How satisfied are you with…?
Base: Walkers n=1,710
*Don’t know excluded from analysis
APPROVED FOR PUBLIC RELEASE © TRA 2021WAKA KOTAHI 58
There are other things that get people on their bike:
social influences reinforce the normalisation of cycling
SOCIAL PERCEPTIONS - % STRONGLY AGREE / AGREE
Those cycling more frequently are
My family encourage and support that I cycle* 58% more likely to have friends, family
or colleagues who also cycle.
It is becoming more popular for people to use a
bicycle to get to work, study or to the shops 57%
My friends encourage me to cycle* 38%
I believe that cycling improves my personal
image to my peers* 36%
I have lots of friends and family who cycle 33%
At work, lots of my colleagues cycle to work 18%
Q8 - How much do you agree or disagree with each of the following statements? Base: Total sample n=2,256
* Asked of cyclists n=567.
APPROVED FOR PUBLIC RELEASE © TRA 2021Let’s talk
You can also read