Life cycle assessment of powder milk production in Indonesia
←
→
Page content transcription
If your browser does not render page correctly, please read the page content below

IOP Conference Series: Earth and Environmental Science

PAPER • OPEN ACCESS

Life cycle assessment of powder milk production in Indonesia
To cite this article: Ursula C Silalahi et al 2021 IOP Conf. Ser.: Earth Environ. Sci. 716 012038

View the article online for updates and enhancements.

                                This content was downloaded from IP address 46.4.80.155 on 19/09/2021 at 05:00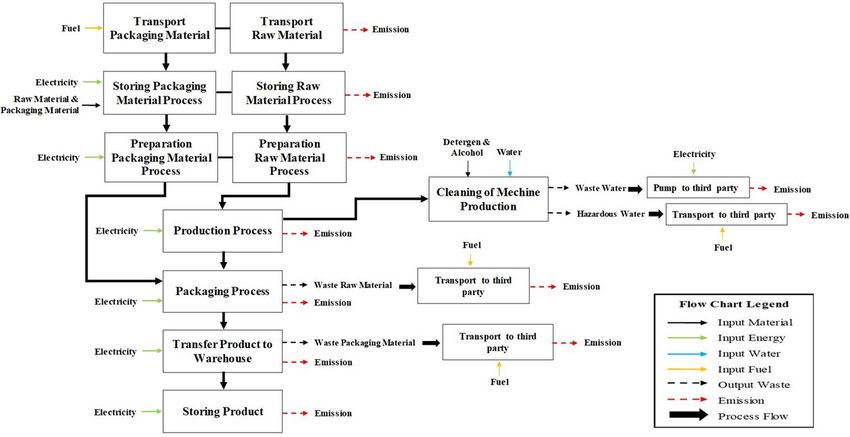
The 1st Journal of Environmental Science and Sustainable Development Symposium             IOP Publishing
IOP Conf. Series: Earth and Environmental Science 716 (2021) 012038    doi:10.1088/1755-1315/716/1/012038

Life cycle assessment of powder milk production in Indonesia

                     Ursula C Silalahi1, Misri Gozan2* and Ellyna Chairani1
                     1
                      School of Environmental Science, Universitas Indonesia, Jakarta, 10430, Indonesia
                     2
                       Faculty of Engineering, Bioprocess Engineering, Universitas Indonesia, Depok
                     16424, Indonesia
                     *
                         mrgozan@gmail.com

                     Abstract. The industry is a human activity established to process resources or materials into
                     goods or products that humans can utilize. The dairy processing industry is one of the
                     industries that process raw milk into various products, such as milk powder. The process of
                     dairy processing industry activities not only produces a product but also contributes to
                     environmental impacts. The main objective of this research determines the most potential
                     environmental impact caused by the production process. The research will be conducted on
                     milk powder products manufactured by PT X. The products chosen in this research are a
                     product with a size of 40 grams per-sachet (product A) and product with a size of 200 grams
                     per-sachet (Product B). The LCA research boundary is “gate to gate,” such as materials
                     transportation from supplier, manufacturing process and management waste. The method used
                     to determine the potential environmental impacts is life cycle assessment (LCA) method.
                     Software SimaPro v.9.1 calculates the impact assessment. The calculations showed potential
                     environmental impacts on product A and product B, such as Marine Ecotoxicity, Freshwater
                     Ecotoxicity, and Human Toxicity. Based on the process stages of product A and product B, the
                     potential environmental impact arises from the manufacturing process.

1. Introduction
The growth of industries always increases every year. This growth phenomenon is supported by the
increasing demand for goods and services demand used by people. The industry is a human activity
established to process resources or raw materials into goods or products that humans can utilize.
Besides fulfilling all the needs of human life, the industry also has a negative impact on humans due to
environmental pollution. The industry is one of the main sources of pollution and the overuse of
natural resources. The industry is the contributor to CO2, hazardous waste, and solid as well as
wastewater, which triggers environmental pollution [1]. Along with the increase of industry, not a least
who began to pay attention to environmental issues. Environmental issues began to be discussed since
the holding of the United Nations Conference on the Environment in Stockholm (Sweden) on June 15,
1972 [2]. The efforts to overcome environmental problems caused by industry have been developed in
several countries, but the environmental problems that resolved only come from the output of the
production process (waste and emission). Basically, environmental problems are not only from
production waste, but in the entire industrial process chain [3]. One of the methods for assessing the
environmental problem from the entire industrial of process is a life cycle assessment (LCA). Based on
ISO 14040, LCA is used to evaluate input, output, and environmental impact potential of the product's
life cycle [4]. LCA used to analyze and calculate the total environmental impact potential of the
product in every cycle [5]. LCA also use to calculate the environmental impact potential of the product
on the ecosystem, which is done with a couple of steps in its cycle [2]. LCA method is used to identify

              Content from this work may be used under the terms of the Creative Commons Attribution 3.0 licence. Any further distribution
              of this work must maintain attribution to the author(s) and the title of the work, journal citation and DOI.
Published under licence by IOP Publishing Ltd                          1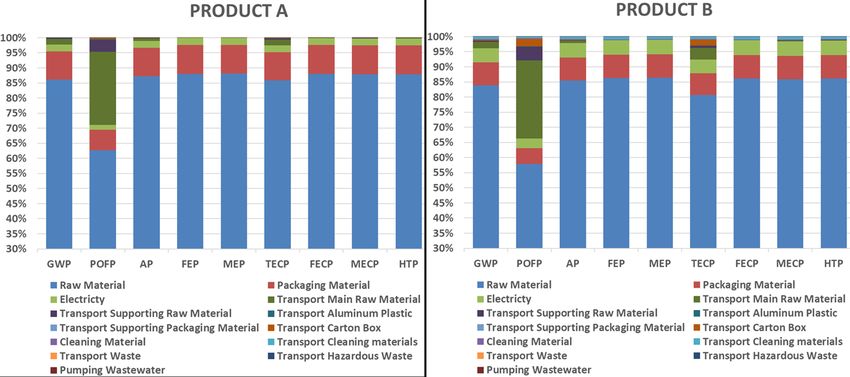
The 1st Journal of Environmental Science and Sustainable Development Symposium             IOP Publishing
IOP Conf. Series: Earth and Environmental Science 716 (2021) 012038    doi:10.1088/1755-1315/716/1/012038

hotspots in the production stage, which can refer to an opportunity to decrease environmental impact
and increase efficiency and profitability [6]. LCA method can be used as an implementation of
scenario determinant, which corresponds to resolve environmental impact [7]. LCA can be used to
identify opportunities in environmental improvement action with confidence that all of the products
have a life cycle product [8]. LCA used to analyze the environmental impact potential of the
production activity [3]. The scenario used to analyze the impact and contribute to the main problem
will be used as a recommendation for resolving action [9]. LCA has been much applied to many
products and services [10]. One of the products is dairy products. Finnegan (2015) said that many
countries, as a main manufacturer of the dairy product have evaluated the environmental impacts of
the products [11]. Based on the Environment Impact Production (EIPRO), the dairy industry is one of
the food industries that make a major contribution to the environment. In 2006, it was stated that the
dairy industry contributed for eutrophication (10%), global warming (5%), and potential for
photochemical ozone formation (4%). The dairy industry is one of the top 10 providers of total impacts
on all environmental aspects except ozone depletion [12]. Several studies related to LCA research on
the process of milk production in table 1.

                               Table 1. The Research of Dairy Products.
             Research                                   Function
Authors                   System Boundary                          Result
             Focus                                      Unit
Finnegan     Powder       Gate    Raw milk              1 kg       Based on result, the most
et al.,      Milk &       to gate transportation                   contributor        of       potential
2016         Butter               (Subsystem 1),                   environmental impact is processing
                                  Processing and                   raw milk into milk powder and
                                  Packaging                        butter. It caused by electricity
                                  (Subsystem 2)                    usage. Energy usage in drying
                                                                   process      gives     the      most
                                                                   environmental       impact.     Milk
                                                                   transportation stands in the second
                                                                   place [13].
Allia et     Powder       Cradle Material               40 g &
al., 2018    Milk         to gate production            220 g      Based on result shows potential
                                  (subsystem 1),                   environmental impact started from
                                  Transportation                   GWP, EP, AP and POCP. The most
                                  (subsystem 2),                   contributor       of        potential
                                  Manufacturing                    environmental impact started from
                                  (subsystem 3),                   production      material     process,
                                  Product                          transportation,    milk      powder
                                  distribution                     production and product distribution
                                  (subsystem 3)                    [15].
González- Yogurth         Cradle Dairy farm             1 kg       Based on the result, the most
García et                 to      (subsystem 1),                   potential environmental impact
al., 2012                 grave Dairy factory                      caused by Subsystem 1 and is
                                  (subsystem 2),                   followed     by     Subsystem      2.
                                  Transport to                     Subsystem 1 caused by CH4, NO3
                                  retail                           and     NH3      originated     from
                                  (subsystem 3),                   management animal dung and
                                  and                              enteric fermentation. Emission SO2
                                  Disposal                         and NOX from usage fuel to
                                  (subsystem 4).                   machine combustion of farming
                                                                   machine. Subsystem 2 caused by

                                                    2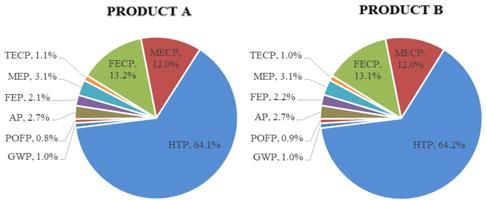
The 1st Journal of Environmental Science and Sustainable Development Symposium             IOP Publishing
IOP Conf. Series: Earth and Environmental Science 716 (2021) 012038    doi:10.1088/1755-1315/716/1/012038

                                                                   usage of material like powdered
                                                                   milk, concentrated milk and
                                                                   packaging material, and then
                                                                   followed by energy usage [14].
Nunes et     Cheese       Cradle Milk                   1 kg       Based on result, the most
al., 2020    productio    to gate production                       environmental impact is milk
             n                    (dairy farm),                    production process. Milk production
                                  cheese                           process related to cow farming,
                                  production,                      dung management, and milk
                                  product                          production processes its self. Milk
                                  distribution                     production process contributes more
                                                                   than      90%      of     the    whole
                                                                   environmental impact; it is followed
                                                                   by the usage of electricity used by
                                                                   the production process, especially
                                                                   GWP        and     AP,      which    is
                                                                   approximately 3%. The distribution
                                                                   of the product gives the least
                                                                   contribution [16].
Xu et al.,   Powder       Cradle Farming,               400 g      Based on result, most contributors
(2013)       Milk         to gate Manufacturing,                   are originated from farming, which
                                  packaging, and                   produces raw material, and the
                                  transportation                   manufacturing process stands in the
                                                                   second place. Farming contributes
                                                                   74.2%, manufacturing contributes
                                                                   25%, packaging and transportation
                                                                   contribute 0.8%. In short, one of the
                                                                   footprint contributors in the whole
                                                                   supply chain is dominated by the
                                                                   farming step [17].
González- UHT milk        Cradle   Dairy farm           1 kg       Based on result, the most significant
García et                 to       (subsystem 1),                  contributor to environmental impact
al., 2013                 grave    Dairy plant                     is caused by Subsystem 1 and
                                   (subsystem 2).                  followed by a Subsystem 2.
                                                                   Subsystem 1 is caused by farming,
                                                                   which primarily causes AP, EP,
                                                                   GWP, and TEP; animal feed
                                                                   production contributes to ADP, air,
                                                                   and water emission (GWP).
                                                                   Subsystem 2, the most contributors,
                                                                   start from packaging material usage,
                                                                   electricity, transport, and fuel usage.
                                                                   Emission created effecting AP, EP,
                                                                   GWP, and POFP [18].
Santos Jr,   Cheese       Cradle Upstream               1 kg       Based on result, the most
et al 2017                to gate activity and                     environmental impact doesn’t come
                                  cheese                           from the cheese industry but raw
                                  production                       material       production.      Cheese
                                  process                          production contributes 29% of the
                                                                   whole environmental impact. Raw
                                                                   material production (raw milk)

                                                    3
The 1st Journal of Environmental Science and Sustainable Development Symposium IOP Publishing
IOP Conf. Series: Earth and Environmental Science 716 (2021) 012038 doi:10.1088/1755-1315/716/1/012038
gives the most contribution, which
is between 70% and 98%. Thermal
energy usage has a significant effect
on particulate matter formation,
ozone depletion and photochemical
oxidant formation, but it contributes
smaller about 20% or less.
Electricity usage contributes to
Water Depletion, Fossil Depletion,
about 10% or less [19].
Based on previous research, state that the environmental impact of product production is not only
influenced by the output (emissions and waste) of the process but also influenced by the use of inputs
and processes. Besides, other stages also affect, such as the farming process, to obtain raw milk used
as input for making milk products. This research will conduct a LCA analysis of life cycle of dairy
product similar to previous research. This research was conducted at one of the dairy product
manufacturers in Indonesia. PT. X is a producer of dairy products in Indonesia. This research was
conducted because of the evaluation of environmental performance in PT. X still refers to the
production process's output and has not been evaluated from the product life cycle. This research aims
to evaluate the environmental performance of the life cycle of dairy products PT. X with LCA, similar
to previous research. This performance assessment is carried out to prevent consequences from the
unsustainable use of the resources needed to produce the product [1]. It's expected by measuring the
environmental impact using LCA method in the dairy product life cycle of PT. X can improve
environmental performance as an effort to reduce environmental problems caused by the production
process.
2. Method
Assessing the potential environmental impact in this research is using LCA method. LCA method
consists of four phases, such as Goal and Scope, collecting data (LCI), calculate and evaluating the
result of environmental impact (LCIA), and interpretation of evaluation result [20].
2.1. Goal and scope
The purpose of determination the unit function is making easier to compare one to another chosen
product and equalize the unit used to calculate input and output. The scope is used to decide system
boundary of research. An appropriate system boundary also simplifies the determination of unit
process and input material included or excluded in the LCA scope.
2.2. Life Cycle Inventory (LCI)
The second stage is life cycle inventory to collecting input (material consumption, energy use, water
use, etc.) and output (main products, by-products, emission, waste, etc.) data for each process unit
within the system boundary that have been determined. The data will be calculated to find the
environmental impact potential along the product life cycle.
2.3. Life Cycle Impact Assessment (LCIA)
The third stage is life impact assessment. Life cycle impact assessment is a step to evaluate the
environmental impact potential based on the result of LCI calculation. This step is connecting
inventory data to environmental impact categories that have been determined to be analyzed in order
as an effort to understand these impacts. Other than that, assessing the life cycle impact gives better
additional information for evaluating the result of LCI calculation to find out the most significant
environmental impacts from the product life cycle. SimaPro v.9.1 can help the calculation of
4The 1st Journal of Environmental Science and Sustainable Development Symposium IOP Publishing
IOP Conf. Series: Earth and Environmental Science 716 (2021) 012038 doi:10.1088/1755-1315/716/1/012038
environmental impact assessment. The method of assessing the potential impact in SimaPro v.9.1 is
using the ReCiPe 2016 method.
2.4. Interpretation
The last stage is interpretation in life cycle assessment method. Interpretation is used to identifying
data that has the most significant contribution to the environment and resolving.
3. Results and discussion
3.1. Goal and scope
This research aims to assess the environmental impact potential of products which are produced by PT.
X. The products analyzed were product A and product B. Product A is a product for age in infancy or
adolescence with a size of 40 grams in one sachet with chocolate flavor, and product B is a product for
mothers and babies with a size of 200 grams in one sachet with vanilla flavor.
Figure 1. System Boundary of LCA.
The functional unit in environmental impact assessment is one sachet of each product. The scope of
this research is a gate to gate scheme. The system boundary is divided into three subsystems. The
system boundary shows in Figure 1. The first subsystem is the material transportation process from a
supplier to PT.X. The second subsystem is PT. X’s manufacturing process. The manufacturing process
is divided into some sub-processes. The sub-processes are started by storing materials from a supplier
in a material storage warehouse, production process, packaging process until sending milk products to
the product storage warehouse. The process of cleaning the production machine also part of subsystem
two. The last subsystem is waste management. The waste management process that will be assessed is
transportation waste to a third party because PT.X doesn't treat the waste.
5The 1st Journal of Environmental Science and Sustainable Development Symposium IOP Publishing
IOP Conf. Series: Earth and Environmental Science 716 (2021) 012038 doi:10.1088/1755-1315/716/1/012038
3.2. Life Cycle Inventory
The inventory steps are included: collecting, managing and analyzing data to reach the determined
goal. Inventory data consists of a stream of input data, process, and output. In this research, inventory
data is total data of one month in June 2020 to process product A and product B. Figure 2 explains the
input, output, and stage of flow for the production process according to the research scope. The data
explained in Figure 2 includes data needed in the transportation process, manufacturing process, and
waste management process.
Figure2. The Stream of Input and Output in Process Steps.
Inventory data in transportation include the total distance and kind of vehicle which is used. Raw
material and packaging material transportation process in PT.X is using land and sea transportation.
Land transportation uses diesel trucks (Euro 2) with wings box or log box type with a capacity of
fewer than ten tonnes and more than ten tonnes. Sea transportation is using container cargo ships with
a capacity of 960 tons and 320 tons. In Raw material and packaging material transportation, the cargo
is assumed filled with 80% of capacity with the same material. The distance of transportation is
calculated with Google Maps, either sea or land distance. Inventory border in transportation step
doesn’t calculate sending process from supply location to port of supplier country, doesn’t calculate
miscellaneous usage in the port area, and doesn’t calculate tools used to transfer the container to a
transportation truck. Data used in the transportation process in SimaPro 9.1 is data that has criteria and
appropriate to the actual condition. In this research, the usage of data refers to secondary data,
Ecoinvent 3.0. The data scope of Ecoinvent 3.0 includes transportation distance, kind of vehicle,
average of fuel use that is regulated in the whole country globally, and emission data was caused along
the transportation process.
Inventory data in the manufacturing process includes raw material and packaging material used,
energy consumption, and production machine cleaning process. Raw material and packaging material
includes main material and supporting material. Calculation of raw material and packaging material is
material needed in a one-month production process. In this research, the usage of raw material and
packaging material data in SimaPro 9.1 refers to secondary data Agri Footprint and Ecoinvent 3.0.
6The 1st Journal of Environmental Science and Sustainable Development Symposium IOP Publishing
IOP Conf. Series: Earth and Environmental Science 716 (2021) 012038 doi:10.1088/1755-1315/716/1/012038
Agri Footprint and Ecoinvent 3.0 scopes are raw and packaging material production data, representing
the average production activity of one kilogram of raw and packaging materials in every country
globally. Emissions caused by production process of raw and packaging materials are also calculated
and to be part of the secondary data. Electricity usage is a medium voltage electricity from PT. PLN.
Total electric consumption is calculated in one month in every process. In this research, electricity
usage refers to secondary data of Ecoinvent 3.0. Ecoinvent 3.0 scope is electricity production data that
assumed with an average of similar technology and processes are same throughout in Indonesia, and
emission contribution data caused by electricity usage. The data of cleaning process of production
machine is the transportation process of cleaning material data, total cleaning material usage and water
usage in one month. In this research, cleaning agent material and transportation process of cleaning
agent refers to secondary data of Ecoinvent 3.0. Ecoinvent 3.0 scopes same as the process of
transporting materials and raw material and packaging material use
Inventory data in waste management is a total waste and waste management process. In this
research, the waste management process is the transportation of waste to a third party. Waste and
hazardous waste transported to the third party by using trucks with a capacity of fewer than ten tonnes,
and the wastewater pumped to the third party to be treated. In this research, data usage refers to
secondary data of Ecoinvent 3.0. Ecoinvent 3.0 scope includes transportation distance, kind of vehicle
and an average of fuel used for waste transportation process, electricity usage for pumping wastewater
process, and emission data caused by the entire process.
Table 2. Inventory Data on the Boundary System.
System Material Unit Product A Product B
Transport
packaging Truck tkm 2,261 2,122
Subsystem
material
1
Transport raw Truck tkm 17,379 3,989
material Ship tkm 304,021 83,451
Base powder milk kg 49,200 11,747
Raw material Sugar kg 24,630 2,571
Additional material kg 46,180 7,618
Aluminium foil kg 7,705 591
Packaging
Box kg 8,655 5,949
material
Additional material kg 56 41
Warehouse Raw Material and
kWh 3,673 1,820
Packaging Material
Preparation process kWh 2,329 1,319
Production process kWh 7,188 2,270
Subsystem Electricity
Packaging process kWh 343 176
2 Transfer product to warehouse
kWh 670 372
finish good
Warehouse finish good kWh 3,451 3,420
Water consumption L 3.9 3.9
Detergent L 0.8 0.8
Alcohol L 20 20
Cleaning
Tissue kg 2.9 2.9
machine
Detergent transportation tkm 0.08 0.08
Alcohol transportation tkm 0.8 0.8
Tissue transportation tkm 105 105
Subsystem Solid waste kg 1,4117 52,92
Waste
3 Waste water L 5 5
7The 1st Journal of Environmental Science and Sustainable Development Symposium IOP Publishing
IOP Conf. Series: Earth and Environmental Science 716 (2021) 012038 doi:10.1088/1755-1315/716/1/012038
Hazardous waste kg 23 23
Waste transportation tkm 42.5 1.6
Waste
Pumping wastewater kWh 18.24 18.24
management
Hazardous waste transportation tkm 2.49 2.49
3.3. Life Cycle Impact Assessment
In the ReCiPe method, there were two ways to decide the potential environmental impact category.
They are midpoint assessment and endpoint assessment. ReCiPe impact category assessment used in
this research is a midpoint assessment impact. Environmental impact characteristics assessed in this
research are acidification (AP), global warming (GWP), human toxicity (HTP), photochemical oxidant
formation (POFP), marine eutrophication (MEP), freshwater eutrophication (FEP), marine ecotoxicity
(MECP), freshwater ecotoxicity (FECP) and terrestrial ecotoxicity (TECP).
Table 3. Potential Environmental Impact Assessment Results of Product A and Product B.
Impact Category Unit Product A (40 g) Product B (200 g)
GWP Kg CO2-eq 0.289266 1.69185
POFP Kg NOx eq 0.000557 0.00358
AP Kg SO2-eq 0.004073 0.02347
FEP Kg P-eq 0.000052 0.00030
MEP Kg N- eq 0.000536 0.00307
TECP Kg 1,4 DB-eq 0.042636 0.22239
FECP Kg 1,4 DB-eq 0.000605 0.00346
MECP Kg 1,4 DB-eq 0.000465 0.00267
HTP Kg 1,4 DB-eq 0.351261 2.02566
Based on the impact analysis, the results obtained for product A and product B. Table 3 describes
the number of pollutants caused by producing one sachet of product A with a size 40 g and one sachet
of product B with a size 200 g, so created an environmental impact potential that stated on each
environmental impact characteristic.
Figure 3. Contribution of the Subsystem for the Environmental Impact Potential of Product A and B.
This characteristic is presented in Figure 3 to understand which step has the most contribution to
every environmental impact potential. Figure 3 explain that the most potential environmental impact is
8The 1st Journal of Environmental Science and Sustainable Development Symposium IOP Publishing
IOP Conf. Series: Earth and Environmental Science 716 (2021) 012038 doi:10.1088/1755-1315/716/1/012038
caused by the manufacturing process (Subsystem two), followed by transportation process of raw and
packaging material (Subsystem one) and then waste transportation to the third party. Manufacturing
process of product A and product B contributes 98.8% and 98.3% environmental impact potential, raw
and packaging material transportation contributes 1.1% and 1.6% environmental impact potential, and
waste transportation contributes 0.1% environmental impact potential for both products.
The next step is doing the normalization process, grouping and weighting to understand the whole
process is the most environmental impact. Figure 4 explains the result of normalization, grouping, and
weighting impact characteristics to determine the most significant environmental impact. Product A
dan B shows same significant environmental impact but in different weights. Product A has Human
Toxicity 64.1%, Freshwater Ecotoxicity 13.2%, and Marine Ecotoxicity 12%. Product B has Human
Toxicity 64.2%, Freshwater Ecotoxicity 13.1%, and Marine Ecotoxicity 22.1%.
Figure 4. Environmental Impact Potential Percentage on Product A and Product B.
3.4. Interpretation
The result will become the base to determine the conclusion, recommendation, and decisions that
conform to the definition of goal and scope. The results obtained from the gate to gate life cycle:
manufacturing process has the most significant effect for the entire of environmental impact potential,
material transportation process contributed second but not as significant as the manufacturing process,
and waste transportation to the third party contributes very least. The impact result is identified in
detail about its contribution to every subsystem process by the input allocation approach. Figure 5
shows in detail the contributors to the environmental impact of product A and product B. Inputs in the
manufacturing process are raw material, packaging material, electricity, and cleaning machine process
(usage of cleaning material, water, and transportation of cleaning material). Input in the transportation
of raw and packaging material uses fuel calculated in SimaPro 9.1 based on distance. Input in waste
management is used fuel for transportation waste and electricity consumption for pumping wastewater.
Based on the result (Figure 5) can be described that usage of raw material gives the largest
contribution for all potential environmental impact category (60-80% in every category), usage of
packaging material gives the second largest contribution 5-10% for every environmental impact except
POFP and usage of electricity to be the third place of contribution less than 3% for every
environmental impact except POFP environmental impact. Transportation raw and packaging material
gives very little contribution (less than 2%) except in POFP (less than 30%), and waste transportation
to the third party gives the least contribution (less than 1%) for every potential environmental impact.
9The 1st Journal of Environmental Science and Sustainable Development Symposium IOP Publishing
IOP Conf. Series: Earth and Environmental Science 716 (2021) 012038 doi:10.1088/1755-1315/716/1/012038
Figure 5. Impact Category of Each Process Involved Considering the Input Allocation Approach.
3.4.1. Raw Material and Packaging Material. The raw material is the most contributor to
environmental impact potential, approximately 60-80% in every impact category of product A and
product B. The packaging material usage stands in the second contributor, about 5-10% except for
POFP. Potential environmental impact from raw and packaging material is caused from the production
process to manufacture these materials or other processes to produce materials. During the process of
material production by suppliers causes pollutants that cannot be controlled by PT. X. These pollutants
indirectly will accumulate and to be part in the environmental impact potential caused by PT.X,
because PT. X use this material as input for its production process. Allia's research stated that the most
contributor to environmental impacts potential is production process of materials used as input for
product production [15].
In packaging materials usage, González-García’s research stated that the production of yogurt
containers and other packaging materials made an outstanding contribution to AP (41%) and CED
(43%). Plastic materials have a big environmental impact because, in addition to using non-renewable
materials (plastics), it also requires a large amount of energy for the material extraction process [18].
In raw material usage, half-finished milk powder input gives the most contributor to the entire
environmental impact potential. It is supported by the usage amount of half-finished milk powder in
product A production, and product B is more than 50% of the whole raw materials. Milk material used
in product A and product B is originated from dairy cow's farm. Half-finished milk powder's
production process consists of the raw milk's evaporating process until its dry by drying the fresh
milk's water content until a specific concentration. The drying process requires a lot of energy. The use
of energy creates pollutants that cause potential environmental impacts. Similar to González-García's
research states, milk-based-inputs which are milk powder and concentrated milk is the most
contributor of environmental impact for the process of manufacture with a contribution of AP 86%, EP
89%, GWP 50%, LC (land competition) 84% and POFP 58% [14].
Environmental impact contribution of milk powder usage as raw material not only occurs from the
production process of material but also from the material's farming process. The farming process
creates pollutants that can be analyzed. De Bruyn stated photochemical oxidant formation from CH4
emission, especially that is originated from farming; acidification caused by NH3 emission from the
usage of ammonia in farming; and eutrophication occurred by the emission of farming activity like
usage of fertilizer and animal dung, human toxicity and ecotoxicity [21]. Based on research by Djekic
state that the farming process is the most contributor to the environmental impact potential of milk
powder production with cradle to grave/gate scheme [22]. González-García and Djekic explained that
10The 1st Journal of Environmental Science and Sustainable Development Symposium IOP Publishing
IOP Conf. Series: Earth and Environmental Science 716 (2021) 012038 doi:10.1088/1755-1315/716/1/012038
one of the reasons farming gives environmental impact is an emission of CH4, NO3, and NH3
originated from the management of animal dung and also emission of SO2 and NOx from the usage of
fuel for farming machine [18], [22].
3.4.2. Electricity. The usage of electricity becomes the third contributor (less than 5%) of the
environmental impact except for the impact of the POFP. Electricity usage is similar to raw and
packaging material usage, which gives a contribution to emission indirectly. Contribution originates
from the usage of fossil fuel to produce electricity by PT. PLN. The environmental impact occurs from
heavy metal, which is released as a footprint element in fossil fuel usage [20]. Most State Electric
Enterprise in Indonesia is still using fossil fuel (more than 45% based on electricity reports in 2019) in
their production, so it creates emissions like SOX, NOX and CO2, which result in potential
environmental impacts. Other than that, the fossil fuel mining process also contributes to several
impacts: human toxicity and ecotoxicity [20]. Emission created is directly proportional to the usage of
energy, so it makes an environmental impact. In Product A, the production process (7188 Kwh) and
material storage (3673 Kwh) are the largest contributors to electricity usage's environmental impact. In
Product B, material storage (3420 Kwh) and production process (2270 Kwh) are the largest
contributors to electricity usage's environmental impact.
3.4.3. Transportation. Raw and packaging material transportation contributes a tiny part (less than 2%)
of the whole environmental impact except POFP impact (less than 30%). Figure 5 explains that raw
material transportation gives the largest contribution to the environmental impact between raw and
packaging material transportation. Raw material transportation of Product A and B creates
approximately 30% POFP environmental impact and less than 5% for other categories. In
transportation activity of raw and packaging material, transportation of the main raw material for semi-
finished powdered milk has 82% contribution besides other raw material and packaging material
transportation, especially on the impact of POFP. The POFP environmental impact is caused by
emission (NOx) created by the usage of fuel. The main source of NOx emission to created POFP
impact is originated from a high-temperature combustion engine [20]. Emission is created directly
proportional to the distance of transportation, so it makes an environmental impact. Raw material
transportation of milk powder has a significant contribution because the material is occupied outside
Indonesia (21.079 km and 10.915 km).
Based on the whole explanation shows that raw and packaging materials are more responsive to
the environmental profile of product A and product B’s life cycle. An alternative suggested to PT.X to
minimize raw and packaging material used is efficiency raw and packaging material usage. Table 2
shows that the total solid waste of production and packaging process is 1,411.7 kg for Product A and
52.92 kg for Product B. Another alternative is choosing another supplier who has a friendly
environmental process and products. Minimizing electricity usage can be done by creating more
efficient electricity regulation. This is caused by electricity is supplied from a third party (State
Electric Enterprise), not from its production. An example of electric efficiency is to minimize the
usage of lights. Minimizing Photochemical Oxidant Formation (POFP) environmental impact in the
transportation process can be done with milk transportation efficiency, which is the main cause of
POFP. Increasing efficiency can be done by using another supplier originated inside Indonesia, which
has fulfilled the industry criteria, so fuel consumption for transportation can be minimized.
4. Conclusion
The results showed a total of pollutants assessed from the life cycle of product A and product B that
had a potential environmental impact. Pollutants produced as a cause of potential environmental
impacts not only influenced by the output of manufacturing process but also influenced by using the
inputs. Besides the manufacturing process, other processes such as material transportation also
contribute to the impact of producing products A and B. The result of this research also provide
information to the management of PT. X, that is important to assess the environmental performance of
11The 1st Journal of Environmental Science and Sustainable Development Symposium IOP Publishing
IOP Conf. Series: Earth and Environmental Science 716 (2021) 012038 doi:10.1088/1755-1315/716/1/012038
the product life cycle in order to solve all environmental problems caused by the manufacturing
process of the product. The result of this research also serves as a benchmark for PT. X to do innovates
its environmental performance. This innovation is carried out to improve environmental performance
of the company and provide motivational benefits for the company to reduce pollution due to the
production process to make a healthier environment and produce eco-friendly products.
Acknowledgments
The authors are much thankful to PT.X for helping to finish this research. Special thanks to related
divisions: plant department, procurement department, engineer department that provided data related
to this research. This study was financially supported by the Universitas Indonesia within the
International Indexed Publications Social-humanity program (PUTI SOSHUM) 2020 (Contract No.
NKB-2558/UN2.RST/HKP.05.00/2020).
References
[1] Herva M, Franco A, Carrasco E F, and Roca E 2011 Review of Corporate Environmental
Indicators Journal of Cleaner Production 191687-1699
[2] Kautzar G Z, Sumantri Y, and Yuniarti R 2013 Analysis of the Environmental Impact on
Leather Product Supply Chain Activities Using the LCA and ANP Methods Jurnal Rekayasa
dan Manajemen Sistem Industri 3 200-211
[3] Palupi A H, Tama P I, and Sari R A 2014 Evaluation of the Environmental Impact of Paper
Products Using a Life Cycle Assessment (LCA) and Analytic Network Process (ANP) Jurnal
Rekayasa dan Manajemen Sistem Industri, 2 1136-1147
[4] ISO 14040 2016 Environmental Management — Life Cycle Assessment — Principles and
Framework. (Jakarta: Badan Standarisasi Nasional)
[5] Honsono N 2012 Analysis of the Bioethanol Life Cycle Based on cassava and oil palm empty
bunches in Indonesia (Jakarta: Universitas Indonesia)
[6] Eide M H 2002 Life cycle assessment (LCA) of industrial milk production International Journal
of Life Cycle Assessment 7 115-126
[7] Bingxiong L, Xiangyuan D, and Simin H 2016 The economic and environmental implications of
wastewater management policy in China: From the LCA perspective Journal of cleaner
production 142 3544-3557
[8] Sopha B M, Setiowati, and Ma’mun S 2017 Environmental assessment of motorcycle using a
life-cycle perspective Jurnal IJOLCAS 1 22-28
[9] Harjanto T R, Fahrurrozi, and M. Bendiyasa M I 2012 Life cycle assessment of PT Holcim
Indonesia Tbk cement factory. cilacap plant: comparison between coal fuel and biomass Jurnal
Rekayasa Proses 6 51-58
[10] Finnveden G, Hauschild M Z, Ekvall T, Guinee J, Heijungs R, Hellweg S, Koehler A,
Pennington D, and Suh S 2009 Recent developments in Life Cycle Assessment,” J. Environ.
Manage. 91 1–21
[11] Finnegan W, Goggins J, Clifford E, and Zhan X 2015 Global warming potential associated with
dairy products in the Republic of Ireland Journal of cleaner production 163 262-273
[12] Putri R P, Tama I P, and Yuniarti R 2014 Environmental Impacts Evaluation in Supply Chain
Activity of Kud Batu’s Dairy Product Using Life Cycle Assessment (LCA) Implementation and
Analytic Network Process (ANP) Approach Jurnal Rekayasa dan Manajemen Sistem Industri 2
[13] Finnegan W, Goggins J, Clifford E, and Zhan X 2016 Environmental impacts of milk powder
and butter manufactured in the Republic of Ireland Sci. Total Environ. 579 159–168
[14] González-García S, Castanheira E, Dias A, and Arroja L 2012 Environmental life cycle
assessment of a dairy product: the yoghurt International Journal of Life Cycle Assessment
volume 18 796–811
12The 1st Journal of Environmental Science and Sustainable Development Symposium IOP Publishing
IOP Conf. Series: Earth and Environmental Science 716 (2021) 012038 doi:10.1088/1755-1315/716/1/012038
[15] Allia V, Chaerul M, and Rahardyan B 2018 Life Cycle Assessment (LCA) Study of a Milk
Powder Product in Aluminium Foil Packaging Indonesian Journal of Life Cycle Assessment and
Sustainability 2
[16] Nunes O S, Gaspar P D, Nunes J, Quinteiro P, Dias A C, and Godina R 2020 Life-Cycle
Assessment of Dairy Products—Case Study of Regional Cheese Produced in Portugal MPDI
Journal, 8 1182
[17] Xu C, Huang J, and Chen F 2013 The Application of Carbon Footprint in Agri-Food Supply
Chain Management: Case Study on Milk Products Advanced Materials Research 807-809 1988-
1991
[18] González-García S, Castanheira E G, Dias A C, and Arroja L 2013 Using life cycle assessment
methodology to assess UHT milk production in Portugal Sci. Total Environ. 442 225-234,
[19] Santos Jr H S, Maranduba H L, Neto J A A, and Rodrigues L B 2017 Life cycle assessment of
cheese production process in a small-sized dairy industry in Brazil Environmental Science and
Pollution Research 24 3470–3482
[20] ISO 14044 2017 Environmental Management – Life Cycle Assessment – Requirements and
Guidelines (Jakarta: Badan Standardisasi Nasional (BSN))
[21] De Bruyn S, Bijleveld M, De Graaff L, Schep E, Schroten A, Vergeer R, and Ahdour S 2018
Environmental Prices Handbook- EU28 version (Delft University of Technology)
[22] Djeckic I, Miocinovic J, Tomasevic I, Smigic N, and Tomic N 2014 Environmental Life-Cycle
Assessment of Various Dairy Products Journal of Cleaner Production, 68 64-72
13You can also read