Transit 141 - Infrastructure Report Card
←
→
Page content transcription
If your browser does not render page correctly, please read the page content below
Transit

                                         141
                                        ________

                        2021 INFRASTRUCTURE REPORT CARD
Photo by Anna Denecke
                             www.infrastructurereportcard.org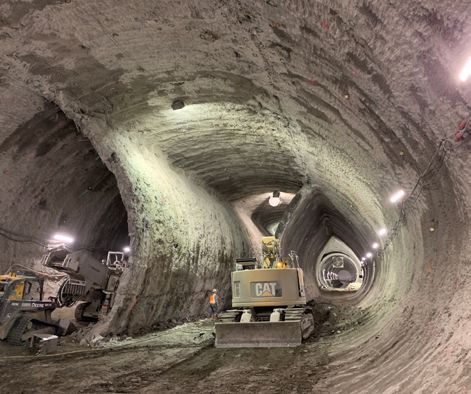
EXECUTIVE SUMMARY
                 Public transit is essential to everyday living in communities across the
                 country, providing access to jobs, schools, shopping, healthcare, and other
                 services, while enabling equitable access and sustainable mobility options.
                 Unfortunately, 45% of Americans have no access to transit. Meanwhile,
                 much of the existing system is aging, and transit agencies often lack
                 sufficient funds to keep their existing systems in good working order. Over
                 a 10-year period across the country, 19% of transit vehicles, and 6% of fixed
                 guideway elements like tracks and tunnels were rated in “poor” condition.
                 Currently, there is a $176 billion transit backlog, a deficit that is expected to
                 grow to more than $250 billion through 2029. Meanwhile, transit ridership
                 is declining, a trend compounded by the COVID-19 pandemic. Failure to
                 address the transit revenue shortfall will only exacerbate ridership declines
                 as service cuts mean that trip delays and reliability issues become more
                 frequent. This stands to increase congestion, hamper the economy, and
                 worsen air quality in the coming years.

CAPACITY & CONDITION
Transit has a presence in every state and community
across the nation, whether it’s heavy rail systems in New
York, Atlanta, San Francisco, or Washington D.C.; light
rail transit in Boston, Denver, or Minneapolis; bus rapid
transit lines in Los Angeles, Cleveland, and Albuquerque;
or bus networks and paratransit services that connect
urban and rural communities across the country.

In total, there are about 6,800 organizations in the U.S.
that provide transit services. In 2018, the Federal Transit
Administration reported 2,207 transit systems received
federal grant money, 928 of which were in urbanized areas
and 1,279 in rural areas. Since the 1970s, transit has shown
long-term growth in ridership, especially as networks have
expanded beyond their traditional footholds. While the
overall number of transit passenger trips has increased by
37% over the past 50 years, the total number of trips has
decreased by 8% since its peak in 2014. The COVID-19
pandemic has only sharpened this decline, with the                        Photo courtesy of Cherisha
                                                                                       BUS STOP IN HUNTINGTON BEACH, CALIFORNIA

                                                               142
                                                               ________

                                             2021 INFRASTRUCTURE REPORT CARD
                                                  www.infrastructurereportcard.org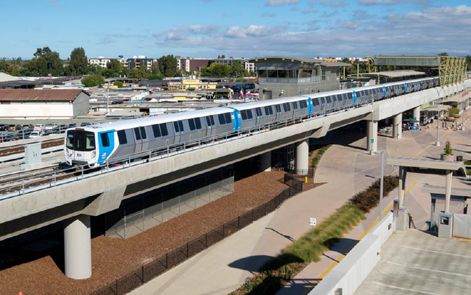
American Public Transportation Association (APTA)                     operate on 1,811 miles, a dramatic 30% increase over
reporting at the beginning of the pandemic that stay-at-              that same 10-year period.6
home orders caused some agencies to experience a 70%
                                                                It has been reported that 41.7% of U.S. households
passenger decline.1 2 3 4
                                                                have only one vehicle or less and could benefit from
Between 2017 and 2019, there was a slight decline in total      transit options, and 45% of Americans have no access
ridership from 10.1 to 9.9 billion                                                     to transit. System growth has the
passenger trips. Over this period,                                                     potential to increase capacity, but
bus ridership continues to be the       Unfortunately, the COVID-19                    it must be coupled with routine
most used form of public transit,        pandemic has caused major                     maintenance for the older parts of
averaging 4.7 billion passenger                                                        the system. Unfortunately, capital
                                        disruptions across all transit
trips annually, followed by heavy                                                      investments for a growing number
rail at 3.8 billion, light rail at 524   agencies.      Nationally,  transit           of state-of-good-repair needs
million, commuter rail at 503            ridership and fare revenues                   has not taken place. As a result,
million, demand response at            were down in April 2020 from                    transit users face increased delays
207 million, and trolley bus at 81      April 2019 by 73% and 86%,                     due to service interruptions,
million passenger trips annually.    5
                                                                                       and agencies are grappling with
                                        respectively. As the pandemic
                                                                                       growing maintenance and vehicle
Many transit systems have              drags on and continues to neg-                  procurement costs. Under the
invested in expansion to
                                        atively impact ridership, this                 most recent 10-year projections,
improve access and service
                                         trend will continue to create                 spare vehicle costs are expected to
levels. Over the last two
                                                                                       grow to $770 million, while vehicle
decades, 52 new systems and            difficult financial situations as
                                                                                       maintenance costs are likely to
124 extensions have opened,            agencies look to improve their                  grow to $7.3 billion. These delays
resulting in a total of 1,393                transit infrastructure.                   will cost passengers nearly $1.2
additional segment miles. In
                                                                                       billion over the next 10 years.7 8 9
2019, this expansion resulted
in the nation’s transit system comprising over 240,000          Transit vehicles and physical infrastructure must both be
route miles. Additionally, buses operate on over                in good condition for the system to perform to expected
226,000 miles of streets and roads. While most bus              levels. Yet, in 2017 the Department of Transportation
services operate in mixed traffic, service is also provided     reported that over a 10-year period, 36.4% of facilities
on 4,864 miles of exclusive and controlled right-of-way,        (bus and rail maintenance buildings and equipment/storage
of which 1,105 miles are exclusive fixed guideway, where        yards), 21.4% of systems (train control, electrification,
only transit can operate, allowing for greater travel time      communications, and revenue collection), 18.5% of
reliability. Furthermore, commuter and hybrid railroads         vehicles, 6.4% of fixed guideway elements (tracks,
operate over a combined 9,227 miles, a 12% growth in            tunnels, and bus guideways), and 5.5% of stations rated
miles over a 10-year period, while light rail/street cars       in “poor” condition.10 As a result, reliability challenges

                                                                Transit users face increased
                                                                    delays due to service
                                                                interruptions, and agencies
                                                                are grappling with growing
                                                                  maintenance and vehicle
                                                                     procurement costs.

                                                           143
                                                           ________

                                          2021 INFRASTRUCTURE REPORT CARD
                                               www.infrastructurereportcard.org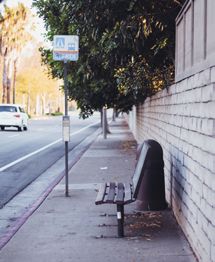
frequently plague our nation’s transit systems. Failure to                  maintenance work. The American Association of State
address these systemic problems will likely cause more                      Highway and Transportation Officials (AASHTO)
trip delays and travel time uncertainty, perpetuating                       recently reported that more than $19 billion was spent
ridership declines that result in reduced funding available                 by state DOTs on transit systems, $11.5 billion was spent
for operation and maintenance.                                              on operating costs, $4.4 billion on capital, $3.1 billion on
                                                                            unrestricted, and $6.5 million was spent on planning.11
Aging assets mean that state and local governments
must increasingly fund transit system operations and

                                         Transit Vehicles Past Useful Life
          80
                                                                                                 Years of Useful Life
          70                                                                                     Percent Past Useful Life

          60

          50                                                                                     56

          40
                                          39       37           39
          30                                                                 33
                                                                                                               31
          20                                                                                                           25
                            20
          10
                    14
                                                                                          7
            0
                       Buses           Commuter Rail            Commuter                 Demand               Light Rail
                                        Locomotives              Rail Cars              Responsive             Vehicles
                                                                                         Vehicles

FUNDING & FUTURE NEED
Transit system operating budgets traditionally rely on                      $60 billion, $12 billion is authorized under general
fare revenue and state and local funding. In 2018, total                    fund appropriations to be directed to numerous FTA
transit funding increased by 1.8% to $74.2 billion from                     programs, including the Capital Investment Grant
the previous year total of $71.1 billion. The Federal Transit               (CIG) program. CIG serves as the primary federal
Administration (FTA) also reported in 2019 that directly                    discretionary source of funds for transit expansion.
generated revenues funded 35.7% of transit operating                        While it is currently authorized at $2.3 billion, recent
expenses, state sources covered 23%, local resources                        efforts in both fiscal year (FY) 2018 and 2019 have
covered 34.2%, and federal funding covered the remaining                    seen an increase to $2.6 and $2.5 billion, respectively.
7.1%. Under these conditions, a backlog of $176 billion for                 The remaining $48 billion is directed out of the Highway
transit investments has emerged and is expected to grow                     Trust Fund (HTF) to support transit infrastructure,
to more than $250 billion through 2029.14 15                                including a combined $12.9 billion for state-of-good-
                                                                            repair needs. In October 2020, Congress passed a
As part of transit’s federal funding, the Fixing America’s
                                                                            one-year extension of the FAST Act, which extended
Surface Transportation (FAST) Act provided roughly
                                                                            the law’s FY 2020 authorization levels to FY 2021. This
$60 billion to the FTA, both through general fund
                                                                            includes a total of $12.5 billion for FTA and $2.3 billion
authorizations and Highway Trust Fund (HTF) contract
                                                                            for CIG.
authority through the Mass Transit Account. Of this

                                                                 144
                                                                 ________

                                               2021 INFRASTRUCTURE REPORT CARD
                                                    www.infrastructurereportcard.org
The COVID-19 pandemic has at least temporarily essential to ensuring populations have access to transit
increased the federal government’s funding role for and these systems are kept in good working order.
transit. While much is yet to be determined for stabilizing There has been a slight increase in state transit fund-
this system, $25 billion in emergency relief funding for ing, from $18.1 billion in 2016 to $19.2 billion in 2018.
operating expenses went to transit agencies as part Additionally, local support for transit investment has
of the CARES Act to mitigate lost tax and passenger also continued to grow. Since 2017, APTA reported
revenue during the pandemic. Under the Consolidated that over 70% of all transit-related ballot initiatives in
Appropriations for FY 2021, Congress provided an the U.S. were approved. Recent success has provided
additional $14 billion in relief. additional funds and demonstrated a public interest in
further investment in our transit systems, as seen in
Federal funding is critical to supporting robust transit
Table 1.16 17 18 19
systems. However, the state and local role is similarly
Ballot Measure Results for Transit, 2018-2020
2018 2019 2020
Public Transit Measures on the Ballot 38 20 52
Wins for Transit 31 16 47
Losses for Transit 7 4 5
Revenue Total (Billion $) $2.28 $7.23 $1.88
Photo courtesy of Valley Transportation Agency
BART TRAVELS ABOVE GROUND IN THE BAY AREA.
145
________
2021 INFRASTRUCTURE REPORT CARD
www.infrastructurereportcard.orgPUBLIC SAFETY
In 2018, there were 255 transit-related fatalities across have half the traffic fatality rates as metro areas with less
the nation. Over a three-year period, total transit- transit ridership. Specifically, metro areas with over 40
related fatalities have remained relatively stable with a annual transit trips per capita have about half the traffic
slight uptick in incidents. Comparatively, motor vehicle fatality rate of metro areas with fewer than 20 transit
fatalities have remained high, exceeding 35,000 deaths trips per capita. Robust investment in transit systems
a year since 2017.20 21 22 develops life-saving benefits because this mode provides
an alternative for high-risk and vulnerable road users as
Recent studies have found that areas with strong public
well as compact development that encourages safer traffic
transportation networks have significantly lower overall
speeds.23
traffic fatality rates. Metro areas with high transit ridership
Photo courtesy of WSP
CONSTRUCTION FOR THE LOS ANGELES REGIONAL CONNECTOR
146
________
2021 INFRASTRUCTURE REPORT CARD
www.infrastructurereportcard.orgRESILIENCE
Transit systems’ resilience has been strained in recent a reduction in fuel consumption by 4.16 billion gallons in
years due to a variety of hazards, such as sea level rise, 2017, and a decrease of another 1% the following year.
extreme winter weather, and the global health pandemic. Twenty-five years ago, 95% of the nation’s bus fleet
was diesel powered, but that number has dramatically
Transit resilience must accommodate the needs of
decreased now to only 42%. Furthermore, hybrid
individual communities, including system availability and
electric buses saw an increase from just 1% in 2005 to
accessibility, to promote healthy, economically viable, and
18% in 2019. Meanwhile, natural-gas–powered buses
environmentally friendly communities. Recent studies
saw an increase from 18% in 2009 to 29% in 2019. 24 25
have shown that improved transit access has the potential
to increase employment opportunities and broaden New resilience challenges have also emerged amid the
overall economic activity. Seen over a 20-year period at COVID-19 pandemic. While transit has played a key
current wage rates, for every $1 billion invested in public role in safely moving essential workers, an emerging task
transportation, roughly 49,000 jobs are created. from the pandemic will be to establish and maintain new
passenger safety measures amid large revenue declines.
In recent years, transit agencies have taken strides to
Additionally, transit agencies will need to build consumer
minimize their environmental impact, moving fleets
confidence in the public health and safety of riding on
toward less reliance on fossil fuels, which accounted for
transit systems.26 27
INNOVATION
In recent years, many transit agencies have entered micromobility trips; this included 38.5 million scooter
partnerships with mobility providers, as these services trips, 36.5 million station-based bikeshare trips, and
complement public transit by providing service during 9 million dockless bikeshare trips, of which 6.5 million
irregular hours, making first/last-mile connections, were on e-bikes.30
or providing transportation service in underserved
areas. Emerging Mobility on Demand (MOD) and Connected and autonomous vehicles (CAVs) are also
micromobility services, such as transportation network changing the way our transit agencies are operating.
companies and bike or scooter share, have played a critical Across the U.S., several transit agencies have be-
role in expanding the definition of public transit. Though gun to offer service on autonomous buses, and many
MOD is still evolving, these services can provide solutions low-speed automated pilots have begun. Additionally,
to equitable transportation access, payment options, dozens of pilot programs have identified funding and are
travel updates, multimodal connections, and enhanced in various stages of planning and implementation. While
communication between the user and MOD systems.28 29 this technology currently operates on a small scale,
Nearly overnight, micromobility began to have a the FTA continues to implement the Strategic Transit
presence in communities of all sizes across the country. Automation Research (STAR) Plan, which studies the
Over a near 10-year period, we have seen annual opportunities and associated automation risks and sug-
micromobility trips rise from roughly 320,000 to nearly gests that this technology will continue to be incorpo-
1 billion. In 2018, there was a total of 84 million shared rated into the system.31
147
________
2021 INFRASTRUCTURE REPORT CARD
www.infrastructurereportcard.orgRECOMMENDATIONS
TO RAISE THE GRADE
· Transit is essential to creating more surface transportation system capacity and should
be at the forefront in how communities develop multimodal connectivity. This in-
Transit cludes integrating transit and micromobility options with equitable access for all.
· Congress and the Administration should fix the Highway Trust Fund (HTF) by add-
ing 25 cents to the current motor fuels user fee over the next five years and then
index future increases against inflation using a multi-year rolling average of key in-
dicators, such as the Producer Price Index or Consumer Price Index. As part of
the solution to fix the HTF’s funding shortfall, there should be an effort to explore
future long-term revenue solutions.
· Increase investment from state and local governments as well as the private sec-
tor to reduce the backlog of rehabilitation needs and increase transit mode share.
Continue increased investment in federal grant programs that improve and support
capital development.
· Encourage the continued implementation of new technology into our transit system
to leverage innovation and mobility options. Together, these will continue to expand
and enhance the transit ecosystem to provide better access for all communities.
· Apply asset management best practices to minimize long-term lifecycle costs and
improve the system’s overall condition.
148
________
2021 INFRASTRUCTURE REPORT CARD
www.infrastructurereportcard.orgSOURCES
1. American Public Transportation Association, “2020 Public Transportation Fact
Book,” 71st edition, March 2020.
Transit 2. U.S. Department of Transportation, Federal Transit Administration, The National
Transit Database (NTD), “NTD Data.”
3. American Public Transportation Association, “2018 Public Transportation Fact
Book,” 69th edition, December 2018.
4. American Public Transportation Association, “Policy Brief: Impact of COVID-19 on
Public Transit Agencies,” March 2020.
5. American Public Transportation Association, “Ridership Report.”
6. American Public Transportation Association, “2020 Public Transportation Fact
Book,” 71st edition, March 2020.
7. American Society of Civil Engineers, “Failure to Act: Current Investment Trends in
our Surface Transportation Infrastructure,” 2021.
8. American Public Transportation Association, “Public Transportation Facts.”
9. U.S. Census Bureau, “American Community Survey.”
10. U.S. Department of Transportation, Federal Highway Administration,” Status of
the Nation’s Highways, Bridges, and Transit: Conditions and Performance Report,”
23rd Edition.
11. The American Association of State Highway and Transportation Officials, “Survey
of State Funding for Public Transportation: Final Report 2020, Based on FY2018
Data,” 2020.
12. American Public Transportation Association, “Policy Brief: Impact of COVID-19 on
Public Transit Agencies,” March 2020.
13. American Public Transportation Association, “The Impact of the COVID-19
Pandemic on Public Transit Funding Needs in the U.S.,” May 5, 2020.
14. U.S. Department of Transportation, Federal Transit Administration, National Transit
Database, “2019 National Transit Summaries and Trends, (NTST).”
15. American Society of Civil Engineers, “Failure to Act: Current Investment Trends in
our Surface Transportation Infrastructure,” 2021.
16. The American Association of State Highway and Transportation Officials, “Survey
of State Funding for Public Transportation: Final Report 2020, Based on FY2018
Data,” 2020.
17. American Public Transportation Association, Nearly 90% of Transit Ballot Initiatives
Pass in 2017: https://www.apta.com/news-publications/press-releases/releases/
nearly-90-of-transit-ballot-initiatives-pass-in-2017/
149
________
2021 INFRASTRUCTURE REPORT CARD
www.infrastructurereportcard.orgSOURCES (Cont.)
18. American Public Transportation Association, Center for Transportation Excellence,
“Public Transportation Wins Big at 85% Approval in the Midterm Elections,”
November 7, 2018.
Transit
19. American Public Transportation Association, Center for Transportation Excellence,
“Campaigns: What Happened in 2020?”
20. U.S. Department of Transportation, Federal Transit Administration, “TS5.1 – Safety
and Security Time Series.”
21. U.S. Department of Transportation, National Highway Traffic Safety Administration,
Traffic Safety Facts: Research Note, “2017 Fatal Motor Vehicle Crashes: Overview,”
October 2018.
22. U.S. Department of Transportation, National Highway Traffic Safety Administration,
Traffic Safety Facts, “Early Estimate of Motor Vehicle Traffic Fatalities in 2019,” May
2020.
23. American Public Transportation Association, Policy Development and Research,
“Public Transit Is Key Strategy in Advancing Vision Zero, Eliminating Traffic
Fatalities,” August 2018.
24. American Public Transportation Association, “Economic Impact of Public
Transportation Investment: 2020 Update,” April 2020.
25. American Public Transportation Association, “Public Transportation Facts.”
26. American Public Transportation Association, “2019 Public Transportation Fact Book,”
70th edition, April 2019.
27. American Public Transportation Association, “2020 Public Transportation Fact
Book,” 71st edition, March 2020.
28. American Public Transportation Association, “Policy Brief: Continuing Impacts of
COVID-19 on Public Transit Agencies,” April 2020.
29. American Public Transportation Association, “The Impact of the COVID-19
Pandemic on Public Transit Funding Needs in the U.S.,” May 5, 2020.
30. National Association of City Transportation Officials, “Shared Micromobility in the
U.S.: 2018.”
31. American Public Transportation Association, “Economic Impact of Public
Transportation Investment: 2020 Update,” April 2020.
150
________
2021 INFRASTRUCTURE REPORT CARD
www.infrastructurereportcard.orgYou can also read