Additional Investigation of the Benefits of an Overnight Pricing Plan
←
→
Page content transcription
If your browser does not render page correctly, please read the page content below

Additional Investigation of the
Benefits of an Overnight Pricing
Plan
Evaluation of RPP Pilots and Development of Pricing
Options

Prepared for:

Ontario Energy Board

Submitted by:

Guidehouse Canada, Ltd.
First Canadian Place | 100 King Street West
Suite 4950 | P.O. Box 64
Toronto, ON, M5X 1B1 | Canada

416.956.5050
guidehouse.com

March 2022
Primary Authors

Judy Simon, Director
Adam Green, Managing Consultant

Contributing Authors

Peter Steele-Mosey, Associate Director
Bethany Glinsmann, Associate Director
Jane Hummer, Managing Consultant
Grace Sauter, Consultant
Additional Investigation of the Benefits of an Overnight Pricing Plan

Table of Contents
Disclaimers .................................................................................................................... 1
1. Introduction ............................................................................................................... 2
2. Survey Analysis......................................................................................................... 4
3. Test Hypothesis of Behavioural Fuel Switching..................................................... 6
       3.1 Methodology................................................................................................................ 6
       3.2 Load Shapes ............................................................................................................... 8
       3.3 Results ...................................................................................................................... 12
4. Estimate Benefits of Price Plan-Motivated EV Charging ..................................... 15
       4.1 Benefits of Shifting Charging from Non-Home to Home ............................................. 15
       4.2 Benefits of EV Adoption............................................................................................. 18
5. Findings and Conclusions ..................................................................................... 21

Confidential information for the sole benefit and use of the Ontario Energy Board.                                                 Page i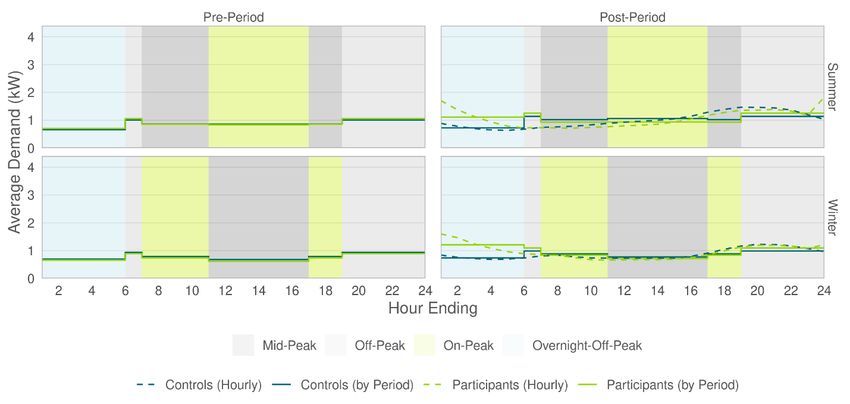
Disclaimers
This report was prepared by Guidehouse Canada, Ltd., f/k/a Navigant Consulting, Ltd.
(“Guidehouse”), for the Ontario Energy Board. The work presented in this report represents
Guidehouse’s professional judgment based on the information available at the time this report
was prepared. Guidehouse is not responsible for the reader’s use of, or reliance upon, the
report, nor any decisions based on the report. GUIDEHOUSE MAKES NO
REPRESENTATIONS OR WARRANTIES, EXPRESSED OR IMPLIED. Readers of the report
are advised that they assume all liabilities incurred by them, or third parties, as a result of their
reliance on the report, or the data, information, findings and opinions contained in the report.
© 2022 Guidehouse Inc. All rights reserved.

©2022 Guidehouse Inc. All rights reserved.                                                              1
1. Introduction
The Ontario Energy Board (OEB) has administered the Regulated Price Plan (RPP) since 2005.
In 2015, the OEB released the RPP Roadmap, which outlined a plan to review and update the
RPP to better respond to policy objectives, improve system efficiency, and provide greater
consumer control over bills 1. The RPP Roadmap sought to test ways to improve pricing
structures for residential customers. To this end, in 2017, the OEB commissioned pilots from a
group of Ontario local distribution companies (LDCs) to test the effects of a variety of price and
non-price treatments, and gain information required to advance the goals of the RPP.

Ultimately, 10 price and non-price treatments were implemented across four RPP pilots,
involving approximately 15,000 customers. The four RPP pilot proponents were required to file
interim and final reports evaluating the effectiveness of these pilots in achieving the RPP’s
goals. In 2019, the OEB contracted Guidehouse to conduct a review of these evaluation reports
(the Meta-Analysis). 2 The goal of the meta-analysis was to provide evidence-based advice to
the OEB regarding new or modified pricing plans and non-price tools that may be effective for
further the objectives of the RPP.

One of the RPP pilots, Alectra Utilities’ Overnight treatment, was in place between May 1, 2018,
and April 30, 2019. This was an opt-in pilot; participants agreed to participate. In this pilot,
participants accepted a higher On-Peak price (~18 cents/kWh) in exchange for a decreased
price in the period from midnight to 6am (~2 cents/kWh, or approximately one third the status
quo TOU Off-Peak price plan).

The evaluation of the Overnight price plan found consumption in the hours between midnight
and 6am increased 45% in the summer and 73% in the winter, with a 15% increase in overall
annual consumption for participants. Guidehouse hypothesized that the net increase in
consumption may be due to behaviour changes that were not captured by the analysis of the
meter data, such as shifting EV charging activities from public charging stations to the home or
replacing gas heating with electric heat overnight (behavioural fuel switching).

In its meta-analysis, Guidehouse made a series of recommendations for next steps. Amongst
these was the recommendation that additional analysis be applied to the Overnight pilot to
better identify the source of the impacts reported in the evaluation of that pilot and assess
whether the analysis conducted by the pilot’s evaluator had captured all the benefits provided by
the price plan. This report is intended to complete this recommendation and to provide the OEB
with a more informed basis on which to determine next steps regarding an Overnight price plan.

This report investigates the behaviour changes responsible for the net increase in consumption
associated with the Overnight price plan to test the hypotheses for the underlying causes of this
change presented in the Meta-Analysis. This report also estimates the benefits (e.g., avoided
energy, capacity, and carbon costs) associated with these changes in behaviour, benefits that
cannot be assessed based only the customer meter data and so were not estimated as part of
the pilot’s original evaluation. The two primary goals of this report are:

1 Ontario Energy Board,
https://www.oeb.ca/sites/default/files/uploads/RPP_Roadmap_Report_of_the_Board_20151116.pdf
2 Ontario Energy Board, https://www.oeb.ca/sites/default/files/report-RPP-Pilot-Meta-Analysis-20211110.pdf

©2022 Guidehouse Inc. All rights reserved.                                                                   2

•    Goal 1: Assess to what degree estimated pilot impacts can be attributed to EV-driving
         customers, and consequently identify whether the hypothesis of behavioural fuel
         switching can be rejected, and;
    •    Goal 2: Estimate the electricity system and avoided GHG benefits derived from EV-
         driving participants in the price plan pilot.

These goals are accomplished through three primary tasks, outlined in the following sections:

    1. Survey Analysis. Guidehouse, with the assistance of an internet-based survey
       instrument, identified those program participants that owned an electric vehicle prior to
       and during the pilot period.

    2. Test Hypothesis of Behavioural Fuel Switching. Guidehouse then re-estimated the
       impacts for the EV-owning group and the non-EV owning group to identify to what
       degree the overall average impact estimated by the pilot evaluation may have been
       driven by EV-based changes in behaviour.

    3. Estimate the Benefits of Price-Plan-Motivated EV Charging. Guidehouse then used
       EV charging profiles and estimates of incremental EV electricity use to estimate the
       system and societal benefits (not captured in previous analyses) of different types of
       participant response to the price plan.

©2022 Guidehouse Inc. All rights reserved.                                                         3
2. Survey Analysis
To determine whether the impacts of the treatment were driven by behavioural changes in
electric vehicle drivers, or from other sources (e.g., behavioural fuel switching), Guidehouse
needed to subset the group of pilot participants who operated electric vehicles. To do so,
Guidehouse developed a survey to be delivered to all participants of the Overnight pilot.
The survey instrument was developed by Guidehouse and aimed to answer a few key
questions:
• Did the participant own/lease an EV during the pilot period (May 1, 2017, to April 30,
2018)?
• Whether, as a result of the pilot, the participant remembers altering their vehicle
charging behaviour (e.g., shifting charging from workplace/public sources to home
charging).
• Whether, as a result of the pilot, the participant remembers altering other behaviour
(e.g., altering their use of home space heating).
The survey was administered by Alectra Utilities, sent to customers via email. Participants
responding to the survey received a $10 Amazon gift card as an incentive to participate. In total,
135 participants responded to the survey, of 440 Overnight pilot participants. Of the 135
respondents, the survey identified 63 who owned/leased an electric vehicle during their
participation in the treatment, and 72 who did not. Insights from the survey can be used support
Guidehouse’s evaluation of benefits not captured in the original evaluation.
Survey participants were asked, “Do you recall making any changes to your electric vehicle
charging habits as a result of the time-of-use rate pilot that you [participated in]?” As anticipated,
a majority of EV-owning respondents (92%) recalled shifting their home charging from on-peak
to off-peak times. However, only a small portion (5%) of respondents indicated that they recalled
shifting their charging from a workplace or public charging location to off-peak home charging.
This indicates that while a small percentage of the pilot did shift their load as hypothesized (from
a non-home to a home location), it likely does not account for the majority of increased load.
This subset of participants contributes to the increase in consumption, but is not the primary
driver of increase across the entire group.
Survey respondents were also asked to state the year/month that they purchased/leased their
EV. This allows Guidehouse to determine whether they were operating their EV prior to pilot
enrolment, after their participation in the pilot concluded, or most interestingly, whether they
purchased the EV while they were subscribed to the pilot. A large percentage of these
customers (43%) indicated that they first purchased/leased their EV while they were subscribed
to the treatment. In other words, their pre- and post-pilot consumption patterns may vary
significantly, as they are adding load from their vehicles. This hypothesis was not explored in
the Meta-Analysis, but could help explain the increase in consumption examined as a result of
the Overnight price plan. This hypothesis is explored further in this report.
©2022 Guidehouse Inc. All rights reserved. 4Figure 1. Survey Respondent Breakdown ©2022 Guidehouse Inc. All rights reserved. 5
3. Test Hypothesis of Behavioural Fuel Switching
In this task, Guidehouse used monthly usage data for participants and control customers and
incremental survey data from participants to test the hypothesis that a material proportion of
estimated winter demand impacts are a result of behavioural fuel switching.

3.1 Methodology
To test the hypothesis of behavioural fuel switching, in which customers are hypothesized to
replace gas heating with electric heat overnight, Guidehouse estimated participants’ behavioural
response to the Overnight pilot for two subgroups: those who owned an electric vehicle during
the pilot period, and those who didn’t. This analysis leverages customer usage data and survey
responses.

Guidehouse obtained the regression analysis dataset used by BEworks in that firm’s evaluation
of the Overnight pilot. 3 Some data manipulations were required to align the data with the
regression model, including: 1) removing observations that fall outside the time period of
analysis, 2) removing observations for customers who are neither pilot participants nor matched
controls, 3) creating the dependent variable as the average difference in usage from the post-
and pre-pilot periods, and 4) appending the price variable – which indicates whether a customer
was a participant or control – found in the hourly dataset to the model dataset. The number of
customers in the analysis data set exactly aligned with the numbers reported by BEworks.
Guidehouse estimated two regression models to quantify impacts. The first model was an exact
replica of the BEworks model, shown in Equation 1. The price variable indicates participation in
the pilot and is the primary variable of interest. The coefficient for the price variable, , is
calculated in the regression analysis and is an estimate of the change in demand (kW) in each
price period for pilot participants, as reported in Table 2.

3 Regulated Price Plan Pilot – Final Report. Prepared by BEworks and Alectra Utilities. Submitted to the Ontario
Energy Board on August 31, 2020. Available at:
https://www.oeb.ca/sites/default/files/Alectra-RPP-roadmap-12-Month-Report-20200831.pdf
BEworks provided monthly datasets used for the regression analysis and hourly datasets used for load shape plots
(post-period only). Guidehouse reconstructed the post-period monthly dataset, which consists of average usage per
month and TOU period, from the hourly data and found a small discrepancy for the Off-peak period. Specifically, the
values in the monthly dataset used for regression were 5.4% lower than the values recreated from the hourly dataset.
Because this difference impacted usage for both the participant and comparison groups and was relatively small in
magnitude, Guidehouse does not have concerns about this discrepancy biasing results.

©2022 Guidehouse Inc. All rights reserved.           6
Equation 1. Primary Regression Model

The second regression model used a lagged dependent variable (LDV) and is shown in
Equation 2. The pre-period usage appears on the right side of the equation as an independent
variable. The LDV model was estimated on a panel dataset, which includes monthly
observations for each customer. The model includes a set of binary variables indicating the
month. These monthly binary variables are included in isolation and interacted with pre-period
usage. Guidehouse estimated this model as a robustness check on the results of the primary
regression model. 4

                               Equation 2. Lagged Dependent Variable Model

The t subscript indicates the month of the pilot period. The LDV model clusters standard errors
at the household level. Guidehouse recommends clustering the standard error when working
with panel data to account for household-level correlation. Both the primary and LDV models
are estimated separately for the summer and winter seasons, and for each of the four TOU
periods, in accordance with the prior study. In both models, the    parameter represents the
estimated average change in kW for the specified season and TOU period. Guidehouse
estimated the primary and secondary regression models for the following groups of customers:
    •    All: All pilot participants and all matched controls
    •    Survey: Pilot participants who responded to the surveys and all matched controls 5
    •    No EV: Pilot participants who responded to the surveys and indicated they did not own
         an electric vehicle during the study period and all matched controls
    •    EV: Pilot participants who responded to the surveys and indicated they owned an
         electric vehicle during the study period and all matched controls

4 If the two different regression models generate similar results, then we are confident that the results are not an
artefact of the model specification, i.e., the impacts are robust to different specifications.
5 We analyze the set of survey respondents to understand to what degree relying on survey data (and respondents)

may bias the sample, compared to the full set of participants.

©2022 Guidehouse Inc. All rights reserved.           7
Table 1 shows the number of customers in each model group. The model data set incorporated
responses from two surveys: the original survey implemented by BEworks and the survey
implemented by Guidehouse for this study. 6 Guidehouse did not receive information to link
matched control customers to participants, so was unable to subset the control group to match
the changes in the participant sample. As a result, the full control group is used in all analysis
groups, and may include a mix of customers with and without EVs.
Table 1. Number of Customers by Analysis Group
All Survey No EV EV
Customers Respondents Group Group
Summer
Participants 340 145 74 71
Controls 361 361 361 361
Winter
Participants 302 124 83 41 7
Controls 430 430 430 430
3.2 Load Shapes
This section shows average load shapes by season for the pre-period and post-period, for each
of the four analysis groups:
• All participants
• Survey respondents
• No EV
• EV
Pre-period usage is shown in the panels on the left, in Figure 2 through Figure 5 below, while
post-period usage is shown in the panels on the right. The top row represents summer usage,
while the bottom row represents winter usage.
The solid lines show average usage by TOU period, with the background shaded to indicate the
TOU period. In cases where the TOU period is not contiguous, the solid line shows the average
for the full TOU period, rather than a partial period. The dashed lines show the average hourly
load that underlies the average usage by TOU period. The blue line represents average usage
for customers in the matched control group, while the green line represents average usage for
pilot participants. Hourly load is available only for the post-period.
The pre-period plots indicate how similar the matched control customer group’s usage pattern is
to that of the participant group.
6 Where responses disagreed, the response to the original survey was used, as it was closer to the analysis period in
question.
7 In alignment with the study conducted by BEworks, the set of customers differs for the summer and winter models.
Of the survey respondents who reported having an EV, 38 were included in both the summer and winter models, 33
were in the summer model only, and 3 were in the winter model only.
©2022 Guidehouse Inc. All rights reserved. 8Figure 2 shows average load shapes for all pilot participants and matched controls. The two
groups have similar usage patterns in the pre-period in both summer and winter, but differences
emerge in the post-period. The pilot participants have higher usage than the matched control
group during the Overnight Off-Peak period. Differences exist during all TOU periods, but the
overnight period has the largest impact and is the focus of this study.
Figure 2. Average Usage – All Customers
©2022 Guidehouse Inc. All rights reserved. 9Figure 3 shows average load shapes for pilot participants who responded to the survey and all
matched controls. The two groups have similar usage patterns in the pre-period in both summer
and winter, but slight differences emerge. These differences in pre-period usage may indicate
the presence of selection bias in the sample of pilot participants that responded to the survey.
The pre-period differences are small and are unlikely to bias the results sufficiently to
change the conclusions about impacts during the Overnight Off-Peak period. As seen
with the full study population, usage differs in the post-period for pilot participants and matched
controls. The pilot participants have higher usage during the Overnight Off-Peak period
compared to the matched control group, and the magnitude of the difference is larger for the
survey respondents compared to the full study group.
Figure 3. Average Usage - Survey Respondents
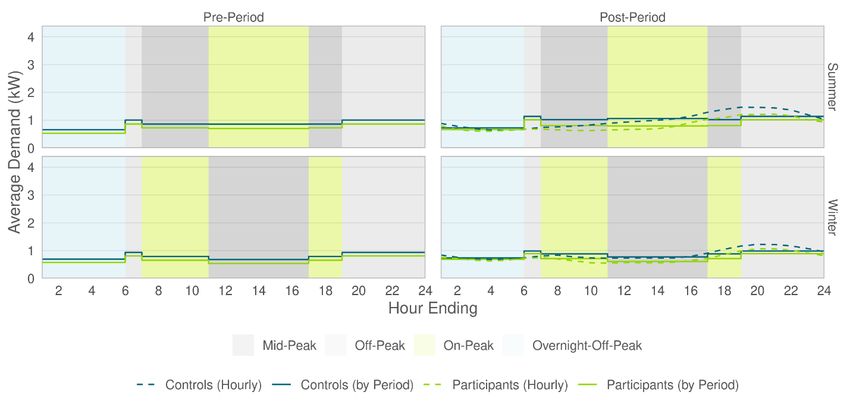
©2022 Guidehouse Inc. All rights reserved. 10Figure 4 shows average load shapes for pilot participants who responded to the survey and did
not have an EV during the analysis period, and all matched controls.
The two groups have similar usage patterns in the pre-period in both summer and winter, but
pilot participants have lower usage in all TOU periods in both the pre- and post-periods. These
differences in pre-period usage likely result from the matched control group containing a mix of
customers with and without EVs. The regression models use a difference-in-differences
approach, which controls for observed differences in usage in the pre-period.
In contrast to the full set of survey respondents, pilot participants who do not have an EV during
the analysis period exhibit only minor changes in energy usage during the Overnight Off-Peak
period. Instead, impacts are largest during the Mid- and On-Peak periods, when pilot
participants’ usage decreases compared to the matched control group. Put another way,
participants without EVs reduce their consumption during the most expensive parts of the day,
but do not materially increase it overnight.
Figure 4. Average Usage – No EV Group
©2022 Guidehouse Inc. All rights reserved. 11Figure 5 shows average load shapes for pilot participants who responded to the survey and had
an EV during the analysis period, and all matched controls.
The two groups have similar usage patterns in the pre-period in both summer and winter, but
pilot participants have higher usage in all TOU periods, with notable differences in the Off-Peak
and Overnight Off-Peak periods in the summer season. These differences likely result from the
matched control group containing a mix of customers with and without EVs. The regression
models use a difference-in-differences approach, which controls for observed differences in
usage in the pre-period.
As seen with the full set of survey respondents, differences in usage between pilot participants
and matched controls persist in the post-period but are larger than differences in the pre-period.
In particular, the pilot participants have higher usage during the Off-Peak and Overnight Off-
Peak periods compared to the matched control group, and the magnitude of the difference is 3
times larger in the summer and 4 times larger in the winter for the EV group than for the full set
of survey respondents.
Figure 5. Average Usage - EV Group
The large increase in Overnight Off-Peak usage for EV owners, compared to a small increase
for customers who do not own EVs, indicates that the overnight impacts estimated in the prior
study are driven largely by participants with EVs. The next section discusses the results of the
regression analysis that quantifies the impacts for each analysis group.
3.3 Results
Guidehouse estimated the regression models defined in Equation 1 and Equation 2 for each
season, TOU period, and analysis group. The full set of results appears in Table 2 below, which
provides the estimates of the parameter on price in the model specifications. The values in the
tables correspond to the average kW impact for each TOU period and analysis group, with
positive values indicating a load increase and negative values indicating a load decrease.
©2022 Guidehouse Inc. All rights reserved. 12The primary conclusion that can be drawn from these results is the net increase in consumption attributable to the Overnight pilot is primarily driven by EV participants. The average increase in consumption during the Overnight Off-Peak is approximately 20 (summer) to 40 (winter) times higher for EV participants than non-EV participants Guidehouse successfully replicated BEworks’ results for all pilot participants, as shown in the first column of Table 2. Additionally, the LDV model (column 2) generated similar results as the primary model for all pilot participants. While there are minor differences in the point estimates, the results of the primary and LDV models are not statistically significantly different from each other. The third and fourth columns in Table 2 provide the results for the models estimated using survey respondents and all matched controls. While results are generally similar to those using all pilot participants, the Overnight Off-Peak impact increased substantially in both summer and winter seasons. This indicates the energy usage patterns for survey respondents differ from those for all pilot participants. In particular, the proportion of EV owners may differ between all pilot participants and the survey respondents. Similar to the results from the models using all pilot participants, the LDV model and primary model produced similar results. Columns 5 through 8 in Table 2 provide results for the No EV and EV subgroups of survey respondents. Again, the primary and LDV models produced generally similar results for each subgroup. While both models lead to the same conclusions, the point estimates and statistical significance differ for some TOU periods, including the Overnight Off-Peak period. Guidehouse recommends using the results of the LDV model, which clusters the standard errors at the household level, but notes that both models lead to similar conclusions regarding the potential for behavioural fuel switching. The results for the No EV and EV subgroups for the Overnight Off-Peak period are highlighted in green in Table 2 (columns 6 and 8). In the summer, customers who reported owning an EV during the study period more than doubled their Overnight Off-Peak usage (1.115 kW, 115% increase), while customers who reported no EV increased their usage by a moderate amount (0.045 kW, 7% increase). Similar impacts occurred during the winter. Customers who reported owning an EV during the study period more than tripled their Overnight Off-Peak usage (1.988 kW, 246% increase), while customers who reported no EV increased their usage by a moderate amount (0.051 kW, 8% increase). Furthermore, increased usage for the No EV group was not statistically significantly different from zero in either season. ©2022 Guidehouse Inc. All rights reserved. 13
Table 2. Regression Results Summary (kW)
                              (1)            (2)            (3)             (4)          (5)            (6)           (7)          (8)
                          Primary
                                            LDV          Primary           LDV        Primary          LDV         Primary        LDV
  Model                    Model,
                                           Model          Model           Model        Model          Model         Model        Model
                         Replication
  Analysis Group              All            All         Survey           Survey       No EV          No EV           EV           EV

                                                                     Summer
  Overnight Off-
  Peak                    0.346 ***       0.352 ***      0.547 ***       0.559 ***     0.073 .        0.045        1.042 ***    1.115 ***
  Off-Peak                 0.058 *         0.066 *       0.088 *          0.106 **      0.018           0          0.162 ***     0.23 ***
  Mid-Peak                -0.082 ***      -0.083 ***    -0.105 ***       -0.105 ***   -0.071 *       -0.071 *      -0.141 ***   -0.134 ***
  On-Peak                  -0.1 ***       -0.103 ***    -0.114 ***       -0.117 ***   -0.107 **     -0.111 ***     -0.123 **    -0.118 ***
                                                                       Winter
  Overnight Off-
  Peak                    0.511 ***       0.505 ***      0.701 ***       0.693 ***      0.074         0.051        1.971 ***    1.988 ***
  Off-Peak                0.153 ***       0.149 ***      0.175 ***        0.171 **      0.036         0.022        0.457 ***    0.478 ***
  Mid-Peak                  0.005             0           -0.009          -0.013       -0.025         -0.025         0.022        0.024
  On-Peak                   0.012           0.011           -0.01        -0.011         -0.027         -0.023        0.023        0.025
                   Asterisks indicate statistical significance of the results, at the 5% (*), 1% (**), and 0.1% (***) levels.
                                           More asterisks indicate greater statistical significance.

The regression results provide evidence to reject the hypothesis that a material proportion of
estimated winter demand impacts are a result of behavioural fuel switching. The increase in
usage during the Overnight Off-Peak period is driven by the EV participants.

©2022 Guidehouse Inc. All rights reserved.                        14
4. Estimate Benefits of Price Plan-Motivated EV Charging
In the RPP Pilot Meta-Analysis, Guidehouse determined that the Overnight price plan yielded an
avoided cost benefit peak demand and On-Peak and Mid-Peak energy reduction that was less
than the incremental system costs of the additional overnight consumption. Guidehouse noted
in its analysis the behaviours that resulted in the net increase in load might be the source of
additional (untracked) system benefit that could not be assessed based solely on residential
customer electricity meter data.
Guidehouse hypothesized that two most probable sources for the net additional Overnight Off-
Peak and Off-Peak load were behavioural fuel switching or shifting of EV charging location. For
example, participants with EVs shifting from paying a per-hourly charge for EV charging (at their
workplace or a public charging station), to charging their EV at home overnight. The analysis
conducted in Section 3 determined that the increased overnight consumption observed in the
pilot could be attributed primarily to EV drivers. Due to the rejection of the hypothesis of
behavioural fuel switching and survey findings regarding EV purchases during the pilot period
(see Section 2) Guidehouse has refined its hypotheses; the increased consumption attributed to
the piloted price plan could be derived from:
• Participants shifting their load from non-home charging (e.g., workplace charging, public
charging) to home charging, or;
• Customers purchasing/leasing an EV while subscribed to the treatment plan, or shifting
driving from an internal combustion engine vehicle (ICEV) to an EV 8
The purpose of this task is to estimate benefits of the above hypotheses, which were not
quantified in the Meta-Analysis. In the Meta-Analysis, analysis of price plan impacts was limited
to the participants’ home electricity consumption data. As such, Guidehouse hypothesized that
the analysis understated the benefits of the plan.
First, an analysis only of participant advanced metering infrastructure (AMI) and billing data (and
not of non-home charging) does not quantify the demand reductions during system peak of a
shift from public charging at peak times to overnight charging at home. Secondly, the Meta-
Analysis did not quantify the societal benefits associated with customer uptake of EVs, such as
reductions in carbon footprint and impacts to customer’s bills.
4.1 Benefits of Shifting Charging from Non-Home to Home
4.1.1 Benefit Stream Definition
This section estimates the benefits assuming increased loads overnight are a result of drivers
shifting their charging from non-home (e.g., workplace or public) locations to home locations.
The benefits of this shift which were not captured in the Meta-Analysis include reductions in
peak period demand (Avoided Capacity costs) and reductions in energy consumed outside of
the overnight off-peak period (Avoided Energy costs). In the survey analysis, it was found that
few participants indicated they shifted their charging behaviour from a public to home location;
8 This explanation was previously unexplored in the Meta-Analysis. As the price plan had a limited duration, this was
treated as an edge case, and not fully explored in the Meta-Analysis report.
©2022 Guidehouse Inc. All rights reserved. 15however, the participants that did shift their charging contribute to the overall increase in
consumption seen from the Overnight group.
4.1.2 Calculation Methodology
To estimate the incremental benefits (not captured in the meta-analysis) of participants shifting
EV charging behaviour from day-time public charging to overnight public charging Guidehouse:
• Estimated the share of EV participants’ net increased consumption that may be
attributed to EV use
• Assumed that this incremental consumption had been shifted from public charging
• Applied this incremental consumption to day-time EV charging profiles to estimate the
day-time impacts, by time of day
• Applied the avoided energy and capacity costs to these time of day impacts to estimate
the system benefits of this shifting
Guidehouse compared regression impacts shown in Table 2 EV participants and non-EV
participants to estimate the increase in consumption specific to EV charging. The average
increase in consumption in each TOU period is calculated as the difference between impacts for
the ‘EV’ group (column 7) and ‘No EV’ group (column 5). Only statistically significant impacts
are considered (non-significant impacts assumed to be zero). 9 The total average daily increase
in consumption is then calculated as the product of the number of hours in a given period and
the average hourly impact attributable to EV charging.
This analysis estimated that the average EV participant had increased daily consumption by 6.3
kWh for the summer period, and 14.1 kWh in the winter period as a result of EV charging
behaviours. In cases where this consumption increase is a result of shifting from non-home to
home locations, the incremental benefits not captured in the Meta-Analysis are the system
benefits reduced coincident peak, On-Peak and Mid-Peak EV charging load (at non-home
locations).
To determine the profile of the EV charging assumed to have been shifted away from public
charging, Guidehouse applied the estimated EV-related increase in consumption to the average
vehicle charging profile of a group of EV drivers subject to the default standard RPP TOU price
plan. 10
For the purposes of this analysis, Guidehouse assumed that EV participants shifting
consumption away from public charging to private charging were using public charging only
between 6am and midnight (i.e., no public charging takes place during the Overnight Off-Peak
9 So, for example, the estimated average hourly impact due to EV charging during the summer On-Peak period is -
0.123 kWh minus -0.107 kWh (both EV and non-EV impacts are statistically significant) whereas the estimated
average hourly impact due to EV charging during the Overnight Off-Peak period is just 1.042 kWh since the
corresponding non-EV participant impact is not statistically significant.
10 The load profile for the control group were participants of Alectra’s ongoing @Home pilot program. These
participants have data loggers installed in their electric vehicles to track the location and magnitude of their charging
behaviour. For more details on @Home, please see the Alectra website:
https://www.alectra.com/sites/default/files/assets/pdf/Alectra_GREATCentre_AlectraDrive_Home_2020-01.pdf
©2022 Guidehouse Inc. All rights reserved. 16period). The hourly shape of this change in charging behaviour estimated using the process
described above is illustrated in Figure 6, below.
Figure 6. Variance in Load due to Locational Shifting
4.0
Delta in Consumption (kWh)
3.0
2.0
1.0
0.0
-1.0
-2.0
1 2 3 4 5 6 7 8 9 10 11 12 13 14 15 16 17 18 19 20 21 22 23 24
Hour Ending
Summer - Delta in Consumption Winter - Delta in Consumption
Guidehouse used the same IESO avoided energy cost values as for the Meta-Analysis, which
are in 2020 dollars, and an avoided capacity cost of $135/kw-year for valuing coincident peak
demand impacts. For the purposes of estimating the coincident peak demand impact, the
system peak was assumed to be in the summer, between 4pm and 5pm, as the IESO reported
this hour covered three out of the five system peaks in the period from May 1, 2020, to April 30,
2021. 11
The benefits were calculated as:
• Avoided Energy Costs – the delta in consumption for each hour multiplied by the
avoided energy cost for that time-of-use period and season. 12
• Avoided Capacity Costs – the delta in consumption for the peak hour multiplied the
stated capacity cost.
4.1.3 Results – Per Vehicle Benefits
The resulting estimated per-vehicle benefits of shifting load from non-home to home locations
are shown in Table 3.
11IESO. https://www.ieso.ca/en/Sector-Participants/Settlements/Global-Adjustment-and-Peak-Demand-Factor
12The avoided energy costs are only calculated for the periods which do not overlap with the overnight-off-peak
period definition, as these benefits were already captured in the Meta-Analysis report.
©2022 Guidehouse Inc. All rights reserved. 17Table 3. Per-vehicle Benefits of Locational Load Shifting
Summer Benefit Winter Benefit Annual Benefit
Avoided Energy Costs
$30 $60 $90
($2020)
Avoided Capacity Costs
$41 $0 $41
($2020)
4.2 Benefits of EV Adoption
4.2.1 Benefit Stream Definition
This section calculates the benefits assuming the increased load is attributed to drivers shifting
driving from an ICEV to an EV while subscribed to the treatment. 13 There are two primary
benefit streams associated with increased EV uptake:
• Societal Benefits – carbon costs associated with the reduction of emissions resulting
from driving an EV. The benefits to society of increased EV adoption are related to the
decrease in greenhouse gas emissions resulting from vehicle ownership. ICEVs emit
carbon while in operation. This carbon emission has an associated cost – removing
those emissions are a net benefit to society. However, EVs are only as clean as the
electricity they are powered by. EVs decrease fuel usage but increase electricity
consumption; each electric grid has emissions related to the generation of electricity.
• Individual Bill Benefits – customer savings associated with decreased fuel prices from
driving a zero-emission vehicle. The benefits to an individual of EV adoption on the
Overnight treatment is a reduction in operation cost of the vehicle via reduced fuel costs.
EVs generally have a lower operating cost than ICEVs due primarily to lower fuel costs;
a decreased electricity price further increases savings to the customer.
4.2.2 Calculation Methodology
Societal Benefits:
To estimate the societal benefits (not captured in the meta-analysis) of participants shifting
driving from an ICEV to an EV, Guidehouse:
• Calculated the average annual CO2 emissions of an ICEV based on annual kilometers
driven and the Environmental Protection Agency’s average emissions per kilometer
• Calculated the average annual CO2 emissions of an EV based on annual electricity
consumption and the emissions per kWh of electricity generated in the Ontario electrical
grid
13This shift could either be a result of purchasing a new electric vehicle, or a result of two-or-more vehicle
households shifting kilometers driven from one powertrain to another.
©2022 Guidehouse Inc. All rights reserved. 18• Calculated the CO2 savings by switching powertrains
• Multiplied the CO2 savings by the Federal cost of carbon ($50/tonne in 2022)
For this benefit stream, Guidehouse calculated the difference in carbon emissions between an
ICEV and an EV. For each powertrain, Guidehouse considered the annual mileage driven by
the average driver in Ontario. Guidehouse’s internal research arm, Guidehouse Insights, models
this value at approximately 16,200 kilometers. For ICE vehicles, the EPA models an average
emission of 404 grams of CO2 per mile driven (or 250 grams per kilometer). This equates to an
annual CO2 emission of approximately 4 million grams.
For EVs, to calculate the emissions associated with increased grid generation, the annual
electricity consumption of a vehicle must be determined. Guidehouse considered the average
electric fuel efficiency modeled by Guidehouse Insights of 5.3 kilometers per kWh, resulting in
an average consumption of 3,059 kWh. The Ontario grid has an emissions intensity factor of 31
grams of CO2/kWh. 14 This equates to an annual CO2 emission of approximately 95,000 grams.
Thus, the CO2 emissions reduction from switching an ICEV to an EV is 3.97 million grams, or
3.97 tonnes. In 2022, under the Federal government’s carbon pricing system, carbon emissions
are priced at $50/tonne. 15 The resulting societal benefit, per vehicle adopted, is $198.6.
Annual Benefit
Societal Benefits $199
In the Meta-Analysis, Guidehouse found the response to the Overnight price yielded a negative
system benefit. The avoided cost benefit of the peak demand and On-Peak and Mid-Peak
energy reductions were less than the incremental system costs of the additional overnight
consumption, with a net present value of a lifetime avoided cost benefit of -$14. The benefits
output above were not captured in the Meta-Analysis.
The societal benefits calculated above (nearly $200 per participant) only apply to a subset of the
entire Overnight pilot group (as ~47% of survey respondents indicated they owned/leased an
EV, and of that group, 43% purchased the vehicle while subscribed to the treatment). Thus, the
benefits obtained are applicable to roughly one-fifth of the treatment population. However, the
benefit captured above is an annual benefit, while the -$14 value in the Meta-Analysis is a net
present value of lifetime costs 16. For this reason, due to the magnitude and lifetime of this
benefit, were this to have been captured in the Meta-Analysis, the Overnight treatment would
yield a positive societal benefit.
14 “A Clearer View on Ontario’s Emissions”, Toronto Atmospheric Fund. 2019. https://taf.ca/wp-
content/uploads/2019/06/A-Clearer-View-on-Ontarios-Emissions-June-2019.pdf
15 Government of Canada, https://www.canada.ca/en/environment-climate-change/services/climate-
change/pricing-pollution-how-it-will-work/carbon-pollution-pricing-federal-benchmark-information.html
16 Lifetime defined as 14 years in the Meta-Analysis.
©2022 Guidehouse Inc. All rights reserved. 19Individual Bill Benefits:
To estimate the individual bill benefits (not captured in the Meta-Analysis) of participants shifting
driving from an ICEV to an EV, Guidehouse:
• Calculated the annual fuel cost of operating an ICEV based on average annual
kilometers driven, average fuel efficiency and gasoline prices in Ontario
• Calculated the annual fuel cost of operating an EV based on average annual kilometers
driven, average fuel efficiency and electricity prices on the Overnight price for an ICEV
based on average annual mileage, average gasoline prices in Ontario
• Calculated the difference in fuel costs across the powertrains
For this calculation, the same annual mileage is assumed (16,200 km). To calculate fuel
consumption for an ICEV, a fuel efficiency of 27.7 miles per gallon is assumed, per Guidehouse
Insights. At 16,200 kilometers driven per year (or 10,000 miles), this results in an annual fuel
consumption of 364 gallons, or 1,650 liters. The Government of Ontario reported an average
gasoline price of $1.57 per litre in 2021, resulting in a fuel cost of $2,600. For an EV, an annual
electricity consumption of 3,059 kWh was previously calculated.
Assuming the entirety of this electricity is consumed during the overnight off-peak period ($0.02
per kWh) results in a fuel cost of $61, for an annual bill savings of $2,539. If instead, the
average consumption profile of EV drivers on the Overnight pilot is used, an average electricity
price of $0.09 per kWh is realized, resulting in a fuel cost of $260, for an annual bill savings of
$2,340. 17
Annual Benefit
Individual Bill Benefits $2,340
17 Were a customer to adopt identical charging behaviour (e.g., same load shape) on the standard time-of-use rate
(as the rates were set during the Overnight pilot), the customer would realize an annual bill savings of $2,344. In
other words, customers could receive an additional savings of $194 per year by shifting their charging entirely to the
overnight off-peak period.
©2022 Guidehouse Inc. All rights reserved. 205. Findings and Conclusions
In its Meta-Analysis of RPP Pilots, Guidehouse hypothesized that the entirety of benefits
associated with the Overnight price plan were not captured. This report set out to estimate the
incremental benefits of the pilot, and to test the hypotheses of sources of additional
consumption. Through this analysis, Guidehouse can conclude:
1. The estimated net increase in consumption due to the Overnight price plan does
not appear to be the result of behavioural fuel-switching. Participants that did not
report owning or leasing an EV during the pilot period did not exhibit any statistically
significant increase in consumption during the Overnight Off-Peak period. EV
participants in contrast increased their average summer Overnight Off-Peak demand by
more than 1 kW and their average winter Overnight Off-Peak demand by nearly 2kW.
2. A very high proportion of EV participants acquired their vehicles during the pilot.
Of the 135 participants that responded to Guidehouse’s survey, 63 indicated that they
owned or leased an EV during the pilot period, and, of these, 27 (43% of EV
participants) indicated that they acquired the vehicle during the pilot.
3. The majority of the estimated increase in consumption as a result of the Overnight
price plan is likely attributable to participants using EVs more, and ICEVs less.
Only 5% of EV participants that responded to the survey indicated that they had shifted
their consumption from public to private charging. As noted above, all increases in
Overnight Off-Peak consumption are attributable to EV participants, and nearly half of
these identified that they had acquired their EV during the pilot.
4. Where the average increase in consumption may be attributable to a shift from
ICEV to EV use, the societal benefits are considerable. Using average vehicle
efficiencies to convert the incremental electricity consumption attributable to EVs (on a
per vehicle basis) to an estimated reduction in gasoline use, and applying the federal
carbon price as a proxy for the societal benefit of these reductions Guidehouse has
estimated an average annual societal benefit of approximately $200.
5. The individual customer bill savings of converting from ICEV to EV driving when
subject to the Overnight price plan may be more than $2,000 per year. One of the
most significant costs of operating a vehicle are fuel costs. As the Overnight price plan
greatly reduces the fuel cost for electric vehicles (which already have a lower per-mile
cost than internal combustion engine vehicles), the realized benefits are significant.
©2022 Guidehouse Inc. All rights reserved. 21You can also read