Understanding Online News Behaviors - MIT
←
→
Page content transcription
If your browser does not render page correctly, please read the page content below
Understanding Online News Behaviors
           Frank Bentley                             Katie Quehl                   Jordan Wirfs-Brock                   Melissa Bica
             Yahoo/Oath                              Yahoo/Oath                         Yahoo/Oath                      Yahoo/Oath
           Sunnyvale, CA                            Sunnyvale, CA                      Sunnyvale, CA                   Sunnyvale, CA
         fbentley@oath.com                      katiequehl@oath.com                 jordan.wirfs-brock@          melissa.bica@colorado.edu
                                                                                        colorado.edu
ABSTRACT                                                                          edited and typically produced daily. While sometimes these
The news landscape has been changing dramatically over                            sources represented the opinions or political views of the
the past few years. Whereas news once came from a small                           editor, they were generally seen as a trusted source of truth
set of highly edited sources, now people can find news from                       to understand what was happening in the community and
thousands of news sites online, through a variety of chan-                        the world. From the 1666 publication of the London Gazette
nels such as web search, social media, email newsletters, or                      to Publick Occurrences, America’s first newspaper in 1690,
direct browsing. We set out to understand how Americans                           through the local and regional newspapers that remained
read news online using web browser logs collected from 174                        strong through most of the 20th century, when it came to
diverse participants. We found that 20% of all news sessions                      reading written news, very little changed.
started with a web search, that 16% started from social me-                          However, over the past few decades the news landscape in
dia, that 61% of news sessions only involved a single news                        America has changed dramatically. The web and alternative
domain, and that 47% of our participants read news from                           news sources have added many choices to the ways that
both sides of the political spectrum. We conclude with key                        people can find and consume news. In addition, the collapse
implications for online news, social media, and search sites                      of local, daily newspapers [2] and the growing 24-hour cable
to encourage more balanced news browsing.                                         news cycle have provided additional changes.
                                                                                     There are now thousands of news sources available at any
CCS CONCEPTS                                                                      time online, representing a wide variety of political view-
• Human-centered computing → Empirical studies in HCI ;                           points and regional, national, or international focus. Now,
Social media; • Applied computing → Media arts;                                   users can find a single article in isolation, through a web
                                                                                  search, social media post, email newsletter, or other direct
KEYWORDS                                                                          links from the web or from a friend. Browsing through all
News; Web Search; Log Analysis; Polarization; Bias                                of the top stories of the day, as one would read a newspaper,
                                                                                  is becoming less common as news arrives in different ways
ACM Reference Format:                                                             through direct article links [21].
Frank Bentley, Katie Quehl, Jordan Wirfs-Brock, and Melissa Bica.                    These changing practices highlight a number of questions
2019. Understanding Online News Behaviors. In CHI Conference
                                                                                  around how news is consumed in 2018. Although we have
on Human Factors in Computing Systems Proceedings (CHI 2019),
                                                                                  conducted hundreds of qualitative interviews about news be-
May 4–9, 2019, Glasgow, Scotland UK. ACM, New York, NY, USA,
11 pages. https://doi.org/10.1145/3290605.3300820                                 havior over the years, we wanted to more deeply understand
                                                                                  actual behaviors in news consumption over remembered
1    INTRODUCTION                                                                 interactions. We wanted to quantify the role of different re-
                                                                                  ferring sites (e.g. social networks, search, email) in prompting
Traditionally, if one wanted to read news they could turn to
                                                                                  news consumption as well as explore temporal and session-
their local newspaper of record. These papers were highly
                                                                                  based statistics about news consumption on the web — topics
Permission to make digital or hard copies of all or part of this work for         that are not well covered in the existing news literature.
personal or classroom use is granted without fee provided that copies are not        Specifically, we had the following research questions:
made or distributed for profit or commercial advantage and that copies bear
this notice and the full citation on the first page. Copyrights for components      (1) How do people get to news articles on the web? What
of this work owned by others than ACM must be honored. Abstracting with                 percent are reached through search vs. social media?
credit is permitted. To copy otherwise, or republish, to post on servers or to      (2) What temporal patterns exist in browsing news on
redistribute to lists, requires prior specific permission and/or a fee. Request         the web? Are there particular types of news that are
permissions from permissions@acm.org.
                                                                                        consumed most often in the morning? On weekends?
CHI 2019, May 4–9, 2019, Glasgow, Scotland UK
                                                                                    (3) How many different news domains do people visit? Do
© 2019 Association for Computing Machinery.
ACM ISBN 978-1-4503-5970-2/19/05. . . $15.00                                            people focus their attention on one end of the political
https://doi.org/10.1145/3290605.3300820                                                 spectrum? Or do they seek broad viewpoints?
To answer these questions, we collected complete web            find this number surprisingly low, but do not have the au-
browsing logs from the computers of 174 diverse Americans,         thors’ definition of a news site to know if it included celebrity,
covering an average of 138 days of browsing. We then ana-          sports, or local news.
lyzed these logs to identify web sessions that included news,         Other researchers specifically explored news browsing in
the referring source that led to news articles, the topics of      more detail. Tewksbury [23] analyzed web browsing logs
articles that were read, and the political biases of the sources   from 13 specific news sites using data from 2000. They an-
that participants turned to. This data has helped us to more       alyzed the specific topics of news that users viewed (e.g.
deeply understand news browsing behaviors in 2018.                 sports, politics, weather, etc.) finding that 54% of users only
   Our contribution lies in quantifying how participants get       browsed news in a single topic over the two months of data
to news and the prevalence of different sources. We also           that they collected.
show the diversity of bias in the sources that people turn            Purcell et al. [21] conducted a survey of news behaviors,
to and temporal patterns throughout the day in the topics          finding that American news habits are based on “foraging
that people are reading. This data is important for the design     and opportunism” and that Americans report visiting be-
of future news platforms, social networks, search engines,         tween two and five online news sources. Kleppe and Otte
and email newsletters, as well as for the American political       [16] studied the news browsing behaviors of young Dutch
process itself.                                                    participants and found the majority of news browsing session
                                                                   started on news home pages. Flaxman et al. [11] explored the
2   RELATED WORK                                                   news behaviors of participants who more heavily engaged
Researchers have been studying how people receive news             in news, finding that the majority of their browsing started
information for quite some time. Modern research into this         on a news home page and that only 6% of sessions started
topic in the 1980s and 90s focused on the role of TV broadcast     from social media sites. We expected things to have changed
news versus newspapers in how people receive news. Chaf-           dramatically since their 2013 data, with the rise of social
fee and Frank [5] explored the differing roles that TV news        media potentially driving users to a broader set of sites.
and newspapers played in bringing information to different
audiences, with newspapers being read by people more ac-           Social Media and the Filter Bubble
tively seeking news and television reaching groups that were       More recent changes in online news occurred through the
more lacking in political information.                             development of social media platforms as a place to share and
   Prior [20] pointed to the effects of many of these changes      discuss news. This opened up many new ways for people to
in the news media landscape. Cable news contributes to             discover a news article online. Instead of needing to actively
polarization in political opinions, and viewing habits vary        choose to go to a news website or explicitly search for a news
greatly, with some households watching many hours a day            topic, now news began to passively arrive on social media in
but most households not watching at all. He also showed that       posts shared from friends and family or from news sources
access to the Internet had “widened gaps in news exposure          that a user follows.
[and] political knowledge” with some engaging much more               In 2013, Weeks and Holbert [25] studied social media news
than others with online news.                                      users, finding them to be largely young, technologically lit-
   Tewksbury [24] found two different types of news con-           erate, and infrequent consumers of newspapers or television
sumers, one group that actively attended to a small number         news. They also found that political partisans share news on
of topics, and a larger group that browsed a wider variety of      social media more often than moderates, potentially leading
topics. Looking deeper at the people who do not engage with        to a more biased news experience for those who follow them.
the news, Eliasoph [9] wrote the stigma Americans have                Lottridge and Bentley [18] studied the wider variety of
around talking about politics at work or in public has led to      ways that people could share news with each other – in-
diminished awareness of political issues and general apathy        cluding privately in text messaging, semi-publicly on social
towards much of the news and politics in the country.              media, or publicly on sites such as Twitter or Reddit. They
                                                                   found differences in the types of news shared on each plat-
Online News Consumption                                            form, with the most polarizing political content shared more
The Internet brought new ways for people to get their news,        publicly. This has clear implications for the types of news
changing the paradigm of broadcast and print to include            people receive if they are tuned into these social sources.
on-demand access to individual articles. Goel et al. [15] con-        Social media platforms have led to what has been termed
ducted a study in 2012 analyzing how people browse the             the “filter bubble,” [19] where users are said to receive news
web online. Interestingly, in this study, they found that the      of a particular political bias due the the accounts that they
average user only browsed five news pages per month. We            follow and the friends that they have on social media.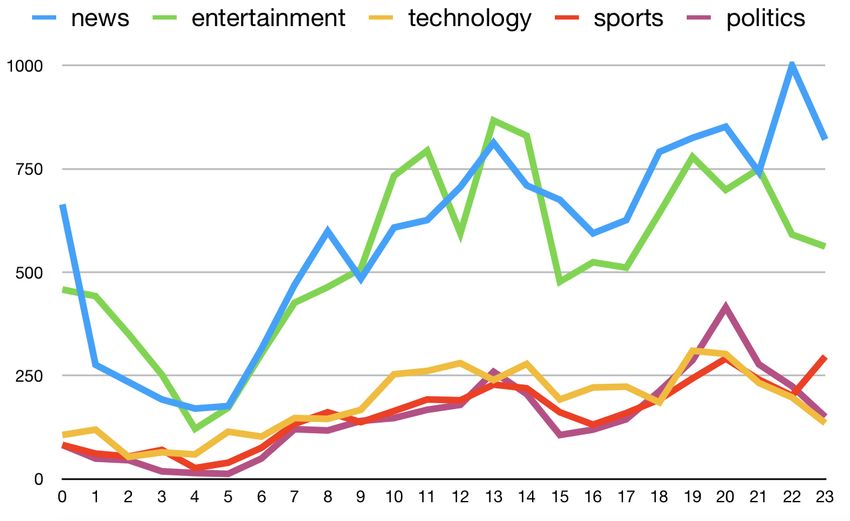
Multiple studies have explored partisanship online and the     wage and is in line with existing research that shows brows-
political leanings of certain news publications. Pew Research     ing history being valued at about the price of a Big Mac [4].
has tracked political polarization of both news sources and       These participants are representative of the general US adult
the general population over time with reports in 2014 [7]         population in terms of age (18-72), gender (49% female), and
and 2017 [8]. The 2017 study shows a large-scale shift in the     household income (median $50k), and reside in 39 distinct
political leanings of Americans to the left over time.            US states. Previous studies have shown that MTurk samples
   Various sites such as All Sides1 and Media Bias/Fact Check2    can be quite accurate when studying technology use in the
maintain ratings of news sources and their biases. A recent       broader American population [3].
study from the Harvard Berkman Center [10] also explored             We then created a list of 1,160 unique news domains. We
the political biases of a number of sources based on how they     began with the list of most trafficked news sites from the
were shared online. Researchers such as Resnick et al. [22]       comScore Media Metrix [6] and added the local news sites
have explored strategies for one to expand their filter bubble    of major television affiliates (ABC, NBC, CBS, Fox) and local
to be exposed to articles from more diverse viewpoints.           newspapers that are a part of the ten largest media conglom-
   In addition is the rise of so-called “fake news” — stories     erates. The analysis below will count any page view from
that are published but not true. Flintham et al. [12] explored    one of these domains as a “news page.” Any page in this set
people’s ability to identify “fake news” online and found that    with a URL longer than 50 characters was labeled as an “ar-
one third of their respondents had been fooled by fake news       ticle page.” We manually checked several hundred URLs and
in the past.                                                      found no misclassifications on articles given this approach.
   This related work raised more questions for us than it an-        To understand the topics of articles, we ran each article
swered. Platforms such as Facebook or Twitter have changed        through the Yahoo Content Analysis Service. 3 This system
the way that news is presented and sorted in the feed over        returned Yahoo Content Taxonomy (YCT) and Wikipedia
the years, which could also have a large impact on how peo-       tags for each article. YCT is a hierarchical classification sys-
ple get to news from social media sites. We wanted to take a      tem for news content, with top level tags such as “news,”
fresh look at how people browse news on their computers,          “entertainment,” and “sports,” and lower-level categories such
how they get to news articles (e.g. via search, social media,     as “politics,” “movies,” and “football.”
or browsing), and how users engage with multiple news sites          To understand the political bias of news sources that par-
within a news session. This would enable us to develop a          ticipants visited, we utilized the classification from Media
broad understanding of current news practices on the web          Bias/Fact Check. 4 This was the largest database of sources
in America, as well as how news sites and search engines          that we could find, with 1,434 sources listed in five cate-
can adapt to these current practices.                             gories from Left Bias (-2), Left-Center Bias (-1), Least Biased
                                                                  (0), Right-Center Bias (1) and Right Bias (2). All domains that
3 METHODS                                                         users visited were tagged according to this taxonomy.
In order to broadly understand how people are consuming              While other lists of bias exist from sources such as Pew [1],
news on the web, we collected a set of complete web browser       these lists contain far fewer sources. In general, these lists
histories from the computers of a diverse set of Americans.       highly agree on their ratings, with sources such as HuffPost
Participants were recruited on Amazon Mechanical Turk.            and Mother Jones on the far left, National Public Radio (NPR)
After agreeing to participate, users were directed to an online   and the New York Times to the center-left, Reuters and the
survey which provided a detailed explanation of the data we       Associated Press (AP) as unbiased, the New York Post and
were collecting and why, followed by instructions for how         Forbes as center-right, and Breitbart and Fox News on the
to find one’s own browser history file (for either Chrome or      far right.
Firefox) stored locally on their computer. The files contained       We compared the Media Bias/Fact Check list with a list of
a timestamped entry for each webpage viewed for either the        115 sources from a recent paper from the Berkman Center
last 3 months (Chrome) or since the user first started using      at Harvard [10] and found a 0.77 Pearson correlation with
the browser (Firefox), in addition to the URL and page title.     p < 2.2∗10−16 when comparing bias ratings for all 87 sources
   We paid participants $5 for their browser history files, and   that the lists had in common. We also correlated the list
received valid data from 174 participants, totaling nearly 10     from Media Bias/Fact Check with 105 sources listed in the
million unique page views over an average of 138 days of his-     Media Bias Chart from Ad Fontes Media5 . We found a 0.92
tory per participant. This amounted to an average $60/hour        Pearson correlation with p < 2.2 ∗ 10−16 for the 85 sources

                                                                  3 https://developer.yahoo.com/search/content/V2/contentAnalysis.html
1 https://www.allsides.com/media-bias/media-bias-ratings          4 https://mediabiasfactcheck.com/
2 https://mediabiasfactcheck.com/                                 5 https://www.adfontesmedia.com
these lists shared. Finally, we compared the larger list with
a set of 200 matching sources from the AllSides Media Bias Figure 1: Total number of articles viewed (left) and unique
Ratings.6 Here, we found a Pearson correlation of 0.81 with news domains visited (right) per participant.
p < 2.2 ∗ 10−16 . These correlations are strong enough for us
to trust the larger partisanship classification of 1,434 sources
for our analysis. It is important to have such a large set of
sources in order to accurately determine the broader media
consumption diets of our participants — as described below
our participants visited hundreds of these sources.
We analyzed the web history data in terms of web “ses-
sions.” We used a one-hour-idle session delimiter to break
web browsing activity into distinct sessions of interaction.
This is standard practice, following guidance in Lalmas et al.
[17] and is widely used throughout the Internet industry to
segment online behavior.
All research was approved by our institutional processes
for conducting work with human subjects and log data. Par-
ticipants were clearly informed about our institutional iden-
tity, the exact data that was being collected, and our data
retention policies.
4 FINDINGS
Figure 2: Histogram of mean media bias scores for the arti-
Our dataset contained 9,487,564 total page views from our cles that each user read.
174 participants. Using one hour idle session delimiters, there
were 43,415 total web browsing sessions in this dataset. In
this section, we will explore general news reading behaviors,
how users arrived at news articles, temporal patterns, and
behaviors within sessions.
To check the representative nature of our dataset, we com-
pared visitation rates with audience data from the ComScore
Media Metrix [6] from June 2018 (the month of our study) in
the “News/Information” category. This report includes the
number of visitors for the each of the top news sites in the
United States. We performed a Pearson correlation between
the audience numbers for the top 100 sites and the number
of users in our sample who visited each site. The correlation
was quite strong, at 0.87 (pFigure 3: The percentage of news that a user receives from Figure 4: Mean (circle) and standard deviation (lines) of me-
their top ten sources. The median user receives 47% of their dia bias scores for the articles that each user read. Users are
online news from just a single source. arranged by increasing mean score.
they view a variety of sources? Figure 4 shows the mean
that mean media bias scores for articles that each user read, media bias scores of each participant in our study based on
showing a range of left and right leaning sources, with a ma- all articles read. Error bars indicate the standard deviation.
jority falling moderately left of center. We find it interesting The majority of participants read articles from sources that
that every participant visited at least one news site, with 75% leaned to the left – 87% of participants had a mean media
of participants viewing more than eight distinct sites and bias score less than zero. When taking into account stan-
25% of participants viewing more than 34. One participant dard deviation, only 48% received the vast majority of their
visited 120 distinct news sites in their dataset. This is much news from left-leaning sources. Only 5% of participants had a
higher than the two to five sites reported in previous survey- (mean − standarddeviation) score above zero, with the vast
based studies [21] and illustrates why behavioral studies are majority of their news coming from right-leaning sources.
necessary to gain an accurate ground truth in topics where The relatively high average standard deviation (0.66) shows
users might not consider or remember each interaction. In that most participants took in news from at least some dif-
addition, as mentioned in the Introduction, there are more fering perspectives. In fact, 47% of participants had standard
news sites available online today than in the past. deviation lines that crossed the center line. Perhaps the po-
Exploring the domains further, we found that the median larization is not as strong as some would indicate, although
participant read 47% of their news articles from a single we do see the general left-leaning bias in the articles read,
source. Figure 3 shows the distribution of news read from which matches similar data from Pew about the American
a user’s top ten news sources. By the second source, the population as a whole [8] and matches behaviors seen in
median user has read 66% of all of the news articles that they the broader population through the ComScore Media Metrix
consume. This increases to 87% by the fifth source and 96% data [6] where only one of the top ten online news sources
by the tenth source. was right-leaning (foxnews.com) as of June, 2018. Our data
Next, we explored the variation of sources visited per also aligns with the political views of the general popula-
participant. Were users in their own “filter bubbles” or did tion: 38% of our participants viewed at least one article onThe remaining two-thirds of the time, users reached a
Figure 5: The origin of the first article view in a news session. story by a link from another site or shared to them by a
Browsing for news stories represents only 34% of the ways friend. Web search represented the largest portion of these
participants landed on an article. direct links, with 20% of news sessions starting from the
result of an online search. Links from Social Media sites (e.g.
Facebook, Twitter, LinkedIn) led to 16% of news sessions,
showing the growing importance of these sites in shaping
one’s media diet compared to the 6% observed in 2013 [11].
Other online sites such as Reddit (5%), YouTube (2%) and
Wikipedia (0.4%) also led users to the news, in addition to
email (including Gmail, Yahoo Mail, and Outlook/Hotmail
domains) at 5%. We find the high volume of news preceded
by a search at 20% to be quite high, a point we will return to
in the discussion.
We observed some variation in how users arrived at news
stories of different types. Table 1 shows the breakdown of
different referral mechanisms for different types of news
content. Finance, Sports, and Travel news had the highest
percentage of searches leading to an article. Health and Poli-
tics led social referrals and were also at the top for email re-
ferrals. Technology, Politics, and Sports led in articles found
via browsing a news site. Entertainment, Health, and Finance
were the least likely to be found via browsing on a news site.
We will now turn to media bias scores by referring source.
foxnews.com, compared to Donald Trump’s 41% approval The mean absolute value of the bias score from all articles
rating at the time of the study [14] and 11 percentage points read was 1.02. The most biased articles came from social
larger than the size of the Republican base (27% in June 2018) media (1.07) and email (1.04), with the least biased articles
[13]. coming from search results (0.92) and Reddit (0.93). We find
the lower bias scores from search results to be interesting,
How People Get to News Articles and will return to implications for search in the Discussion.
News sessions can start in many ways. Historically, news We also find the higher bias in email and social media to
was something that one browsed for or received passively. be interesting, likely because users receive email update
One could read through a newspaper and stop on articles that newsletters from more biased sources (e.g. the daily “Huff-
were interesting or listen to the evening news on the radio Post Morning Email”) As has been shown by Weeks et al.
or TV absorbing the stories that were shared, but with no [25], partisan users share more frequently on social media.
control over what was broadcast. The Internet brought many
new ways to discover news content. Now, people can browse Temporal Patterns of News Reading
the news on a news website or portal, similar to browsing a Next, we were interested in the temporal patterns of news
newspaper. But they can also get to articles through social reading on the web. Do people not want to wake up to serious
media posts, web searching, email links, and other online news? Or do they catch up on celebrity news in the evening?
sources such as Reddit, YouTube, or Wikipedia. We used our behavioral data from the logs to confirm or deny
We were interested in examining the ways that users these and other statements about news reading. All analysis
started a news session. We took the first news article pageview was conducted in the local time zone of the user, and we
in each news session and found the referring page in the segmented all news articles by hour of day and day of week.
browser logs. Figure 5 shows the different ways that our Figure 6 shows the number of news sessions observed by
participants arrived at on the first news article of a session. hour of day across all of our participants. Interestingly, the
Although it’s the most frequent single way to get to an arti- highest news consumption occurs in the evening, with the
cle, only 34% of articles were reached through browsing on a three highest points being from 6–8pm. There is another
news site or portal (such as going to http://www.nytimes.com small peak around noon and one at 7am. Overall, news con-
and clicking on a story). Given that this was the original way sumption stays quite high from 6am through 9pm. This is in
that news was read, this relatively small percentage repre- interesting contrast to historical patterns of news consump-
sents a massive change to the way that news is consumed. tion, where one would wake up to the morning paper andCategory Search Social Reddit Email YouTube Wikipedia Other Link Browsing
News 23.7% 15.5% 1.4% 6.4% 0.9% 0.7% 33.9% 17.4%
Entertainment 25.1% 15.7% 1.5% 5.0% 0.8% 0.7% 37.2% 13.9%
Technology 17.3% 8.5% 2.5% 0.7% 1.1% 0.5% 41.8% 27.7%
Sports 27.0% 14.3% 1.8% 4.6% 0.4% 0.2% 29.8% 22.0%
Politics 23.1% 16.9% 0.9% 6.9% 0.7% 0.4% 27.1% 24.1%
Travel 28.3% 11.8% 1.2% 5.6% 1.6% 0.3% 33.0% 18.1%
Finance 38.8% 13.3% 0.8% 6.1% 0.0% 0.0% 26.3% 14.6%
Health 27.4% 18.6% 5.2% 5.7% 1.0% 0.2% 27.6% 14.3%
Table 1: How participants arrived at news articles of various types at the start of sessions containing news.
Figure 6: Total news sessions by hour of day. Figure 8: Topics of news articles views by hour of day.
We were also interested in news consumption by day of
week. Were there particular days with more news consump-
Figure 7: Total news sessions by day of week. tion than others? Figure 7 shows that news consumption is
fairly flat, with a slight decreasing trend as the week goes
on from Monday to Saturday, but only a difference of 15%
between the highest (Monday) and lowest (Saturday) days.
Although the total number of news sessions remains fairly
stable, it is interesting to note that weekends showed 50%
fewer total web page views than the highest weekdays (Tues-
day and Wednesday), making news a much higher percent
of total web browsing on weekends.
We were further interested in the topics of articles that
were read throughout the day and by day of week. As dis-
cussed in the Methods section, we obtained YCT categories
for each article. We then looked at topics by time of day and
day of week to see if there were specific temporal dynamics
to reading news on particular topics. Figure 8 shows the
top five news topics (hard news, entertainment, technology,
sports, and politics) by the hour of day that the article was
read. At the 8am hour, harder news is the most common
unless they also purchased an evening paper, took care of type of news read. However, entertainment news surpasses
most of their written news consumption in the morning. hard news for the 10am, 11am, 1pm, and 2pm hours, likelyFigure 9: Number of news articles viewed in a session. 20% Figure 10: Number of distinct news domains browsed within
of all news sessions contain just one article that was read. a news session.
for a momentary break and distraction during the workday.
Entertainment news peaks at 1pm. Hard news then regains
the lead from 3pm through midnight with it’s daily peak at
10pm. average news session of 9.5 pages viewed, given a much
Sports news reading peaks at 8pm and 11pm, just as the smaller number of articles read when directly browsing news
evening games are kicking off and ending (the study was sites. This can seem counter-intuitive, but often users arrive
conducted during baseball season in America). Political news on news portals just to browse the headlines or on their way
also peaks at 8pm, surpassing technology and sports read- to read their email without clicking on any articles.
ing for the 8pm and 9pm hours whereas technology news The largest number of sessions with news (61%) involved
surpasses both sports and politics for much of the workday. just a single domain, as shown in Figure 10. Yahoo News,
These patterns illustrate the overall popularity of news The New York Times, CNN, MSN, and BuzzFeed were the
and entertainment news, which track each other for much of most popular sources viewed in sessions with no other news
the day. It also shows that entertainment news is not more domains. Sessions with two domains comprised 22% of news
popular during the morning waking-up hours. sessions, with the most common pairing being CNN and Ya-
hoo, occurring 179 times. Both of these sources score as fairly
Within-Session Behavior unbiased in the center-left category (-1). The New York Times
We now turn to look within sessions to understand how par- and Politico were the next most common pairing, occurring
ticipants consumed multiple news stories within a session. 102 times in the dataset. These are also both categorized
Particularly, we explored if participants were viewing mul- as center-left. Eight percent of sessions contained three do-
tiple articles on the same topics as well as the diversity of mains, 4% contained four, and 5% of sessions contained five
sources within the session. or more news domains.
Figure 9 shows the number of news articles viewed in each As the number of domains visited increases, the trend of
news session. Overall, 20% of news sessions involved only browsing sites with a similar bias score continues. Overall,
a single article, with an additional 13% containing just two the news sites that are browsed together within a session
articles. 43% of all news sessions had over five articles viewed. have an average variance of 0.29 points of bias. Only 7.7% of
Interestingly, the source of the news session had a significant sessions include sites with a bias score variance greater than
impact on the number of news articles viewed in that session. one. Participants were not frequently going out of their way
Sessions started from email links to the news resulted in the to find diverse accounts of a story.
most news browsed (at an average of 14 pages). Search and Of sessions that contained articles where we could ex-
Reddit both led to an average of 12 news pages being viewed, tract Wikipedia entities for people or places mentioned in
while social links to news led to an average of 11 news pages the article, 36% contained more than one domain browsed.
viewed within that session. All of these are larger than the Of these sessions, 70% contained multiple articles with thesame Wikipedia entity. The most common Wikipedia en-
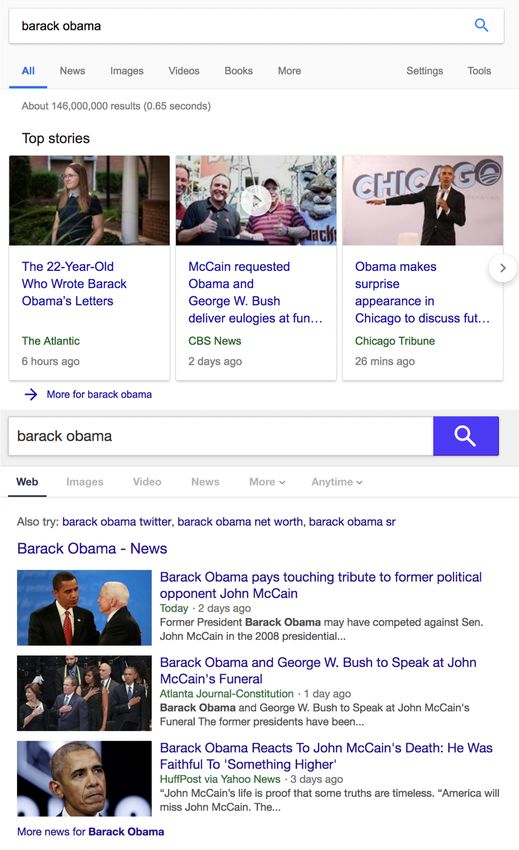
tities where users viewed articles from multiple domains Figure 11: The current search experience on Google (top) and
within the same session included: Donald Trump, White Yahoo (bottom), highlighting news results in boxes on top of
House, Melania Trump, Kim Kardashian, Catherine Zeta- algorithmic search results.
Jones, Anthony Bourdain, and Star Trek. This represents a
mix of political and celebrity/entertainment news similar to
the overall trends across all articles viewed.
In summary, we have seen that 61% of all news sessions
only involve a single domain and 20% only involve a single
article. When users do branch out, they most often seek sites
with similar political bias, however 7.7% of the time they
look for a news source with a different viewpoint. 70% of the
time that users visit multiple news domains in a session, they
read a story on the same topic on multiple sites, representing
25% of all news sessions. This analysis has allowed us to
more deeply understand news browsing behaviors and how
people get to and explore news on a variety of topics.
5 LIMITATIONS
While this study enabled us to get a deep, behavioral look
into current news consumption in the United States, there
are some limitations. We are reliant on the Mechanical Turk
userbase for our data, which may be more likely to use desk-
top computers to take their HITs. However, previous research
has shown large agreement between the behaviors of this
panel and the broader US population [3]. Our sample only
contains data from 174 participants. While we have a high
degree of diversity in the panel that matches the US popula-
tion (ages 18-72, 49% female, $50k median household income,
and 39 distinct US states), this may not be enough to capture
the very diverse user behaviors across over one thousand
news sites. Larger samples should be studied by companies
who have access to this much larger browser history data.
We were unable to capture mobile browsing behavior for
several reasons. Most mobile applications (e.g. Facebook,
Twitter) use their own embedded browsers, so news page
views in these applications are not captured in mobile brows-
ing logs. As it is also not possible to get browsing log data
from within dedicated news apps (e.g. The NYT app), we
focused on the desktop web for our analysis, where we could
get complete logs of user behavior over months of interac- able to more deeply understand news reading behaviors in a
tions. way that avoids the bias of self-reporting. We have explored
Finally, this dataset was collected in late June 2018. With how users get to news articles via search, social media, email,
an average of 138 days of data per participant, this means and other sources as well as how they interact within news
that almost all data was from the Spring. There are likely sessions in terms of the political bias of the news sites visited
seasonal differences in use (e.g. sports during the NFL season) and topics viewed by time of day.
and conducting studies with larger log sets or at other times Through this analysis, several larger themes have emerged,
of the year can be useful future work. with key implications for the design of news platforms, as
well as for the understanding of news consumption in gen-
6 DISCUSSION eral. These include the importance of search, ways to address
By analyzing the behavioral data of a broad range of Ameri- temporal browsing preferences, and a reflection on news po-
cans and how they browse news on the web, we have been larization and filter bubbles.Search and News Almost half (48%) of participants received the vast majority
One of the most interesting findings to us was discovering (mean + standard deviation) of their news from left-biased
that 20% of all news sessions begin with a web search, as we sources while 5% received the vast majority of their news
did not anticipate so much traffic driven this way. We also from right-biased sources. While the US-population overall is
observed that news sessions that start from search have the leaning farther left [8], the fact that people are not exposed to
most neutral partisan bias of all types of news sessions. ideas from different viewpoints can lead to a deeper “bubble”
Currently, when searching for news topics or celebrities where people are not aware of the ideas of other portions of
on Google or Yahoo, a direct display box is shown with top the population.
news stories, as shown in Figure 11. Based on the findings One way to help with this problem is to improve search
of our analysis, we know that users seek multiple stories on (as described above) to focus on showing a wider variety of
the same topic in 25% of news sessions. Search engines can results. But search only makes up 20% of all news sessions.
make this experience easier by aggregating news stories on News portals, such as yahoo.com, msn.com, or news.google.
particular topics (e.g. in the Obama example above, showing com can use many of the same techniques suggested for
stories about Senator John McCain together and stories about search engines to show a broader diversity of viewpoints for
his trip to Chicago together) so that users can easily find aggregated articles on specific topics. News sites that give
different viewpoints on the same topic. rewards points for viewing articles can give additional points
In addition, search engines can indicate the political bias for reading stories on different sides of the political spectrum,
of sources and explicitly include results that lean left, right, or can give bonuses for reading stories from mostly unbiased
and center so that readers can understand a breadth of opin- sources to disincentivize reading heavily-biased sources.
ions on a topic. Boxes might also summarize the different We do find it heartening that 7.7% of all news sessions
viewpoints based on articles of differing biases to get a quick contained multiple news domains with different political
view of the diversity of angles on a topic. For McCain, a bias scores. In addition, 47% of participants had a distribution
long-serving moderate Republican senator and former POW of news sources that crossed the center. Users are seeking
in Vietnam who recently died, this might include centrist to break out of their bubbles at least a little bit, and this
articles praising his service and bipartisanism, left-leaning behavior can be encouraged through new features of major
articles on his support of healthcare and refusal to support news portals.
torture, and right-leaning articles on times he has strayed
7 CONCLUSION
from the republican mainstream or defending the White
House in not keeping the flag lowered after his death. This This exploration of behavioral data of news browsing, from
can help users to quickly understand complex topics. 174 diverse Americans over an average of 138 days, has
highlighted several important trends in news consumption
Temporal News Browsing in 2018. Most notably, users are frequently reading news on
the web, with 23% of all web browsing sessions containing
Also interesting to us were the temporal patterns that we ob-
news. Users are reading from a wide variety of sources with
served, highlighting a peak in news browsing in the evening
the median user visiting 19 distinct sources. The majority
and harder news being more frequent than celebrity in the
of users, 52%, did not receive significant amounts of news
morning. The peaks mid-day are most often for celebrity and
from opposing right or left leaning sources; they were in a
entertainment news.
filter bubble. We have also seen that how people are getting
News sites can explicitly design for these temporal pat-
to news is changing and diverse — 20% of all news sessions
terns. They can choose the types of news that are editorially
came from search, 16% from social media, only 34% from
selected to be at the top of the page to match the news that
direct browsing.
people are seeking at different times. Early morning might
These findings have implications for the design of search
be a summary of what happened in harder news overnight.
and news portals and helping users to get a more balanced
Mid-day might include top celebrity or entertainment stories,
view of the world. We hope future work seeks to replicate
with more breaking news at the lunch hour. The evening can
these findings in other cultural contexts and in other times
highlight more sports and other general news. This can help
of the year. Logs, such as these, can also be used to examine
people find the content that they are most open to reading
how people explore the news around specific types of events,
at a given time.
such as the death of a celebrity or a major political story. The
news ecosystem is complex and changing rapidly, and more
Filter Bubbles work that explores actual human behaviors as opposed to
We have observed a large amount of polarization, or a “filter idealized answers in surveys or interviews is deeply needed
bubble” effect in the news habits of our 174 participants. at this time.REFERENCES https://doi.org/10.1145/3173574.3173950
[1] Rachel Weisel Amy Mitchell. 2014. Political Polarization [13] Gallup. 2018. Party Affiliation. (2018). https://news.gallup.com/poll/
and Media Habits: From Fox News to Facebook, How Lib- 15370/party-affiliation.aspx
erals and Conservatives Keep Up with Politics. (2014). [14] Gallup. 2018. Presidential Approval Ratings - Donald
http://assets.pewresearch.org/wp-content/uploads/sites/13/2014/10/ Trump. (2018). https://news.gallup.com/poll/203198/
Political-Polarization-and-Media-Habits-FINAL-REPORT-7-27-15. presidential-approval-ratings-donald-trump.aspx
pdf [15] Sharad Goel, Jake M Hofman, and M Irmak Sirer. 2012. Who Does
[2] Michael Barthel. 2017. Despite subscription surges for largest What on the Web: A Large-Scale Study of Browsing Behavior.. In
U.S. newspapers, circulation and revenue fall for industry over- ICWSM.
all. (2017). http://www.pewresearch.org/fact-tank/2017/06/01/ [16] Martijn Kleppe and Marco Otte. 2017. Analysing and understanding
circulation-and-revenue-fall-for-newspaper-industry/ news consumption patterns by tracking online user behaviour with a
[3] Frank R. Bentley, Nediyana Daskalova, and Brooke White. 2017. Com- multimodal research design. Digital Scholarship in the Humanities 32,
paring the Reliability of Amazon Mechanical Turk and Survey Mon- suppl_2 (2017), ii158–ii170.
[17] Mounia Lalmas, Heather O’Brien, and Elad Yom-Tov. 2014. Measuring
key to Traditional Market Research Surveys. In Proceedings of the
User Engagement. Morgan & Claypool Publishers. Synthesis Lectures
2017 CHI Conference Extended Abstracts on Human Factors in Com-
on Information Concepts, Retrieval, and Services.
puting Systems (CHI EA ’17). ACM, New York, NY, USA, 1092–1099.
[18] Danielle Lottridge and Frank R. Bentley. 2018. Let’s Hate Together:
https://doi.org/10.1145/3027063.3053335
How People Share News in Messaging, Social, and Public Networks. In
[4] Juan Pablo Carrascal, Christopher Riederer, Vijay Erramilli, Mauro
Proceedings of the 2018 CHI Conference on Human Factors in Computing
Cherubini, and Rodrigo de Oliveira. 2013. Your Browsing Behavior for
Systems (CHI ’18). ACM, New York, NY, USA, Article 60, 13 pages.
a Big Mac: Economics of Personal Information Online. In Proceedings
https://doi.org/10.1145/3173574.3173634
of the 22Nd International Conference on World Wide Web (WWW ’13).
[19] Eli Pariser. 2011. The filter bubble: How the new personalized web is
ACM, New York, NY, USA, 189–200. https://doi.org/10.1145/2488388.
changing what we read and how we think. Penguin.
2488406
[20] Markus Prior. 2007. Post-broadcast democracy: How media choice in-
[5] Steven Chaffee and Stacey Frank. 1996. How Americans get political
creases inequality in political involvement and polarizes elections. Cam-
information: Print versus broadcast news. The Annals of the American
bridge University Press.
Academy of Political and Social Science 546, 1 (1996), 48–58.
[21] Kristen Purcell, Lee Rainie, Amy Mitchell, Tom Rosenstiel, and Kenny
[6] ComScore. 2018. ComScore Media Metrix report for News/Information.
Olmstead. 2010. Understanding the participatory news consumer. Pew
(6 2018). https://mymetrix.comscore.com
Internet and American Life Project 1 (2010), 19–21.
[7] Michael Dimock. 2014. Political Polarization in the Ameri-
[22] Paul Resnick, R. Kelly Garrett, Travis Kriplean, Sean A. Munson, and
can Public. (2014). http://www.people-press.org/2014/06/12/
Natalie Jomini Stroud. 2013. Bursting Your (Filter) Bubble: Strategies
political-polarization-in-the-american-public/
for Promoting Diverse Exposure. In Proceedings of the 2013 Conference
[8] Carol Dougherty. 2017. Political Polarization, 1994-
on Computer Supported Cooperative Work Companion (CSCW ’13). ACM,
2017. (2017). http://www.people-press.org/interactives/
New York, NY, USA, 95–100. https://doi.org/10.1145/2441955.2441981
political-polarization-1994-2017/
[23] David Tewksbury. 2003. What do Americans really want to know?
[9] Nina Eliasoph. 1998. Avoiding politics: How Americans produce apathy
Tracking the behavior of news readers on the Internet. Journal of
in everyday life. Cambridge University Press.
communication 53, 4 (2003), 694–710.
[10] Robert Faris, Hal Roberts, Bruce Etling, Nikki Bourassa, Ethan Zucker-
[24] David Tewksbury, Michelle L Hals, and Allyson Bibart. 2008. The
man, and Yochai Benkler. 2017. Partisanship, propaganda, and disin-
efficacy of news browsing: The relationship of news consumption
formation: Online media and the 2016 US presidential election. (2017).
style to social and political efficacy. Journalism & Mass Communication
[11] Seth Flaxman, Sharad Goel, and Justin M Rao. 2016. Filter bubbles,
Quarterly 85, 2 (2008), 257–272.
echo chambers, and online news consumption. Public opinion quarterly
[25] Brian E Weeks and R Lance Holbert. 2013. Predicting dissemination
80, S1 (2016), 298–320.
of news content in social media: A focus on reception, friending, and
[12] Martin Flintham, Christian Karner, Khaled Bachour, Helen Creswick,
partisanship. Journalism & Mass Communication Quarterly 90, 2 (2013),
Neha Gupta, and Stuart Moran. 2018. Falling for Fake News: In-
212–232.
vestigating the Consumption of News via Social Media. In Proceed-
ings of the 2018 CHI Conference on Human Factors in Computing Sys-
tems (CHI ’18). ACM, New York, NY, USA, Article 376, 10 pages.You can also read