Understanding the Use of Images to Spread COVID-19 Misinformation on Twitter
←
→
Page content transcription
If your browser does not render page correctly, please read the page content below
Understanding the Use of Images to Spread COVID-19
Misinformation on Twitter
YUPING WANG, Boston University, USA
CHEN LING, Boston University, USA
GIANLUCA STRINGHINI, Boston University, USA
While COVID-19 text misinformation has already been investigated by various scholars, fewer research efforts
have been devoted to characterizing and understanding COVID-19 misinformation that is carried out through
visuals like photographs and memes. In this paper, we present a mixed-method analysis of image-based COVID-
19 misinformation in 2020 on Twitter. We deploy a computational pipeline to identify COVID-19 related
tweets, download the images contained in them, and group together visually similar images. We then develop
a codebook to characterize COVID-19 misinformation and manually label images as misinformation or not.
Finally, we perform a quantitative analysis of tweets containing COVID-19 misinformation images. We identify
five types of COVID-19 misinformation, from a wrong understanding of the threat severity of COVID-19 to the
promotion of fake cures and conspiracy theories. We also find that tweets containing COVID-19 misinformation
images do not receive more interactions than baseline tweets with random images posted by the same set of
users. As for temporal properties, COVID-19 misinformation images are shared for longer periods of time than
non-misinformation ones, as well as have longer burst times. When looking at the users sharing COVID-19
misinformation images on Twitter from the perspective of their political leanings, we find that pro-Democrat
and pro-Republican users share a similar amount of tweets containing misleading or false COVID-19 images.
However, the types of images that they share are different: while pro-Democrat users focus on misleading
claims about the Trump administration’s response to the pandemic, as well as often sharing manipulated images
intended as satire, pro-Republican users often promote hydroxychloroquine, an ineffective medicine against
COVID-19, as well as conspiracy theories about the origin of the virus. Our analysis sets a basis for better
understanding COVID-19 misinformation images on social media and the nuances in effectively moderate them.

1 INTRODUCTION
People who spend time online are constantly bombarded by a deluge of information, consisting
not only of text, but also of visuals like images, GIFs, and memes. With limited time, expertise,
and investigative means, people usually have to take this information at face value and cannot
reliably determine if it is true or not. The COVID-19 pandemic has exacerbated this problem, with
a lack of knowledge about the virus allowing misinformation to spread in the early stage of the
pandemic [52, 64].
 A wealth of research has been conducted in the past two years to better understand the dynamics
of COVID-19 related misinformation and its effect on our society and on public health measures [18,
26, 33, 51, 75, 76]. Most of this research has focused on textual content shared on social media;
misinformation, however, is not solely composed of text but also of visuals. Images are more
immediate than text, and can convey more complex messages than what can be contained in short
social media posts (e.g., tweets) [47]. As a result, COVID-19 related image misinformation is
particularly dangerous, because it can become viral and severely impact our society, for example by
encouraging people not to protect themselves properly or promoting false cures. Despite the dangers
posed by image-based COVID-19 misinformation, the research community has spent limited efforts
to understand the problem, by either only analyzing images that appeared in news articles and were
fact-checked [13] or by focusing on false information spread within a single country [34]. In [44],
Authors’ addresses: Yuping Wang, Boston University, Boston, MA, USA, yupingw@bu.edu; Chen Ling, Boston University,
Boston, MA, USA, ccling@bu.edu; Gianluca Stringhini, Boston University, Boston, MA, USA, gian@bu.edu.

2023. XXXX-XXXX/2023/3-ART $15.00
https://doi.org/10.1145/nnnnnnn.nnnnnnn

 , Vol. 1, No. 1, Article . Publication date: March 2023.
2 Yuping Wang, Chen Ling, and Gianluca Stringhini

researchers discuss how COVID-19 case illustrations are used by COVID-19 skeptics to support
their own beliefs.
 In this paper, we aim to shed light on how images are used to spread COVID-19 misinformation on
Twitter. To this end, we collect 2.3M COVID-19 related tweets posted between March 1, 2020 to June
16, 2020. We then download 340K images included in those tweets. To facilitate manual analysis
of these messages, we build a computational pipeline based on perceptual hashing techniques and
clustering algorithms to group visually similar images together. We then develop a codebook to
characterize COVID-19 misinformation images, identify five different types of COVID-19 misinfor-
mation images, and build a dataset of over 2.8K COVID-19 misinformation images posted on Twitter.
We then perform a quantitative analysis on the tweets that contain COVID-19 misinformation images
to answer the following research questions:
 ∙ RQ1: Do COVID-19 misinformation images generate more user engagement?
 ∙ RQ2: What are the temporal properties of COVID-19 misinformation images? Do COVID-19
 misinformation images have a longer lifespan and longer burst times than non-misinformation
 images?
 ∙ RQ3: What are the characteristics of users who post COVID-19 misinformation images?
 For RQ1, we compare the reactions (retweets and likes) to tweets containing COVID-19 mis-
information images with baseline tweets, as well as baseline tweets containing random images
posted by the same set of users. We find that tweets containing COVID-19 misinformation images
do not receive significantly more engagement on Twitter. For RQ2, we compare the lifespan of
COVID-19 misinformation images on Twitter with that of non-misinformation images, finding that
tweets containing COVID-19 misinformation images are shared for longer periods of time, and they
also tend to have longer burst times.
 For RQ3, we apply a mixed approach to characterize the users who post COVID-19 misinformation
images. We find that these users are quite diverse and from all over the world. Additionally, we
find that a large portion of the US users in our dataset supports either the Republican Party or
Democratic Party, and we find that users who support the Democratic and the Republican parties
post a similar amount of tweets with misleading or false COVID-19 images. At a first glance, this
is in contrast with previous work. For example, Lazer et al. [42] shows that registered Republicans
are far more likely to share COVID-19 misinformation by citing URLs from fake news outlets than
registered Democrats during the pandemic. Our analysis does however find that the type of COVID-
19 misinformation images shared by supporters of the two parties is different. While pro-Republican
users often promote COVID-19 conspiracy theories about the origin of the virus and advocate for
the use of hydroxychloroquine to treat COVID-19, pro-Democrat users share false or misleading
claims surrounding the response to the pandemic adopted by the Trump administration, as well as
manipulated or forged images intended as satire.
 Our results shed light on how images are used to spread COVID-19 misinformation on Twitter.
Most interestingly RQ1 contradicts what was found by previous research on misinformation, which
found that tweets containing false information receive more engagement [80, 82]. A potential reason
is that past research followed a top-down approach, only looking for false stories that had been
fact-checked, while our approach is bottom-up, identifying groups of misinformation images as
they are posted online. We argue that more discussion is needed within the misinformation research
community to better understand the advantages and disadvantages of different data approaches, and
the biases that these choices might introduce in research results. We release our dataset of labeled
COVID-19 image-based misinformation tweets at the following link1 and we hope that it will spark

1 https://doi.org/10.5281/zenodo.7581800

, Vol. 1, No. 1, Article . Publication date: March 2023.

Understanding the Use of Images to Spread COVID-19 Misinformation on Twitter 3

more research in this space by the computer-supported cooperative work and social computing
community.

2 RELATED WORK
In this section, we first present the definition of misinformation that we follow in this paper. Next,
we review previous work that studied text-based misinformation on social media. We then focus on
research that looked at image-based misinformation, and finally discuss work that focused on false
information spread specifically in the context of COVID-19. For a complete review of misinformation
work, readers can refer to [6, 40, 97].
Definition of misinformation. Research on false information typically distinguishes between in-
formation that is spread with malicious intent (i.e., disinformation) and incorrect claims that are
genuinely believed by whoever is posting them (i.e., misinformation) [43, 83, 84, 88]. While this
distinction is important to understand the goal of people posting false information online and to
design appropriate defenses, we argue that it is very challenging to infer the intent with which a
piece of false information is posted online. For this reason, in this paper, we adopt the definition
of misinformation proposed by Wu et al., which defines misinformation as “informative content
that contains incorrect or inaccurate information” [88], regardless of the purpose with which it was
posted.
Text misinformation. Various misinformation research projects focus on text misinformation post-
ed on social media. One research direction is to develop automated approaches to detect false
information, which typically are based on machine learning and natural language processing tech-
niques [16, 72, 81, 87]. These approaches are however not a silver bullet, as identifying false
information is a nuanced problem that is difficult to automate. Bozarth and Budak [10] found that the
performance of trained models for false information detection varies significantly when trained and
tested on different ground truth datasets, highlighting the challenges in generalizing research results
in this space and developing general purpose approaches.
 Another research direction is to investigate the propagation of misinformation by using qualitative
and quantitative approaches. Vosoughi et al. [80] explored how textual information spreads on Twitter.
The authors collected a set of tweets containing links to news articles that were fact-checked by
organizations like Snopes and were either debunked or found to be true. Their analysis found that
tweets containing links to debunked articles get shared more than those pointing to truthful articles.
 Since fact-checking all news articles that appear on social media is a daunting task, and it is
unfeasible for fact-checking organizations to cover them all, another line of research considers the
trustworthiness of entire news outlets, instead of focusing on single articles [15, 43]. For example,
researchers investigated the spread of articles from untrustworthy news outlets during the 2016 US
presidential election [15, 30], and both concluded that although untrustworthy news outlets had a
large influence on social media users, news articles written by trustworthy news outlets were still
more widely shared than those from untrustworthy news outlets [15, 30]. By inspecting narratives
around two distinct political themes, authors of [73, 84] showed that untrustworthy news outlets
often coordinated with each other when shaping discourses around specific topics.
 Zannettou et al. [93] conducted a large-scale measurement analysis investigating state-sponsored
troll accounts active on Twitter. They focused on multiple aspects, including the temporal character-
istics and content of tweets posted by Twitter trolls. Their results showed that state-sponsored trolls
were influential and efficient in spreading URLs, and that trolls sponsored by different countries
pushed distinct and often opposite political agendas.
Image-based misinformation. Another line of work investigates how image misinformation spreads
over social media. Several approaches focus on developing automated detection methods to identify
misinformation images, either manipulated images [1, 9, 95], or images that are taken out of context or

 , Vol. 1, No. 1, Article . Publication date: March 2023.
4 Yuping Wang, Chen Ling, and Gianluca Stringhini

misinterpreted on social media [2, 7, 23, 36, 98]. The effectiveness and adoption of these approaches
are impaired by the difficulty in building comprehensive ground truth of misinformation images,
which usually have to be performed manually. Researchers have mitigated this problem by relying on
images that have been fact-checked by organizations like Snopes [82]. In this paper, we develop what
is, to the best of our knowledge, the first annotated dataset of COVID-19 misinformation images
shared on Twitter. By making this dataset available to the public, we hope to foster additional research
in automatically identifying misinformation images.
 Other research used computational approaches to study the spread of image-based misinformation
on social media. Previous work showed that images are commonly used on social media to spread
misinformation [24, 66], as well as hateful content [38, 91]. Additionally, misinformation images
are commonly used in political settings. Previous research found that these images were prevalent
in public WhatsApp groups during election campaigns in India and Brazil [28, 67, 68], and that
state-sponsored influence campaigns made wide use of images too [57, 92].
 Wang et al. [82] analyzed the spread of Fauxography images on social media, which are images
that are presented in an incorrect or untruthful fashion. They collected fact-checked images from
Snopes, and identify 67k instances of those images that were posted on Twitter, Reddit, and 4chan,
by looking at their visual similarity. They found that social media posts containing debunked images
are more likely to be re-shared or liked than those that contain random images by the same set of
users.
 Zannettou et al. used visual similarity (i.e., perceptual hashing) and images annotated by the
website KnowYourMeme to identify and study image memes posted on social media. As follow up
work, Ling et al. [47] performed a mixed-method analysis of popular memes, looking for which
indicators contribute to their virality.
 In the spirit of this past research, in this paper, we study how images containing misinformation
on COVID-19 are shared on Twitter. Unlike previous work, which relied on a top-down approach
of looking for images that have been fact-checked or labeled by external organizations, we fol-
low a bottom-up approach, grouping together images that look similar, developing a codebook to
characterize image-based misinformation, annotating, and analyzing them.
COVID-19 misinformation. Given the severe impact that misinformation had on the societal re-
sponse to the COVID-19 pandemic, researchers have been focusing on understanding this type of
misinformation as well. To facilitate research in this space, scholars have released several COVID-19
related datasets, including tweets [18] and news articles [96]. Researchers used these datasets to
investigate how social media users react to COVID-19 related health misinformation, related for
example to the use of masks [89] or fake cures [51, 55]. Other work focused on investigating conspir-
acy theories related to COVID-19 [4, 56], often highlighting that these conspiracy theories often lead
to serious consequences, like a raise in anti-Asian hatred [33, 71, 75].
 The aforementioned work focuses on text when studying COVID-19 misinformation, and limited
work has been conducted looking at images shared in this context. Javed et al. [35], in the journal
extension of [34], studied COVID-19 textual and image misinformation shared in public WhatsApp
groups and on Twitter in Pakistan, finding that the spread of this content appears to be organic
and not carried out by bots on Twitter. Lee et al. [44] looked at manipulated and misleading data
visualizations used to push false narratives surrounding COVID-19. Compared to these previous
work, our study is more general as we look at any type of image used to carry out COVID-19
misinformation, and we do not focus on a single country but look at the entirety of Twitter (although
we zoom into US-based users for RQ3).
Remarks. To the best of our knowledge, this work is the first that measures the impact of images that
contain COVID-19 misinformation shared by global Twitter users, and the temporal characteristics

, Vol. 1, No. 1, Article . Publication date: March 2023.
Understanding the Use of Images to Spread COVID-19 Misinformation on Twitter 5

 Hashtags Images pHashes Clusters Annotation
 Hashtag Data Encode
 Clustering and Further
 Selection Collection Images
 Analysis

 Fig. 1. Overview of our computational analysis pipeline.

of these images. We also analyze the political leanings of US-based users who share these misinfor-
mation images. This work is an additional step forward in the dialogue that the CSCW community
has been having in the last years on understanding and tackling misinformation [29, 32, 74, 84],
including image-based one [47]. Additionally, our dataset will be a useful asset for CSCW researchers
wanting to study COVID-19 image-based misinformation, facilitating for example work in content
moderation and misinformation detection.

3 METHODS & DATASET
To collect and annotate data for this paper we follow a mixed-method approach. At first, we perform
a snowball sampling starting from COVID-19 related hashtags to identify a large number of related
tweets from the Twitter Streaming API. We then download all images shared in tweets and apply
perceptual hashing and clustering to group together images that look similar. Next, to identify
images that contain misinformation we develop a codebook to facilitate the labeling of COVID-
19 misinformation images and their categorization. Finally, we analyze the identified COVID-19
misinformation images to answer our research questions. A summary of our research pipeline is
shown in Figure 1. In the following, we discuss each phase of our analysis pipeline in detail.

3.1 Dataset construction
As a first step, we need to collect Twitter data related to the COVID-19 pandemic and download
the images contained in those tweets. To this end, we follow the same snowball sampling approach
conducted by past research on hateful tweets [17]. For our analysis, we leverage data from the public
1% Twitter Streaming API [19, 41, 65].
Hashtag selection. First, we collect all public tweets returned by the API during the month of March
2020. We then aim to identify popular hashtags that are included in COVID-19 related tweets. To
this end, we start by extracting all tweets that contain three hashtags: “COVID,” “coronavirus,” and
“COVID19.” We then proceed by identifying other hashtags that co-occur with these three, similarly
to what was done by [17]. We finally select the 100 most popular co-occurring hashtags; adding these
to our initial set, we have 103 total hashtags. The full list of hashtags has been shared anonymously
at the following link.2
Data collection. By using the Twitter streaming API (which provides a 1% sample of all public
tweets), we obtain a total of 505,346,347 tweets between March 1, 2020 and June 16, 2020. Then
by using the 103 identified popular COVID-19 related hashtags in the hashtag selection step, we
extract all tweets containing any of these hashtags from these 505M tweets. This gives us a total
of 2,335,412 COVID-19 related tweets. Of these, 370,465 tweets contain image URLs, of which
we are able to successfully download 339,952 images, which are shared by 339,891 tweets in June
2020. The tweets not included in the COVID-19 related dataset will also be used in RQ1 to establish
baselines.
 Note that we collect our own data instead of using existing datasets like the one compiled by Chen
et al. [18] because for our analysis we need to compare tweets with images containing COVID-19
misinformation with baseline tweets posted by the same users sharing COVID-19 misinformation
image tweets, to avoid bias generated by considering tweets from users with varying numbers of
2 https://bit.ly/3XHPkb6

 , Vol. 1, No. 1, Article . Publication date: March 2023.

6 Yuping Wang, Chen Ling, and Gianluca Stringhini

 1.0

 0.8

 0.6
 CDF
 0.4

 0.2

 0.0 image clusters
 101 102 103
 Number of images

 Fig. 2. The cumulative distribution function (CDF) of image cluster sizes.

followers [82, 90]. The baseline obtained from the Twitter Streaming API is more general since it
contains tweets related to COVID-19, as well as tweets unrelated to COVID-19, which are missing
in existing COVID-19 Twitter datasets [18]. Therefore, we rely on data collected from the Twitter
Streaming API instead. Please see Section 4.1 for more details about how we build the baselines.
Ethics. In this work, we only use publicly available data posted on Twitter, and we do not analyze any
personally identifiable information or interact with Twitter users in any way. As such, this research is
not considered as a human subject by the IRB at Boston University. Nonetheless, we apply standard
best practices when dealing with our data. For example, since there are human faces in our dataset,
which create privacy concerns, in this paper we blur the face of people portrayed in images unless a)
they are public figures, b) the image is a drawing, or c) the image comes from stock photography.

3.2 Grouping visually similar images
Images on social media do not appear in isolation, but rather are often re-shared and modified,
becoming memes [24]. Therefore, to analyze how images are used in online discourse, we need
techniques to group together not only occurrences of the same identical image, but also of visually
similar images which might be variations of the same meme. This also reduces the workload required
for human annotators when labeling images as misinformation, as we will discuss in Section 3.3. To
identify and group together visually similar images we use the method used by [28] and [91]. We
first calculate perceptual hashes (pHashes) for the images in our dataset, and then use clustering to
group similar images together. In the rest of this section, we describe these two steps in detail.
Encode images. To find images that are visually similar we apply perceptual hashing to encode
them. This technique returns binary vectors (pHashes) of 64 bits that are numerically close if the
images are visually similar [53]. This allows us to find not only images that are identical, but also
minor variations or meme derivatives of an image. We use the version of perceptual hashing provided
by the ImageHash library [14], which previous work showed is robust to image transformations (e.g.,
slight rotation, skew) [91].
Image clustering. After obtaining the pHash values for all images in our dataset, we apply clustering
to group together similar images. To this end, we use the DBSCAN clustering technique [25], which
was used for similar purposes in previous work [91]. We learn from the experience of parameter
selection from [91], setting the Hamming distance difference threshold for pHash values of two
images to be considered visually similar to 6 and the minimum number of elements in a cluster
to 5. The detailed process followed to select these thresholds is described in Appendix A. Our
implementation of DBSCAN is based on [63].

, Vol. 1, No. 1, Article . Publication date: March 2023.
Understanding the Use of Images to Spread COVID-19 Misinformation on Twitter 7

Fig. 3. Little or indistinguishable visual dissimilarity of two images with distinct pHash values in our
dataset.

 As we described above, we obtain 339,952 images in total. Of these, 78,348 are obtained from
original tweets, 261,604 are from retweets. Note that at this stage of our analysis we do not distinguish
between images posted as original tweets and retweets. All images are fed into the DBSCAN
clustering algorithm.
 After clustering images, we group 148,987 images into 7,773 clusters. The cumulative distribution
function (CDF) of the size of these clusters is shown in Figure 2. The median size of these clusters is
8, but there is a long tail of clusters that are much larger, with 10% of the clusters containing 31 or
more images. In the subsequent annotation, we will focus on the images contained in clusters only.
The reason is that we are interested in understanding how misinformation images are re-shared on
Twitter, and if images did not cluster together it is safe to assume that they did not become popular
on Twitter. In fact, considering that our data is a uniform 1% sample of all public tweets and that
our minimum cluster size is 5, we can assume that images that do not form clusters in our dataset
were likely shared publicly on Twitter less than 500 times at the time when the data was collected. In
Appendix B we perform an additional analysis showing that tweets containing images that did not
get clustered by our approach attracted significantly fewer retweets and likes than those that formed
clusters, confirming our intuition. Other work in this area also focused on subsets of all images when
performing annotation, by either only annotating the most shared images [68] or by taking a sample
of images for annotation [28, 67]. Therefore, we believe that the selection criteria that we use to filter
our data is appropriate for our purposes.
Evaluating image similarity within the same clusters. Before continuing with our annotation and
analysis, it is of paramount importance to understand whether the clusters produced by our approach
are of good quality. In other words, we want to assess whether images that are clustered together
are either instances of the same original image or minor variations of it. To this end, we first look
at how many clusters only contain identical images. We find that 6,128 out of 7,773 clusters only
contain images with identical pHash values, which indicates all the images within the same cluster
are visually identical [68, 92].
 We then manually inspect the remaining 1,645 clusters that contain images with different pHash
values. We find that these clusters fall within three categories:

 , Vol. 1, No. 1, Article . Publication date: March 2023.
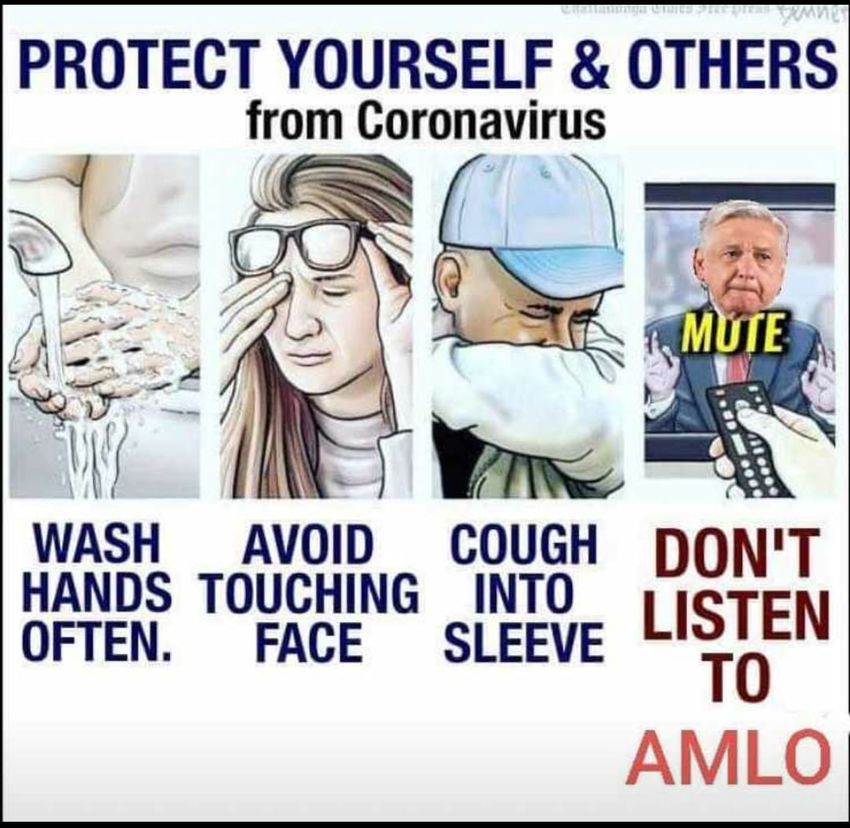
8 Yuping Wang, Chen Ling, and Gianluca Stringhini

Fig. 4. Minor variations or meme derivatives of two images with distinct pHash values in our dataset.

 ∙ Clusters containing images that although having distinct pHash values, they appear identical
 to the human eye. This is due to very small differences in the images. One such example is
 shown in Figure 3.
 ∙ Clusters containing images that are derivatives (i.e., minor variations) of other images in the
 cluster. An example of two images falling in this category is shown in Figure 4. As it can be
 seen, the meaning of the images is similar (adopt simple precautions to protect yourself from
 COVID-19 and do not listen to politicians), but while one image is targeted at a US audience,
 the second one is targeted at a Mexican one.
 ∙ Clusters containing images that do not appear visually similar to the human eye, despite having
 close pHash values. This is due to limitations in the pHash algorithm. For example, images
 where the background of a certain color dominates might be mistakenly grouped together. We
 consider these as false positives of our clustering approach.
 After inspecting all clusters, we find that 105 image clusters contain false positives. This translates
into our approach having an accuracy of 98.6%, giving us confidence that our approach is reliable in
grouping together similar images. Note that since the false positive clusters appear visually different
to a human annotator, they are ignored in the later stages of our analyses to avoid biases in our results.
In total, we have 7,668 clusters left, containing 146,192 images.

3.3 Identifying COVID-19 misinformation images
Because whether an image contains misinformation or not often depends on context, it is challenging
to automatically label images as misinformation. To overcome this limitation, we manually annotate
every image cluster in our dataset with the goal of building a credible ground-truth dataset [5, 21, 61].
 In this section, we develop a codebook to guide the thematic annotation process for COVID-19
images on Twitter [11]. As mentioned previously, we use the definition of misinformation proposed
by [88], which defines misinformation as “informative content that contains incorrect or inaccurate
information.” We divide the development of this codebook into two phases based on this definition.
First, we use binary labeling to evaluate whether or not images are related to COVID-19. If so,
then we call these images “informative.” As a further step, we characterize the images that contain
misinformation.
 We use the following three steps to create our codebook and perform annotation: 1) Two researchers
separately evaluate our dataset and provide preliminary codes based on thematic coding [11]. 2) We
then discuss these preliminary codes and go through multiple rounds, utilizing a subset of the data to
create a complete codebook. The procedure is repeated until the codebook reaches a point where

, Vol. 1, No. 1, Article . Publication date: March 2023.
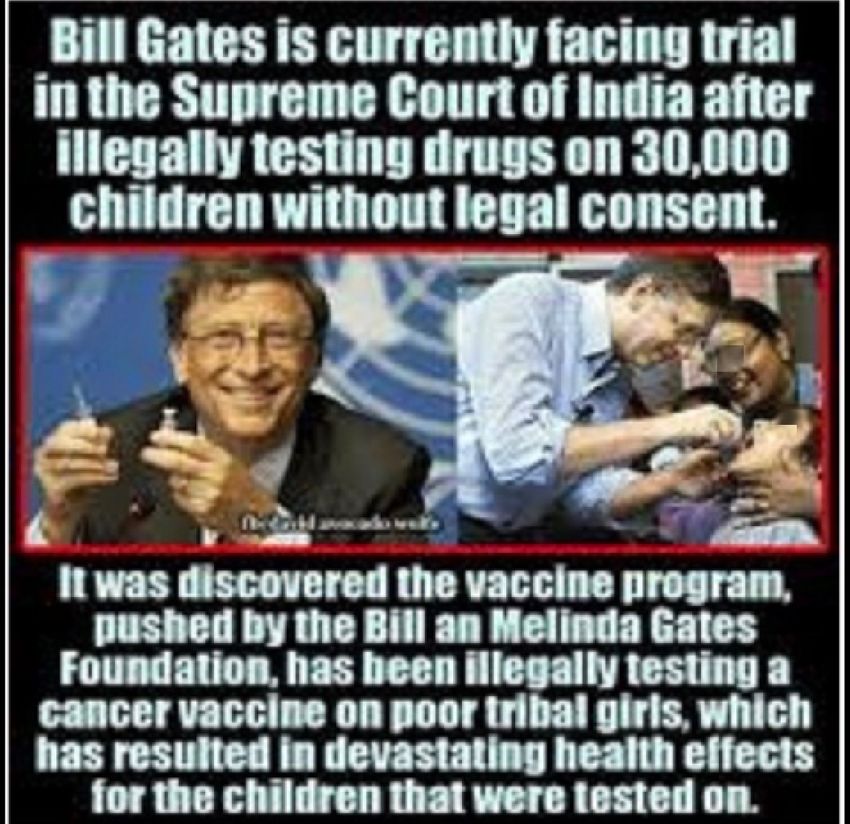
Understanding the Use of Images to Spread COVID-19 Misinformation on Twitter 9

 (a) Conspiracy theories on (b) Fauxtography of a lion wandering (c) Misinformation on using a malaria
 Bill Gates. the streets of Russia. drug to treat COVID-19.

 (d) Wrong understanding of the (e) Other false claims.
 threat severity of COVID-19.

 Fig. 5. Types of COVID-19 misinformation images identified by our codebook.

future iterations would not improve it anymore. 3) The same two researchers classify the remainder
of our dataset and discuss differences until a satisfactory consensus is obtained.
 We next describe our process and our codebook in more detail.
Phase I: Labeling informative images. As previously stated, the initial stage of our annotation
process is concerned with selecting informative images, which are images related to COVID-19. We
begin by selecting 1,000 clusters at random from our dataset of 7,668 clusters. Two of the authors
of this paper review and discuss every image in these clusters to develop a shared understanding of
what an informative image looks like. The authors agree on the following criteria for an informative
image based on this initial dataset:
 ∙ The image has no words or contain words in English or Chinese. We focus on these two
 languages because these are the two languages spoken by the researchers that annotated the
 dataset.
 ∙ The image must contain sufficient visual cues or words connected to the COVID-19 pandem-
 ic, such as RNA virus, public figures during the pandemic, and medical elements such as
 physicians, hospitals, face masks, and so on.
 As long as one image in a cluster is informative, then we label this image cluster as informative.
This is reasonable, because as we showed in Section 3.2, the accuracy of our clustering approach is
high, and those clusters that did not produce good results were manually removed before proceeding
to this annotation. Note the only goal of determining “informative” images is to filter out a smaller
set of image candidates for us to manually identify COVID-19 misinformation images.
 After the two authors independently label the 1,000 image clusters as either informative or non-
informative by checking every image in these image clusters, we calculate the Cohen’s Kappa
between the annotators and find perfect agreement ( = 0.991) [49]. This shows that two annotators

 , Vol. 1, No. 1, Article . Publication date: March 2023.
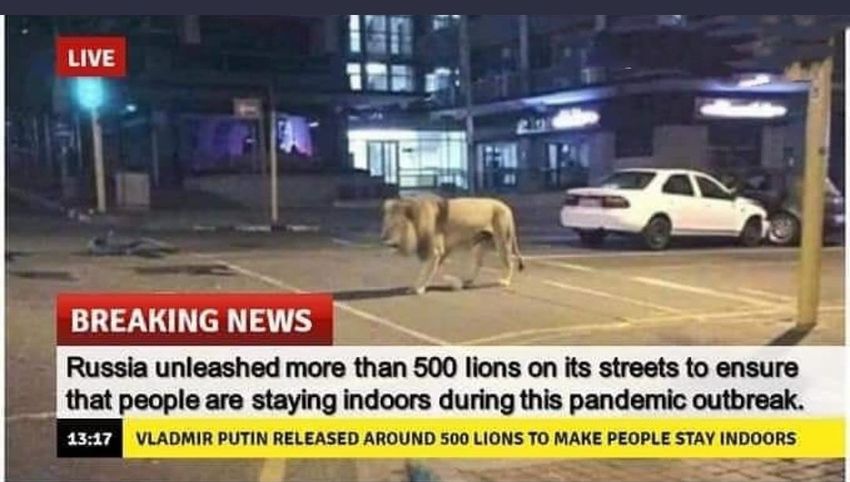
10 Yuping Wang, Chen Ling, and Gianluca Stringhini

 Type #Cluster #Images
 Conspiracies on COVID-19. 91 1,403
 Wrong understanding of the threat severity of COVID-19. 10 294
 Fauxtography. 27 455
 Wrong medical advice. 41 605
 Other false claims. 23 478

 Table 1. Overview of cluster numbers and number of images for each of the misinformation types.

strongly agree with each other, verifying the codebook’s validity. After establishing that the codebook
is mutually agreed by the annotators, the rest of the images in our collection are labeled by the first
author by checking every image in these image clusters. Finally, out of 7,668 clusters, we identify
2,316 informative clusters containing 39,367 images.
 Note that if the text in a tweet is related to COVID-19 this does not necessarily imply that the
images included in this tweet are also related to COVID-19. For example, a tweet discussing the
pandemic in the text might include a generic image like a reaction GIF.
Phase II: Characterizing COVID-19 misinformation images. While identifying images as infor-
mative is important for comprehending the problem, not all informative images contain misinfor-
mation. In fact, a wealth of good information is posted on social media to urge individuals to take
responsibility and take measures for halting the pandemic. In this phase, we want to identify the
features of COVID-19 misinformation images, by analyzing image themes. We start by having both
annotators look over the labeled informative images from Phase I. We follow a loose approach with
the objective of getting a basic idea of the themes present in the dataset. Annotators then convene to
discuss their findings.
 Eventually, the annotators identify five types of misinformation, the specifics of which are presented
below.
 (1) Conspiracies on COVID-19. Conspiracy theories, particularly those involving science, medicine,
 and health-related issues, are common since long before the COVID-19 pandemic [58]. A
 large body of research has demonstrated that conspiracy theories can cause individuals to
 reject information from competent authorities, raising worries about the potential for popular
 conspiracy theories to diminish people’s willingness to follow public health advice [27, 62, 78].
 In this work we define conspiracy images as visuals that provide a theory that explains an
 occurrence or set of circumstances as the product of a hidden scheme by generally strong
 conspirators [79]. Figure 5(a) shows an example of this type of misinformation.
 (2) Fauxtography. Previous research indicates that a minority of misinformation is created from
 scratch [12]. A prominent example of information that is repurposed with the goal of misleading
 is fauxtography, where a photo is altered or miscaptioned to convey false information [82].
 An example of this type of misinformation is shown in Figure 5(b), where a news screenshot
 presents a lion wandering on the street. The caption says that “Russia unleashed more than 500
 lions on its streets to ensure that people are staying indoors during the pandemic outbreak.” In
 reality, the picture is depicting a lion that was roaming the streets of a South African city after
 being released by a local film company in 2016, and it has nothing to do with COVID-19. 3
 (3) Wrong medical advice. Our dataset contains a number of instances of incorrect medical
 advice, in accordance with previous work studying health misinformation during the COVID-
 19 pandemic [50]. Examples include not wearing masks or fake cures against COVID-19.
 According to past research, verified Twitter handles (including organizations/celebrities) are
3 https://www.snopes.com/fact-check/russia-release-lions-coronavirus/

, Vol. 1, No. 1, Article . Publication date: March 2023.
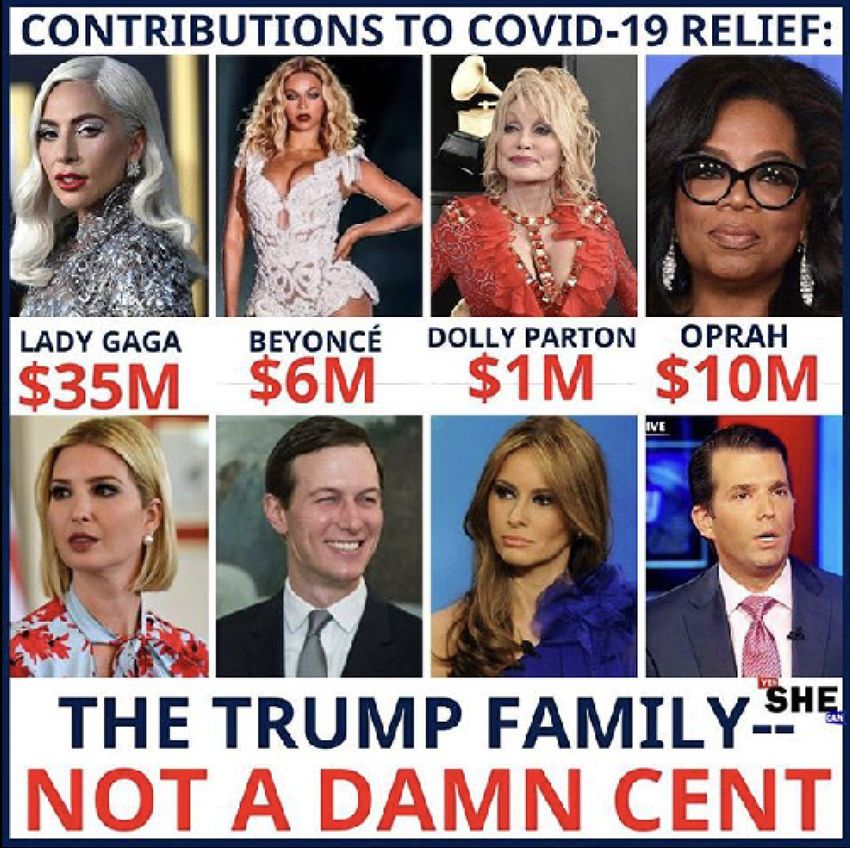
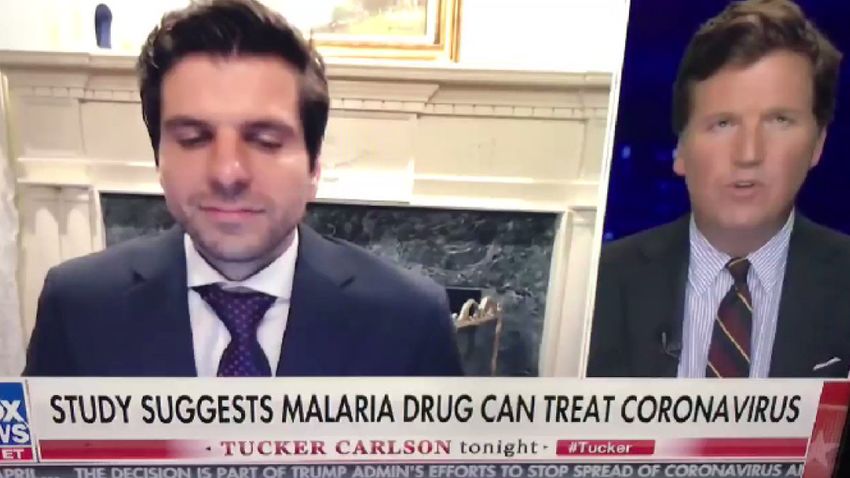
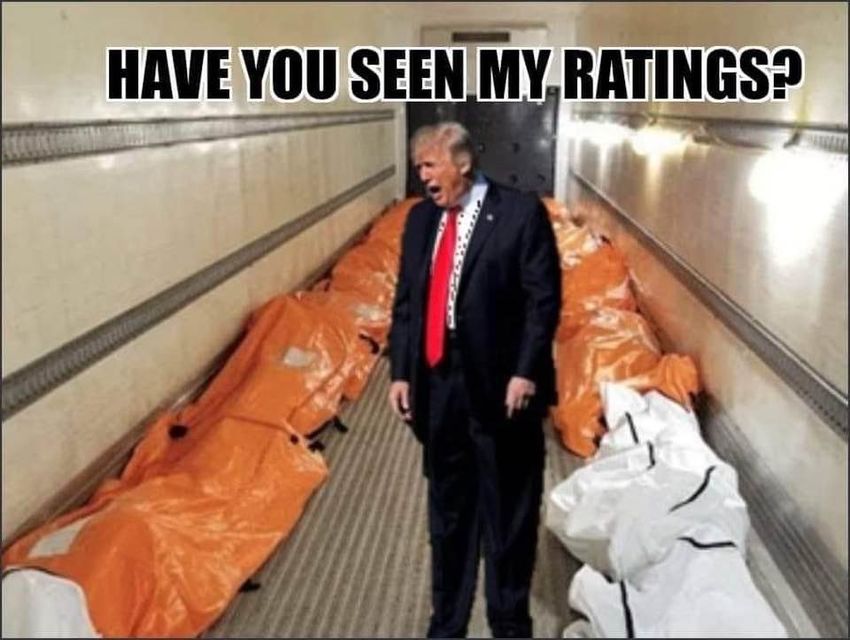
Understanding the Use of Images to Spread COVID-19 Misinformation on Twitter 11

 104
 number of tweets
 103

 102

 101
 misinformation
 non-misinformation
 100 covid-tweets

 20 20 20 20 20 20 20 20 20 20 20 20 20 20 20 20
 1 /20 8/20 5/20 2/20 9/20 5/20 2/20 9/20 6/20 3/20 0/20 7/20 4/20 1/20 7/20 4/20
 /0 /0 /1 /2 /2 /0 /1 /1 /2 /0 /1 /1 /2 /3 /0 /1
 03 03 03 03 03 04 04 04 04 05 05 05 05 05 06 06

Fig. 6. Number of tweets containing COVID-19 misinformation images, non-misinformation images,
and overall COVID-19 tweets in our dataset appearing every day during our observation period.

 also active in either generating (new tweets) or distributing misinformation (retweets) [70]. In
 Figure 5(c), the screenshot of a news broadcast claims “Malaria drug can treat coronavirus.” 4
 (4) Wrong understanding of the threat severity of COVID-19. There are so-called COVID-19
 skeptics [44], who do not believe COVID-19 poses a serious threat [54, 86], putting anyone
 who believes this message in peril. Examples include claiming COVID-19 is a fabrication or
 that COVID-19 is a common flu. Figure 5(d) shows an example of this type of misinformation.
 (5) Other false claims. The text on images may also contain other false claims. One example is
 the image shown in Figure 5(e), claiming that the Trump family refused to donate money for
 COVID relief. In reality, former US President Donald Trump donated his salary from the last
 quarter of 2019 to combat COVID-19.5
 We have limited resources to determine the goal of each cluster of pictures in disseminating
misinformation, as well as the accuracy of the misinformation. Therefore, to label images as misin-
formation we use information gathered from trustworthy fact-checking websites like AP News and
WHO Mythbusters.6
 We label an image as misinformation if it falls into at least one of the five categories. As a result, a
single image might belong to two or more categories [34]. All the 2,316 informative clusters generated
during the first phase are annotated by two researchers. Similar to Phase I, the two annotators inspect
all the images in these image clusters. As long as one image is labeled as misinformation, we label
the image cluster as misinformation, and we check every image in the corresponding cluster to see
if this image is an image with misinformation. After some deliberation, the two annotators agree
on 165 image clusters to be COVID-19 misinformation image clusters, containing 2,418 images
4 Note that as the medical consensus evolves, so does the common knowledge of what is wrong medical advice. For example,
the US Food and Drug Administration (FDA) issued an emergency use authorization (EUA) authorizing the use of hydroxy-
chloroquine to treat certain COVID-19 patients between March 28, 2020 and June 15 (https://www.fda.gov/news-events/press-
announcements/coronavirus-covid-19-update-fda-revokes-emergency-use-authorization-chloroquine-and). Since our data
collection period partially overlaps with this EUA, the consensus around hydroxychloroquine changed during our study.
Nonetheless, following our definition of misinformation, we still consider this type of content as misinformation, as the use of
this drug to cure COVID-19 was later debunked.
5 https://www.cnbc.com/2020/03/03/trump-donates-his-2019-q4-salary-to-help-combat-coronavirus.html
6 https://www.who.int/emergencies/diseases/novel-coronavirus-2019/advice-for-public/myth-busters

 , Vol. 1, No. 1, Article . Publication date: March 2023.
12 Yuping Wang, Chen Ling, and Gianluca Stringhini

 1.0 1.0

 0.8 0.8

 0.6 0.6
 CDF

 CDF
 0.4 0.4
 Misinformation images Misinformation images
 0.2 Baseline 0.2 Baseline
 Baseline with Baseline with
 0.0 random images 0.0 random images
 100 101 102 103 104 105 100 101 102 103 104 105
 Number of retweets Number of likes

 (a) Retweets (b) Likes

Fig. 7. CDFs of retweets and likes for tweets with COVID-19 misinformation images vs. baseline
tweets.

posted by 2,404 users. Further inspection reveals only one image among these images clusters is
not a COVID-19 misinformation image, which is also ignored. At last, we have 165 image clusters
identified as COVID-19 misinformation image clusters, containing 2,417 images posted by 2,403
users. Table 1 provides an overview of the number of clusters identified for each category and of the
number of images in each of the categories.

4 RESULTS
The 165 COVID-19 misinformation image clusters contain 2,417 images included in 2,417 tweets in
total while the remaining 7,503 non-misinformation image clusters include 143,774 images shared in
143,755 tweets. Figure 6 shows the time occurrences of tweets containing both types of images in our
data. In Figure 6, we also plot the time occurrence of the 2.3M COVID-19 tweets that are selected
from the general tweets, as explained in Section 3.1. As it can be seen, the occurrence of three types
of tweets increased at the beginning of the observation period and then gradually declined. The
highest number of tweets containing non-misinformation images appeared on March 14, 2020 with a
total of 6,956 occurrences, while the day with the highest number of tweets containing COVID-19
misinformation images was March 18, 2020 when the total number of occurrences was 184. As
for COVID-19 tweets, the highest number of instances appeared on March 22, 2020, with 55,951
occurrences in total. After these dates, the number of tweets gradually decreased.
 In the following, we present our analysis to answer our three research questions.

4.1 RQ1: Do COVID-19 misinformation images generate more user engagement?
We use the number of retweets and likes that Twitter posts receive to characterize user engagement.
The raw Twitter data collected using the Twitter streaming API contains real-time activity, i.e., the
streaming API gathers tweets as soon as they are posted. However, tweets get re-shared and liked
over time, and only looking at this early snapshot is not enough to evaluate the engagement collected
by tweets. To comprehensively assess long-term engagement, we re-download the tweets in our
dataset based on their tweet IDs, the process of which is called hydration.7 This enables us to know
the actual number of retweets and likes of a tweet at the time of hydration.
 Twitter posts can be classified as original tweets, retweets, and quote tweets. The difference
between quote tweets and retweets is that quote tweets contain some extra text from the users who
7 https://developer.twitter.com/en/docs/twitter-api/v1/tweets/post-and-engage/api-reference/get-statuses-lookup

, Vol. 1, No. 1, Article . Publication date: March 2023.
Understanding the Use of Images to Spread COVID-19 Misinformation on Twitter 13

quote. After hydration, we find that due to limitations in the Twitter API, we cannot retrieve the
actual number of retweets and likes of normal retweets [82].8 For this reason, the assessment of
engagement retweets and likes of a normal retweet post is conducted by hydrating the original tweet
that produced the retweet post [82].
 To investigate whether tweets containing COVID-19 misinformation images receive more engage-
ment, we extract a set of random tweets posted by the same set of users who share the tweets with
COVID-19 misinformation images. This is to eliminate potential bias introduced by comparing users
with a different number of followers [82, 90]. Our goal is to compare the engagement distribution of
baseline tweets to tweets containing COVID-19 misinformation tweets.
 To assemble the data for this analysis, we first take the tweet IDs for all tweets in our dataset that
contain COVID-19 misinformation images. To avoid duplication potentially introduced by retweets,
for those tweets that are retweeted we take the tweet IDs of the original tweets instead. We then
deduplicate this set to ensure that each tweet ID is only considered once in this experiment. After this
process, we obtain 635 unique tweets containing COVID-19 misinformation images for hydration
shared by 565 users. Finally, we hydrate these tweet IDs in April 2021. This is done to ensure that
our analysis considers the latest number of retweets and likes. After this process, we obtain 483
unique tweets posted by 429 users, and 152 tweets are not available.
 To build the set of baseline tweets for comparison, we obtain all tweets that are contained in the
505M tweets obtained by using Twitter streaming API (See Section 3.1) and are posted by the 429
users who shared COVID-19 misinformation images and follow the same process described above,
while in addition removing any tweet that is already considered as part of the COVID-19 image
misinformation tweets. The amount of these deduplicated tweets is 63,283. In total, we obtain 59,644
unique baseline tweets after hydration, and 3,639 unique tweets are not available. The hydration is
conducted at the same time described above, in April 2021.
 The CDFs of the retweets and likes produced by tweets containing COVID-19 misinformation
images (labeled as “Misinformation images”) and by baseline tweets (labeled as “Baseline”) are
shown in Figure 7(a) and 7(b), respectively. Our observation is that baseline tweets are more likely
to produce more engagement than tweets containing COVID-19 misinformation images: Baseline
tweets receive a median of 53 retweets while COVID-19 misinformation images receive a median of
21 retweets. Similarly, baseline tweets receive a median of 142 likes while COVID-19 misinformation
images receive a median of 51 likes.
 To evaluate the difference between these distributions, we use two-sample Kolmogorov-Smirnov
tests (K-S test) [46]. We compare the tweets containing COVID-19 misinformation with baseline
tweets, and the results show that the difference between these two categories is statistically significant
at the < 0.01 level with = 0.181 and = 0.178 for retweets and likes, respectively. Thus, we
reject the null hypothesis that tweets containing COVID-19 misinformation images receive the same
level of engagement as baseline tweets.
 Previous research showed that tweets containing images are more likely to receive engagements
on social media [45, 82]. To reduce this bias, similar to previous work [68, 82], we further add one
baseline which is composed of 28,390 tweets that contain random images posted by the same 429
users. This set of images is drawn from all baseline tweets that contain images, and these images
do not include COVID-19 misinformation images that we identified by our approach [68, 82, 90].
Again, we plot the CDFs of the retweets and likes produced by the added baseline, which is labeled
as “Baseline with random images.” We observe that tweets containing COVID-19 misinformation

8 Inthe Twitter JSON files, the field “retweet count” of a retweet is equal to the field “retweet count” of the corresponding
original tweet, and the field “favorite count” of a retweet, which shows the number of likes the tweet receives is always 0,
even if the retweet receives a like.

 , Vol. 1, No. 1, Article . Publication date: March 2023.
14 Yuping Wang, Chen Ling, and Gianluca Stringhini

 1.0 misinformation 1.0 misinformation
 non-misinformation non-misinformation
 0.8 0.8

 0.6 0.6
 CDF

 CDF
 0.4 0.4

 0.2 0.2

 0.0 0.0
 10 3 10 2 10 1 100 101 102 10 4 10 3 10 2 10 1 100 101
 Lifespan of clusters (unit: days) Lifespan of clusters per image (unit: days)

 (a) Raw lifespan of COVID-19 misinformation images vs. (b) Normalized lifespan of COVID-19 misinformation
 non-misinformation images images vs. non-misinformation images

Fig. 8. CDF of the lifespan of COVID-19 misinformation images and non-misinformation images in
our dataset.

images also tend to produce less engagement than those with other images: Baseline tweets with
random images receive a median of 62 retweets while COVID-19 misinformation images receive a
median of 21 retweets. Similarly, baseline tweets with random images receive a median of 151 likes
while COVID-19 misinformation images receive a median of 51 likes.
 We evaluate the difference between the two distributions by using a two-sample K-S test. The
comparison is conducted between tweets with COVID-19 misinformation images and tweets with
random images, and the results show that the difference between these two categories is statistically
significant at the < 0.01 level with = 0.216 and = 0.205 for retweets and likes, respectively.
 Note that we do not directly compare tweets that contain COVID-19 misinformation images and
tweets that contain non-misinformation images that are included in the 7,503 clusters, because the
overlap of users sharing them is low: of the 429 users who share COVID-19 misinformation images,
only 130 share a total of 420 non-misinformation images. Instead, we use random images, which
include all the images other than the misinformation images shared by the same set of 429 users.
 This result shows that the tweets containing COVID-19 misinformation images are not more
popular than baseline tweets, as well as baseline tweets with random images.
Takeaways of RQ1. From RQ1, we find that COVID-19 misinformation images do not produce as
many engagements as the two baselines. In Section 6 we discuss the implications that this finding
has for the field of misinformation studies.

4.2 RQ2: What are the temporal properties of COVID-19 misinformation images?
 Do COVID-19 misinformation images have a longer lifespan and longer burst
 times than non-misinformation images?
Another interesting research question beyond the number of likes or retweets that a COVID-19
misinformation image receives is understanding the temporal properties of COVID-19 misinformation
images on Twitter. In RQ2 we aim to answer this question. In particular, we investigate the lifespan
and burst time of COVID-19 misinformation images compared to those of non-misinformation
images, respectively.
 We define the time between the first tweet containing an image in a cluster and the last tweet
containing an image from the same cluster posted as the lifespan of an image. The lifespan comparison

, Vol. 1, No. 1, Article . Publication date: March 2023.
Understanding the Use of Images to Spread COVID-19 Misinformation on Twitter 15

is conducted only between tweets with images to eliminate the effect caused by tweets without
images.
 Figure 8(a) shows the CDFs of the raw lifespan of COVID-19 misinformation images and non-
misinformation images, which corresponds to 165 COVID-19 misinformation image clusters and
7,503 non-misinformation image clusters, respectively. We can see that COVID-19 misinformation
images tend to linger on Twitter longer than non-misinformation images: Non-misinformation images
have a median raw lifespan of 1.62 days while COVID-19 misinformation images have a median raw
lifespan of 4.05 days.
 We further use a two-sample K-S test to verify the difference between the two distributions. The
result shows that the difference is statistically significant between the two distributions at the < 0.01
level with D=0.202. Therefore, we reject the null hypothesis that COVID-19 misinformation images
and non-misinformation images have the same level of lifespan.
 Noticing that the size of clusters may influence the lifespan of clusters, we normalize the raw
lifespan of clusters by the number of images for each cluster and present the CDFs of the normalized
lifespan of COVID-19 misinformation images and non-misinformation images in Figure 8(b). Still,
we find that the normalized lifespan of COVID-19 misinformation images is more likely to last longer
than non-misinformation images: Non-misinformation images have a median normalized lifespan
of 0.16 days while COVID-19 misinformation images have a median normalized lifespan of 0.38
days. Similarly, we use a two-sample K-S test to check the differences between the two distributions.
The result shows that the difference is statistically significant between the two distributions at the
 < 0.01 level with D=0.220. We conclude both the raw and normalized lifespan of COVID-19
misinformation images are longer than that of non-misinformation ones.
 We further analyze the burst time of images [68]. We define burst time as the time between two
consecutive shares of two images from one cluster, similar to [68]. Figure 9 shows the CDFs of burst
times of misinformation images and non-misinformation images. The burst time of misinformation
images tends to be longer than that of non-misinformation images: The median burst time of the
misinformation image is 0.705 hours while the median burst time of the non-misinformation image
is 0.276 hours. Again, we inspect the difference between the two CDFs by using a two-sample
K-S test, the result of which indicates that the difference is statistically significant between the two
distributions at the < 0.01 level with D=0.165. This allows us to reject the null hypothesis that
COVID-19 misinformation images and non-misinformation images have the same level of burstiness.

 1.0

 0.8

 0.6 Users Tweets
 CDF

 0.4 United States 1,282 (45.8%) 1,354 (46.9 %)
 0.2
 India 261 (9.3%) 263 (9.1%)
 misinformation United Kingdom 142 (5.1%) 142 (4.9%)
 0.0 non-misinformation
 Malaysia 99 (3.5%) 99 (3.4%)
 10 5 10 4 10 3 10 2 10 1 100 101 102
 Burst time (unit: days) South Africa 90 (3.2%) 91 (3.2% )

Fig. 9. Burst time of COVID-19 misinformation Table 2. Top 5 countries, dependencies, and areas
and non-misinformation images appearing on of special sovereignty of users sharing COVID-19
Twitter. misinformation images.

 Note that in RQ1, we use COVID-19 misinformation images compared with random images
while in RQ2 we use COVID-19 misinformation images compared with non-misinformation images.

 , Vol. 1, No. 1, Article . Publication date: March 2023.
16 Yuping Wang, Chen Ling, and Gianluca Stringhini

However in RQ2, we do not compare COVID-19 misinformation images with random images for
temporal properties because as we described in Section 3.1, we only download images that are
included in COVID-19 tweets, and we do not download random images in June 2020. When we
analyze the temporal properties of COVID-19 misinformation images in 2021, various random
images are not available for us to download. The quality of random image clusters obtained in this
way is affected by the unavailable images, and it introduces bias. In addition, compared with the
size of general tweets obtained by Twitter Streaming API and the size of COVID-19 tweets (505M
vs. 2.3M), we may have 200 times more clusters for manual inspection to ensure the quality of
these clusters, which makes it infeasible for us to remove clusters that are incorrectly clustered.
Therefore, we use the existing non-misinformation image clusters to do the comparison, which takes
into account the effect that images may bring, and it is still a good indicator to characterize that
COVID-19 misinformation images may have longer lifespans and burst times.
Takeaways of RQ2. As for temporal properties of COVID-19 misinformation images, we find that
they tend to have longer lifespans, regardless of raw or normalized, and burst times compared with
non-misinformation images. This suggests that COVID-19 misinformation images may linger longer
on Twitter and have a longer-term negative effect on Twitter users.

4.3 RQ3: What are the characteristics of users who post COVID-19 misinformation
 images?
In the first two research questions, we analyzed the characteristics of COVID-19 misinformation
images and of the tweets discussing them. In this section, we switch the attention to the users posting
COVID-19 misinformation images, looking for their characteristics and for patterns. We first look
at geographical information to better understand the geographic makeup of the users in our dataset.
Next, we look at the profile description of users, looking for popular hashtags. Finally, we look at the
political leanings of the users in the US posting COVID-19 misinformation images on Twitter. From
the 165 image clusters that contain COVID-19 misinformation images, we have 2,417 tweets that
contain COVID-19 misinformation images, which include 165 original tweets, and 2,252 retweets.
The metadata of these retweets contains 475 unique original tweets. After removing the overlapping
original tweets, in total, we have 2,887 tweets containing COVID-19 misinformation images posted
by 2,801 users.
Analysis of user locations. We look at the users who post COVID-19 misinformation images
based on their location (see previous studies like [3, 94]). To do so, the first author of this paper
manually checks all the 2,801 users to determine their home locations by using location features
and indicators from users’ profiles in the collected Twitter user metadata, which include location
fields, self-descriptions in bios, and flag icons [3, 94]. This information is at the granularity level
of countries, dependencies, and areas of special sovereignty, e.g., Puerto Rico and Hong Kong. 9 If
the profiles do not provide enough information, the author then infers the home locations of these
users by using the content [31] of their tweets posted in 2020, as well as interaction information
(e.g., mentions, retweets, or replies) generated in 2020 between these users and users whose home
locations are explicit [3, 8, 37, 48]. If such information is still not enough to infer their location, we
classify them as “unknown.”
 After the manual inspection, we find that the location for 2,656 users is known, where for 1,845
users the location is obtained from their metadata, and the other 811 users are inferred from their
tweets. For the remaining 145 users, the location is unknown. The home locations of users who post
COVID-19 misinformation images are more than 10 countries, dependencies, and areas of special
sovereignty, including English-speaking countries, e.g., US, UK, and Canada, as well as non-English
9 https://www.state.gov/dependencies-and-areas-of-special-sovereignty/

, Vol. 1, No. 1, Article . Publication date: March 2023.
You can also read