USABILITY EVALUATION OF AN ERP SYSTEM
←
→
Page content transcription
If your browser does not render page correctly, please read the page content below
U TRECHT U NIVERSITY
     Department of Information and Computing Sciences
               Human Computer Interaction
                        12 July 2021

              Nicole van den Dries   5639050

U SABILITY E VALUATION OF AN ERP S YSTEM

                                                       First Supervisor
                                                  Prof. Dr. Albert Salah
                                                     Second Supervisor
                                                     Dr. Christine Bauer
                                                   External Supervisor
                                               Drs. ing. Erik van de Ven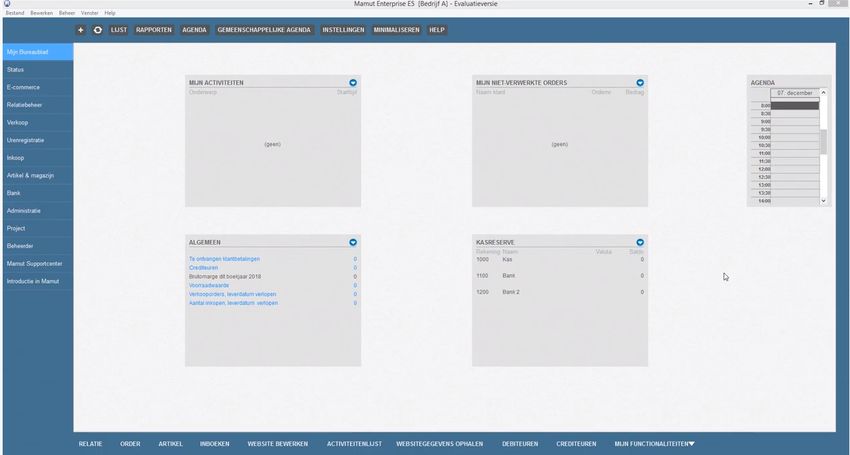
Abstract

Enterprise resource planning systems are complex systems that are used to manage busi-
ness processes in real time. The goal of implementing an ERP system is to increase the
efficiency of business processes. However, low usability can decrease the efficiency of
the employees working with the system. There are many different methods to evaluate
the usability of systems. The goal of this study is to find what type of Usability Eval-
uation Methods (UEMs) are suitable for evaluating ERP systems in a company setting.
As a use case AFAS Focus is used to conduct the UEMs. A literature review was con-
ducted to find what type of UEMs exist and what kind of feedback they provide. Based
on the literature review, three methods were chosen to perform for this study. To obtain
qualitative data, user tests were performed. Six people participated in the user tests. To
obtain quantitative data, the system usability scale and WalkMe were used. WalkMe is a
platform where, among other things, button clicks of the users can be tracked. To struc-
ture the qualitative data from the user test, statements from the participants were coded.
The number of references per code gave insight in what the participants find important in
the ERP system. WalkMe allowed to track the behaviour of all users, giving insight in
what navigation paths the users choose and how often functionalities are used. The main
results from the usability evaluation show that users would prefer to be able to customise
the views in the system, accountants and clients have different needs in an ERP system,
and that users navigate through the system in a way they are familiar with, not using the
quickest route. To conclude, the used usability evaluation methods are valuable tools to
find usability problems in the systems and using a tool such as WalkMe can automate a
part of the usability evaluation process. Not only making the system more efficient to
work with, but also making the evaluation process more efficient.

                                            2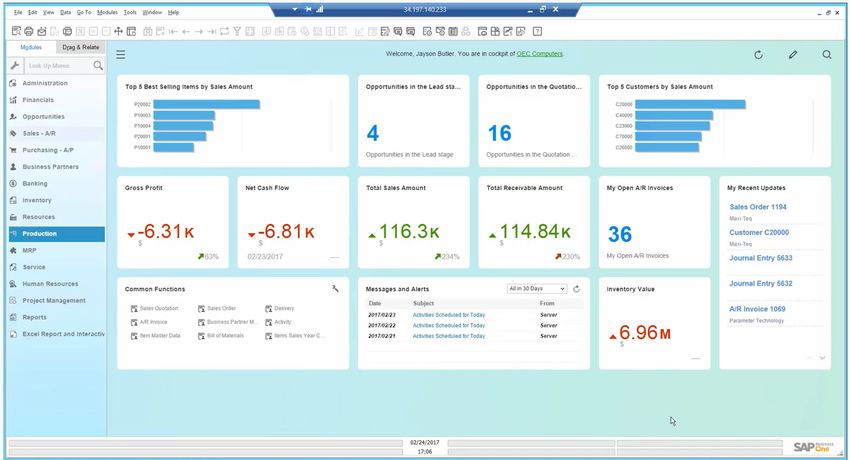
List of Abbreviations and Terms

Effectiveness          The accuracy and completeness with which the user is able to
                       complete tasks
Efficiency             The expanded resources in relation to the effectiveness when it
                       comes to completing the users goals
ERP                    Enterprise Resource Planning
Error rate             The amount of mistakes made during a user test.
Error recovery         How well or quick the user is able to recover a mistake made
                       during a user test.
Learnability           How easily a user is able to learn to work with a system
Memorability           How well the user is able to use the system proficiently after a
                       long period of not working with the system.
OEM                    Ontological Enterprise Model
SUS                    System Usability Scale
Task completion time   The time it takes to complete a given task during a user test.
UEM                    Usability Evaluation Method
UI                     User interface
UML                    Unified Modeling Language
Usability              "The extent to which a product can be used by specified
                       users to achieve specified goals with effectiveness, efficiency
                       and satisfaction in a specified context of use" (Jokela, Iivari,
                       Matero, & Karukka, 2003, p.54).
Usability problem      Anything in the system that the causes the user to be very con-
                       fused or things the user of the system does not expect to happen
                       at a certain moment.
UX                     User experience

                                          3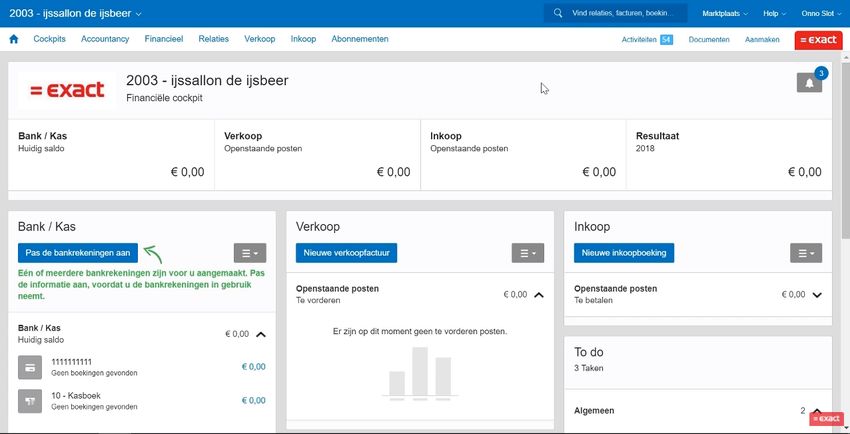
Table of Contents

List of Figures                                                                                                                           6

List of Tables                                                                                                                            8

1 Introduction                                                                                                                             9
  1.1 Definitions . . . . . . . . .   .   .   .   .   .   .   .   .   .   .   .   .   .   .   .   .   .   .   .   .   .   .   .   .   .    9
  1.2 ERP systems . . . . . . . .     .   .   .   .   .   .   .   .   .   .   .   .   .   .   .   .   .   .   .   .   .   .   .   .   .   10
  1.3 Research Questions . . . .      .   .   .   .   .   .   .   .   .   .   .   .   .   .   .   .   .   .   .   .   .   .   .   .   .   13
  1.4 Organisation of the Thesis      .   .   .   .   .   .   .   .   .   .   .   .   .   .   .   .   .   .   .   .   .   .   .   .   .   15

2 Literature Review                                                                                                                       16
  2.1 Software Usability . . . . . . . . . . .                .   .   .   .   .   .   .   .   .   .   .   .   .   .   .   .   .   .   .   16
  2.2 Usability Evaluation Methods . . . . .                  .   .   .   .   .   .   .   .   .   .   .   .   .   .   .   .   .   .   .   18
       2.2.1 User Testing . . . . . . . . . .                 .   .   .   .   .   .   .   .   .   .   .   .   .   .   .   .   .   .   .   19
       2.2.2 Usability Inspection Methods .                   .   .   .   .   .   .   .   .   .   .   .   .   .   .   .   .   .   .   .   22
       2.2.3 Inquiry Methods . . . . . . .                    .   .   .   .   .   .   .   .   .   .   .   .   .   .   .   .   .   .   .   23
  2.3 Usability Guidelines for ERP Systems                    .   .   .   .   .   .   .   .   .   .   .   .   .   .   .   .   .   .   .   25
       2.3.1 Navigation . . . . . . . . . .                   .   .   .   .   .   .   .   .   .   .   .   .   .   .   .   .   .   .   .   25
       2.3.2 Learnability . . . . . . . . . .                 .   .   .   .   .   .   .   .   .   .   .   .   .   .   .   .   .   .   .   25
       2.3.3 Error Messages . . . . . . . .                   .   .   .   .   .   .   .   .   .   .   .   .   .   .   .   .   .   .   .   26
       2.3.4 Documentation . . . . . . . .                    .   .   .   .   .   .   .   .   .   .   .   .   .   .   .   .   .   .   .   26
       2.3.5 Balance between all aspects .                    .   .   .   .   .   .   .   .   .   .   .   .   .   .   .   .   .   .   .   27

3 Case Study: The Focus ERP System of AFAS Software                                                                                       29
  3.1 Architecture of Focus . . . . . . . . . . . . . . . . . . . . . . . . . . . .                                                       29
  3.2 Existing solutions for usability testing of Focus . . . . . . . . . . . . . .                                                       31

4 Methodology                                                                                                                             34
  4.1 Participants . . . . . . . . . . . . . . . .                    .   .   .   .   .   .   .   .   .   .   .   .   .   .   .   .   .   35
  4.2 Tasks During the User Test . . . . . . . .                      .   .   .   .   .   .   .   .   .   .   .   .   .   .   .   .   .   35
  4.3 The System Usability Scale . . . . . . . .                      .   .   .   .   .   .   .   .   .   .   .   .   .   .   .   .   .   36
  4.4 Coding the Recordings . . . . . . . . . .                       .   .   .   .   .   .   .   .   .   .   .   .   .   .   .   .   .   36
  4.5 System Log Analysis . . . . . . . . . . .                       .   .   .   .   .   .   .   .   .   .   .   .   .   .   .   .   .   37
  4.6 Log Analysis and Surveys Using WalkMe                           .   .   .   .   .   .   .   .   .   .   .   .   .   .   .   .   .   37
  4.7 Materials . . . . . . . . . . . . . . . . . .                   .   .   .   .   .   .   .   .   .   .   .   .   .   .   .   .   .   39
  4.8 Protocol . . . . . . . . . . . . . . . . . .                    .   .   .   .   .   .   .   .   .   .   .   .   .   .   .   .   .   39

                                                  4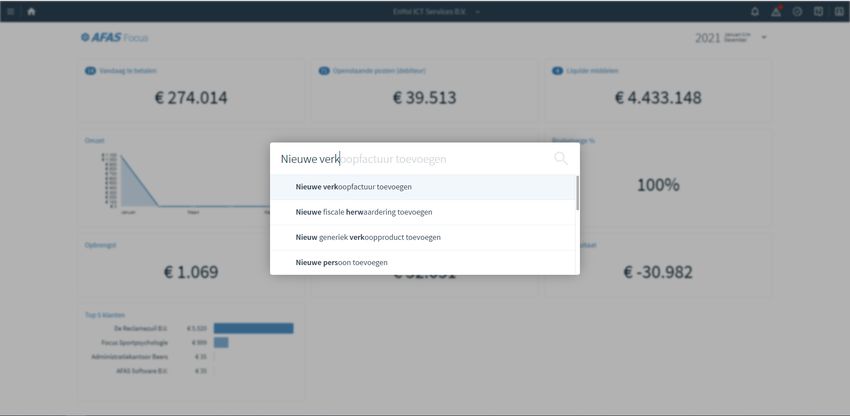
4.8.1 Pilot Study . . . . . . . . . . . . . . . . . . . . . . . . . . . . .                                                           40
   4.9   Results Analysis . . . . . . . . . . . . . . . . . . . . . . . . . . . . . . .                                                        40

5 Results                                                                                                                                      42
  5.1 Coding . . . . . . . . . . . . . . . . . . . . . . . . . . . . . . . . . . . .                                                           42
  5.2 System Usability Score . . . . . . . . . . . . . . . . . . . . . . . . . . .                                                             45
  5.3 WalkMe . . . . . . . . . . . . . . . . . . . . . . . . . . . . . . . . . . .                                                             46

6 Discussion                                                                                                                                   49
  6.1 User Tests . . . . . . .     .   .   .   .   .   .   .   .   .   .   .   .   .   .   .   .   .   .   .   .   .   .   .   .   .   .   .   49
  6.2 System Usability Scale       .   .   .   .   .   .   .   .   .   .   .   .   .   .   .   .   .   .   .   .   .   .   .   .   .   .   .   50
  6.3 WalkMe . . . . . . . .       .   .   .   .   .   .   .   .   .   .   .   .   .   .   .   .   .   .   .   .   .   .   .   .   .   .   .   51
  6.4 Limitations . . . . . .      .   .   .   .   .   .   .   .   .   .   .   .   .   .   .   .   .   .   .   .   .   .   .   .   .   .   .   51

7 Conclusion                                                                                                                                   53
  7.1 Future Work . . . . . . . . . . . . . . . . . . . . . . . . . . . . . . . . .                                                            54

References                                                                                                                                     56

A Creating a sales invoice                                                                                                                     61

B Protocol                                                                                                                                     67
  B.1 Calculation of the SUS scores . . . . . . . . . . . . . . . . . . . . . . . .                                                            71

C Results                                                                                                                                      72

                                                       5
List of Figures
1 Home screen of AFAS Focus including the navigation menu (test environ-
ment). . . . . . . . . . . . . . . . . . . . . . . . . . . . . . . . . . . . . 11
2 Home screen of SAP Business One. . . . . . . . . . . . . . . . . . . . . 12
3 Home screen of Visma Mamut One. . . . . . . . . . . . . . . . . . . . . 12
4 Home screen of Exact Online. . . . . . . . . . . . . . . . . . . . . . . . 13
5 Flowchart of the iterative usability testing process. . . . . . . . . . . . . . 15
6 Graph showing that each additional user provides fewer new usability
problems. . . . . . . . . . . . . . . . . . . . . . . . . . . . . . . . . . . 18
7 A comparison of the adjective ratings, acceptability scores, and school
grading scales in relation to the average SUS score (Bangor et al., 2009). . 24
8 Spider chart showing an example of different Pareto optimalities. . . . . . 27
9 Focus software generation approach. . . . . . . . . . . . . . . . . . . . . 29
10 Model to application. . . . . . . . . . . . . . . . . . . . . . . . . . . . . 30
11 Model of a sales invoice in the sales work field. . . . . . . . . . . . . . . 30
12 Navigation menu showing the work fields. . . . . . . . . . . . . . . . . . 31
13 Navigation menu showing the work fields and their objects. . . . . . . . . 31
14 Four different types of participants for the user tests. . . . . . . . . . . . . 35
15 Save button for sales invoice. . . . . . . . . . . . . . . . . . . . . . . . . 38
16 Number of references per code per category. . . . . . . . . . . . . . . . . 42
17 Number of references per code from the Suggestion code. . . . . . . . . . 43
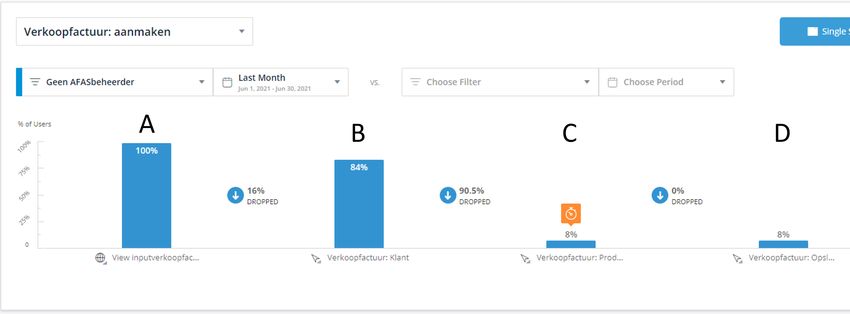
18 Visualisation of the amount of times a navigation path to creating a new
sales invoice was used from June 1 2021 until June 30 2021. . . . . . . . 46
19 Amount of interaction with the buttons: Go to Help, Modify, and Cancel
in the week of 28 June - 4 July. . . . . . . . . . . . . . . . . . . . . . . . 47
20 Funnel for creating a sales invoice. . . . . . . . . . . . . . . . . . . . . . 48
21 UML Activity diagram of creating and sending a sales invoice in Focus. . 61
22 UML Activity diagram detail of ’enter information’ in Figure 21. . . . . . 62
23 Home screen of Focus (demo environment). . . . . . . . . . . . . . . . . 63
24 Spotlight function of Focus (demo environment). . . . . . . . . . . . . . 63
25 Home screen of Focus with navigation menu on the left side (demo envi-
ronment). . . . . . . . . . . . . . . . . . . . . . . . . . . . . . . . . . . 63
26 Sales invoice page of Focus (demo environment). . . . . . . . . . . . . . 64
6
27   New sales invoice page of Focus (demo environment). . . . . . . . .     .   .   .   64
28   Adding a client to a sales invoice (demo environment). . . . . . . .    .   .   .   64
29   Adding a product to a sales invoice (demo environment). . . . . . .     .   .   .   65
30   Additional options to a product (demo environment). . . . . . . . .     .   .   .   65
31   Different ways to save and send a sales invoice (demo environment).     .   .   .   65
32   A saved sales invoice (demo environment). . . . . . . . . . . . . . .   .   .   .   66
33   A sent sales invoice with PDF preview (demo environment). . . . .       .   .   .   66

                                       7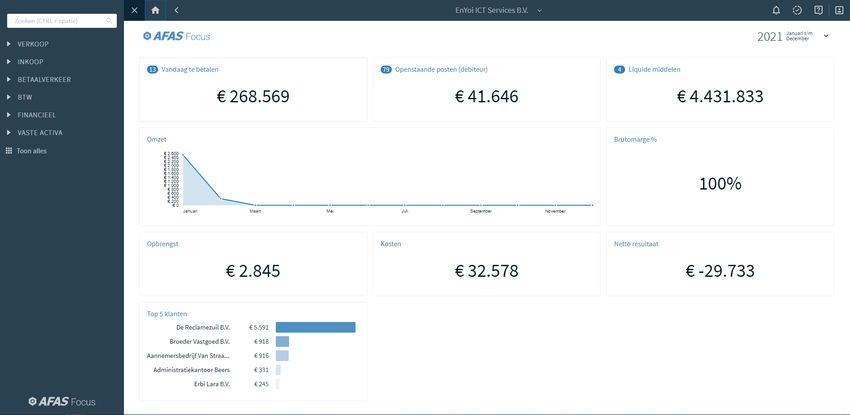
List of Tables

1   Four different ERP products and their different modules. . . . . . . . . .       11

2   10 Usability Heuristics by Nielsen and Usability Heuristics for ERP sys-
    tems by Singh & Wesson. . . . . . . . . . . . . . . . . . . . . . . . . . .      22
3   Values for the example of Pareto optimality. . . . . . . . . . . . . . . . .     28

4   Overview of the codes, their description, and an example of a statement
    made by a participant. . . . . . . . . . . . . . . . . . . . . . . . . . . . .   44
5   SUS scores of the participants. . . . . . . . . . . . . . . . . . . . . . . .    45
6   Average completion between steps of the funnel in Figure 20. . . . . . . .       48

7   Dutch translation of the SUS. . . . . . . . . . . . . . . . . . . . . . . . .    68
8   Dutch translation of the SUS altered. . . . . . . . . . . . . . . . . . . . .    69
9   Original SUS. . . . . . . . . . . . . . . . . . . . . . . . . . . . . . . . .    71

                                        8
1.     Introduction
Enterprise resource planning (ERP) systems are complex systems that are used to manage
business processes in real time. ERP systems can include business processes in areas such
as: financial accounting, human resources, supply chain management, order processing,
and manufacturing. The goal of implementing an ERP system is to increase the efficiency
of these processes by automating processes and having all data in one central database.
However, if the users find the system too difficult to work with or cannot find the function-
alities they need, ERP systems can even decrease the efficiency of the business processes
(Parks, 2012).

ERP systems are typically designed to increase the efficiency of the customer’s business
processes, without keeping the end users in mind (Parks, 2012). The customers of ERP
systems are often not the end users of the system (Arnowitz, Heidelberg, Gray, Arent, &
Dorsch, 2005). Customers are CEOs or managers who decide which product suits their
company best and has the lowest price. The employees who will work with the system on
a day-to-day basis are the end users of the system. Forgetting to include the end user while
designing a system can lead to usability and acceptance problems when implemented in
the company. Evaluating the usability of the system after the implementation can help
to find usability problems as well, which can be changed in the system in later updates
(Arnowitz et al., 2005).

1.1     Definitions

When evaluating usability, it is important to know what definition of usability is used as
there are many formal definitions. A much used definition is the ISO standard 9241-11
(Jokela et al., 2003). The ISO standard definition of usability states: "the extent to which
a product can be used by specified users to achieve specified goals with effectiveness,
efficiency and satisfaction in a specified context of use" (Jokela et al., 2003, p.54). This
definition shows that usability contains many different attributes that all need to be evalu-
ated to determine what the quality of the usability of a system is. For each attribute of this
definition there are several existing evaluation methods. All methods chosen should not
only be able to evaluate the usability well, they should also suit the system, the situation,
and environment in which the evaluation takes place.

In order to evaluate the usability of systems, usability evaluation methods (UEMs) can be
used. Depending on the usability evaluation method used, the type of data produced can

                                              9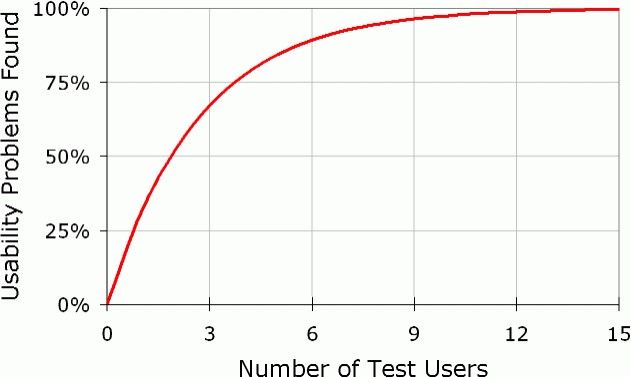
differ greatly. The time, effort, and other resources required to invest can vary greatly as
well. Therefore UEMs should be chosen to fit the goal of the study.

When exploring a subject, interviews producing qualitative data can be very valuable.
During an interview, the interviewee can give more insight in what they would expect
from a system and what they would like or dislike. This does take a lot of time, but the
data is very valuable. When evaluating how satisfied users are in general with a system, a
questionnaire that produces quantitative data can be used. Answers to a questionnaire can
be easily converted into numbers which can show an average score of satisfaction. This
is a way to quickly collect data from many people. However, there is no way of knowing
the reason why the users are satisfied with a system or not.

Other aspects related to the usability of ERP systems are learnability (Umble, Haft, &
Umble, 2003), navigation (Wong, Veneziano, & Mahmud, 2016), feedback (Topi, Lu-
cas, & Babaian, 2005), and documentation (Scott, 2008). Learnability is an attribute that
occurs in many different definitions of usability (Dubey & Rana, 2010). Learnability in-
dicates how easily a user can learn to work proficiently with the system (Nielsen, 1993).
Navigation relates to how easily a user can find certain functionalities, not only by mak-
ing the interface easy to work with, also by making sure the functionalities are located
where the user would expect them (Singh & Wesson, 2009). Error messages are another
important aspect in ERP systems. Error messages should be understandable for the user,
so they can recover their mistakes quickly or know who to contact to fix the error (Topi et
al., 2005). Documentation of a system is an important aspect for usability as well. When
a user has some questions about a functionality, the answers should be easy to find in the
documentation. When documentation is perceived as useful and easy to use, users are
often more satisfied with the system itself (Scott, 2008).

1.2     ERP systems

ERP systems can be used by many different types of companies. However, not all compa-
nies have many different business processes or only focus on one type of process, such as
sales or manufacturing. To make ERP systems suitable for each company, ERP systems
are often divided into different modules. This allows the customer to purchase only the
modules they need or when needed all processes can be managed from one application.
Working with one system and database for many different processes can make working
with it easier and more efficient as all modules have the same look and feel (AFAS, 2021).

                                            10
Table 1. Four different ERP products and their different modules.
Products Modules
AFAS Focus Sales1 , Purchasing1 , Taxes, Financial, Payments,
Fixed assets
Exact Online (Exact, 2019) Accounting, Wholesale, Manufacturing, Accoun-
tancy, Time & Billing, Project Management
SAP Business One (SAP, 2020) Financial management, Sales and customer man-
agement, Purchasing and inventory control, Ana-
lytics and reporting, Industry Solutions
Visma Mamut One (Visma, 2016) Financials, Sales Management, CRM, HR, E-
commerce, Purchasing, Management Reports,
Time Management
Table 1 shows four different ERP products and the different modules they contain. These
four ERP system are developed by large ERP software companies and are used by many
different companies. This selection is only a very small fraction of all existing ERP
systems. The products in Table 1 contain mostly the same types of modules, however, all
companies give them slightly different names or have two modules where other companies
have combined these. For example, SAP Business One has a module Sales and customer
management where Visma Mamut One has two modules, one named Sales Management
and one named CRM (Customer Relationship Management).
Figure 1. Home screen of AFAS Focus including the navigation menu (test environment).
Figure 1 shows the home screen of AFAS Focus, an ERP cloud application. The navi-
gation menu shows the different modules and underlying functionalities the application
contains. The home screen contains Key Performance Indicators (KPIs), which allow the
user to quickly see all values and statistics they find important. AFAS Focus will be used
1
These functionalities are still being developed, thus very limited at this point.
11in the use case in this thesis and will be discussed in more detail in Chapter 3.
Figure 2. Home screen of SAP Business One (SAP, 2020).
Figure 3. Home screen of Visma Mamut One (Visma, 2016).
Figures 2, 3, and 4 show the home screen of SAP Business One, Visma Mamut One, and
Exact Online. At a glance all systems look quite similar: the home screens all contain
KPIs or statistics and the navigation menu shows all different modules or functionalities
that can be accessed. The systems by SAP and Visma are desktop applications, their home
screens contain more buttons than the systems by AFAS and Exact. The ERP systems by
AFAS and Exact are both cloud applications that can be accessed via a browser, these
applications have a more simplified user interface (UI) like most websites have. Exact
Online differs from the three other user interfaces regarding the navigation menu, as Ex-
12act Online has a horizontal navigation menu at the top of the page and the other three
interfaces contain a vertical navigation menu on the left side of the screen. The SAP and
Visma applications have a large amount of items in the top layer of the navigation bar.
The AFAS and Exact applications have one menu item per module and all underlying
functionalities of the modules can be found when the module is selected in the menu.
Figure 4. Home screen of Exact Online (Exact, 2019).
1.3 Research Questions
A lot of usability evaluations for ERP systems and other complex systems are conducted
during the design phase. Usability evaluations in the design phase are very important.
However, continuous usability evaluation is important to make sure updates in a system
do not negatively affect the usability for the end users of the system. In company settings,
it is important that the usability test can be performed within a limited time to keep up
with frequent software updates. Keeping track of how the current version of the system
is used can also give insight in what functionalities or parts of the interface might have to
be evaluated again. This leads to the following research questions.
RQ1: Which software usability evaluation methods can be used to perform usability tests
in a company setting where the said software is updated regularly?
RQ1a: What types of usability evaluation methods have been used successfully in prior
usability studies of ERP systems?
RQ1b: What evaluation and visualisation approaches can be used to measure improve-
ments in software usability?
13RQ2: Which user evaluation dimensions are more important for an ERP software, and
what are the minimum requirements for each of these dimensions?
RQ2a: Can the existing system logs be used to successfully identify usability problems
in ERP systems?
RQ2b: If needed according to RQ2a, what additional information can be added to the
system logs to successfully identify usability problems?
RQ3: As a use-case, what are the best practices for evaluating AFAS Focus ERP system?
RQ3a: How do we measure the usability dimensions in AFAS Focus?
RQ3b: What kind of data is produced and not produced during the existing usability test
of AFAS Focus?
RQ3c: How can data collection and testing be improved for AFAS Focus?
RQ4: How can the usability of AFAS Focus be improved?
The purpose of RQ1 is to identify which usability methods exist and if they are suitable to
use on an ERP system and in a company setting. The sub questions help break down the
main research question. For sub questions RQ1a and RQ1b, a literature study is needed
to identify existing UEMs and which have been successfully used in usability studies
for ERP systems and which evaluation and visualisation techniques are used to measure
general software usability. For RQ2, the evaluation dimensions or aspects of ERP systems
need to be identified and their importance related to the other dimensions. Additionally
to the dimensions, analysing the system logs might provide more information about the
usability of the system. Sub questions RQ2a and RQ2b are focused on how system logs
can help find usability issues. RQ3 focuses on the use-case of AFAS Focus. The purpose
of RQ3a is to identify how the different dimensions can be measured in AFAS Focus.
RQ3b has to give insight into what data is produced during the existing usability tests and
what data is missing or could be produced. The goal of RQ3c is to find if and how the
existing data collection and testing procedures can be improved for AFAS Focus. Lastly,
the purpose of RQ4 is to recommend changes to Focus based on the results of the usability
tests that have been performed during this research.
In order to answer the research questions an iterative process for the usability testing is
needed. Figure 5 shows a diagram of this process. Before the usability testing can start
14Figure 5. Flowchart of the iterative usability testing process.
is important to prioritise what to test. When a new functionality is released or when a
functionality has changed, it is important to test its effect on the usability. Then test cases
need to be set up to be able to consistently test these changes in the software. Thirdly, the
usability test with these test cases need to be performed to gather data. Then this data will
be analysed. Lastly, interpretation of the analysed data takes place to decide what (parts
of) functionalities are good and which need to be improved.
1.4 Organisation of the Thesis
To be able to answer the research questions, first a literature study will be done to gather
information about usability in ERP systems and what usability evaluation method exist.
Chapter 3 will explain how AFAS Focus works and how its usability is tested. In Chapter 4
the method used to evaluate Focus will be explained. In Chapter 5 the results of the study
will be discussed. Chapter 6 will contain the discussion and limitations. At last, Chapter
7 will contain the conclusion and possible future work.
152. Literature Review
2.1 Software Usability
Usability is an important aspect for the success of software or a website (Nielsen, 2012).
When the usability of a website is low and users are not able to find the information they
expect to be present in a system or cannot find the information where they expect it to
be, they will leave. Regarding software that should increase the productivity of users, bad
usability will decrease the productivity as users will spend too much time looking for the
right information or functionalities instead of getting their work done (Nielsen, 1993).
Usability has been defined many times, each time comprised of somewhat different at-
tributes. In a study by Dubey and Rana (2010), 37 formal definitions with a total of 152
attributes of usability were analysed. This lead to a frequency table with 22 attributes
and a category ’others’ for 24 attributes that only occurred once. The six most occurring
attributes are learnability, satisfaction, flexibility, efficiency, effectiveness, and memora-
bility. There is not one definition that contains all these attributes. When evaluating the
usability of a system, it is important to use a definition of usability that contains the at-
tributes most important for that type of system.
A well known definition of usability is the definition from Nielsen (1993). This definition
contains the following attributes: learnability, efficiency, memorability, few errors, and
satisfaction.
The attribute learnability is about how easy it is for the end user to learn how to work
with the system. Clear navigation or a well documented help page could improve this
for example. However, the mental model of the end user should be kept in mind when
designing for good learnability. Each user creates a mental model throughout their life
while working with different systems. This mental model influences how quickly a new
system can be learnt. A new system, that has very good usability in theory, can still be
difficult to learn for an end user when it deviates from their mental model (Van Der Veer
& del Carmen Puerta Melguizo, 2002).
Once the user has learned to work with the system, it is important that they can work effi-
ciently with they system. Efficiency is about how quickly certain tasks can be performed
by the user. Good learnability also attributes to the efficiency. If a user is able to quickly
learn to work with a system, efficiency can be achieved quicker.
16Memorability refers to how quickly a user is able to go back to working proficiently with
the system after a long period of not working with the system.
Few errors is not solely about the amount of errors a user makes, the severity of the errors
and how well the user is able to recover from these errors are included in this attribute as
well. Finally, satisfaction refers to how much users enjoy working with the system.
Another well known definition is the ISO standard definition of usability: "the extent to
which a product can be used by specified users to achieve specified goals with effective-
ness, efficiency and satisfaction in a specified context of use" (Jokela et al., 2003, p.54).
In the ISO standard definition, effectiveness is the accuracy and completeness with which
the user is able to complete tasks (Jokela et al., 2003). Effectiveness is closely related to
the few errors attribute used in Nielsen’s definition.
The efficiency is the expanded resources in relation to the effectiveness when it comes to
completing the user’s goals (Jokela et al., 2003). Meaning how much effort and time is
spent reaching effectiveness.
The context of use refers to the characteristics of the users, tasks and also to the organ-
isational and physical environment (Jokela et al., 2003). The characteristics of the users
can range from the type of domain knowledge they have, their age or limitations they
might have such as (colour) blindness or other physical disabilities. The organisational
and physical environment relate to where the system is used, for example in an office on
a desktop or at an external location on a mobile device.
The definitions from Nielsen and the ISO standard are both widely used. However, they do
differ in what attributes they are comprised of and even the meaning of attributes with the
same name are not completely similar. Nielsen’s definition of usability does contain more
attributes than the ISO standard definition, but the ISO definition includes the context in
which a product is used. Especially when studying usability in complex systems, it is
important to include the context in which the system is used. The usability is dependent
on the type of tasks the user has to perform and in what kind of environment the system
is used (Xu & Topi, 2017). Additionally, the type of device the user uses should be taken
into account.
172.2 Usability Evaluation Methods
To be able to tell to what extend the usability of a system can the increased, the us-
ability needs to be evaluated first. A system can be evaluated by both experts and end
users. Expert usability evaluations are a very time efficient and cost-effective way to find
a large amount of usability problems (Nielsen, 1994b). Expert evaluations can be used
throughout the whole design process without having to recruit many participants, which
will result in more resources for user testing with end users towards the end of the de-
sign process. However, this can lead to a design that is good in theory, but not what end
users find pleasant to work with (Van Der Veer & del Carmen Puerta Melguizo, 2002).
Usability tests using end users will most likely reveal smaller usability problems (Yen &
Bakken, 2009). As the end users are much more familiar with the context the product is
used in than experts, they will be able to find usability problems related to the context.
A combination of expert and end user usability evaluation should be able to reveal the
majority of usability problems.
Research by Nielsen and Landauer (1993) has shown that user tests with only five different
participants can already point out 80% of the usability problems. Figure 6 shows that each
new participant will provide fewer new insights on usability problems in a system. This
means that using only five participants per usability test can help find the majority of the
usability issues while using limited resources for recruiting participants.
Figure 6. Graph showing that each additional user provides less new usability problems
(Nielsen, 2000).
Usability evaluation methods can contain subjective and objective usability measures.
Subjective measures help find the users’ preferences and what they think of a product.
Objective measures determine the users’ capability to work with the system. Subjective
18and objective measures can also be seen as the users’ preferences and performance, re-
spectively (Nielsen & Levy, 1994). The type of data that can be collected during user
tests can be quantitative or qualitative. Quantitative data is often used to test hypotheses
and can be used to calculate the power of a research. Qualitative data can describe new
phenomena or explain why certain aspects are good or bad in an interface (Blandford,
Furniss, & Makri, 2016). Often studies combine both qualitative and quantitative data.
Qualitative data can help explain the quantitative data.
Fernandez, Insfran, and Abrahão (2011) have categorised usability evaluation methods
(UEMs) for the web in the following five categories: user testing, inspection methods,
inquiry methods, analytical modelling, and simulation methods. The first three categories
require end users or experts to use a system or voice their opinions or wishes about a
system. Analytical modelling and simulation methods are more theoretical approaches to
model or predict any usability problems.
2.2.1 User Testing
User testing requires participants from the target group to perform certain tasks using the
system. This is often done in a controlled lab environment, but remote user testing is
possible as well. Especially during the Covid-19 pandemic, remote user testing is very
valuable. During user tests, both subjective and objective data can be collected. Subjective
data can be collected, for example, using the thinking out loud method. This method
requires the participant to say everything they think about or see when performing a task.
This can give information about what they are looking for, what they miss in a system
or how they would expect the system to work if it is not working as expected. While
collecting subjective data during a user test, it is important that the moderator of the user
test avoids any probing and leading questions (Molich et al., 2020).
Hertzum (2016) has stated that a user test is not an interview. This statement means that
a user test should be used to evaluate the user’s behaviour while using the system. Some
conversation during the user test can help to make sure the participant stays within the
scope of the research and to take away any unclarities to the participant. Objective data
consists of a large range of measures, such as error rate or the time it takes to complete a
certain task. Eye tracking can also be used to collect data about where the participant is
looking in the system or how long they look at certain objects.
Measuring error rate is important to find how many errors are made and where in the
system. This is not only important to be able to improve the productivity of the user. A
high error rate of users can lead to a lower satisfaction when working with the system
19(Nielsen & Levy, 1994). Additional to error rate, it is important to know how easily and
quickly a user can recover the error in their task (Nielsen, 2012).
Task completion time can tell much about the efficiency of the system. When a user is
able to complete tasks within the system quickly and without any errors, they are able
to work efficiently with it. However, not all people work quickly when using a com-
puter. Sonderegger, Schmutz, and Sauer (2016) have found that efficiency is lower for
older adults (52-79 years old) than for younger adults (19-29 year old). The effectiveness
between age groups did not differ, meaning there was no difference in the amount of er-
ror they made while performing the tasks. This shows that task completion time is also
dependent on the user’s age and how well they are able to operate a computer.
When user tests are performed remotely they can easily be recorded without it being ob-
trusive for the user as they already have their webcam and microphone on to communicate
with the moderator of the user test. These recordings can be used to code the user’s be-
haviour or suggestions (Blandford et al., 2016). The annotations from different user tests
can give a quick overview of what aspects of the system can be improved or should stay
as they are. The grounded theory approach is often used when systematic coding of data
takes place during a study (Blandford et al., 2016). Three different types of coding can
help create a theory or themes from the data: open coding, axial coding, and selective
coding (Williams & Moser, 2019). During the open coding phase, codes are being cre-
ated while going through the data. During this phase, the data is explored to find what
kind of concepts, behaviours, and other remarkable things are being said or done. During
the axial coding phase, the researcher begins to look at relationships between the codes
created in the open coding phase (Muller & Kogan, 2010). These can be categories of
concepts or grouping behaviours by valence. During the selective coding phase the most
important axial codes are selected. In usability research these codes can give insight in
what parts of an system might need improving and which parts should stay as they are.
Eye tracking can be used to evaluate the user’s visual attention to different elements in an
interface (Wang et al., 2019). For websites eye tracking is often used to find if the naviga-
tion of the website is good, a heat map of the gaze can show where people look to search
certain elements (Wulff, 2007). The use of eye tracking in usability testing of complex
systems, such as a maritime navigation system, has shown to help identify usability prob-
lems in the interface (Hareide & Ostnes, 2018). The quantitative data collected during an
eye tracking study can be used to support qualitative data that has been collected using
other UEMs (Hareide & Ostnes, 2018). Eye tracking is not only used to track where the
user is looking, the time between fixations, saccades, can give insight in the complexity of
an interface. Saccades that go back to what a user has already read or fixated on before can
20be an indication of confusion, especially when this happens often or lasts for a long time
(Poole & Ball, 2006). Eye tracking does require more time to set up than a regular user
test. The eye tracker needs to be calibrated for each user and the user should move as little
as possible to make sure the collected data is reliable. Another downside of eye tracking
is that it can be less reliable when the participant has droopy eyelids, wears glasses, or
contact lenses (Nyström, Andersson, Holmqvist, & Van De Weijer, 2013). When the tar-
get group of a system is diverse, the user tests should also be suitable to different kinds of
people. As ERP software is used by all types of people, eye tracking might cause a part
of the target group to be excluded from the usability testing.
To make user testing less time consuming and expensive, usability testing can also be
automated by tracking the user’s behaviour in the system (Au, Baker, Warren, & Dobbie,
2008). Analysing the logs of a user’s action can show what kind of action sequences the
user performs and how the user navigates through the system (Au et al., 2008). Logs
of both user tests and real time use can be analysed to find usability issues (Ferre, Vil-
lalba, Julio, & Zhu, 2017). Some easy to log actions such as current page and keystrokes
might not be very easy to interpret. Other actions that might be much more valuable
such as task completion might be more difficult to directly log (Ivory & Hearst, 2001).
Automated usability testing using the system logs might be very useful when comparing
different interfaces, for example during A/B-testing. However, qualitative data is missing
when using this approach (Ivory & Hearst, 2001). Tiedtke, Märtin, and Gerth (2002) have
developed an approach for automated usability testing using systems logs, the AWUSA
- Automated Website Usability Analyzer, which is focused on websites. However, the
goals of the approach can also be useful for complex systems. The goals of the AWUSA
approach are to: find and visualise users´ paths on the website, find and visualise devia-
tions between intended tasks and actual usage, find and visualise locations/events where
tasks are cancelled prematurely, find and visualise areas and situations with poor usability,
provide plausible reasons for detected usability problems, find new goals/tasks of users
while touring the website, and classification of different user groups and their mapping to
the various tasks/goals (Tiedtke et al., 2002). Especially finding the users’ paths, finding
deviations, and finding areas and situations with poor usability can be very valuable for
complex systems such as ERP software. Knowing how the user navigates through the
system can give insight whether or not the user navigates through system efficiently and
as intended by the designers. When a user performs tasks differently than expected the
deviations with the intended process can show where exactly the interface or functionality
should be changed.
21Table 2. 10 Usability Heuristics by Nielsen and Usability Heuristics for ERP systems by
Singh & Wesson.
10 Usability Heuristics (Nielsen, 1994a) Usability Heuristics for ERP system
(Singh & Wesson, 2009)
Visibility of system status Navigation and Access to information
Match between system and the real world
User control and freedom Presentation of Screen and Output
Consistency and standards
Error prevention Appropriateness of Task Support
Recognition rather than recall
Flexibility and efficiency of use Degree of ease to learn how to use the sys-
tem effectively
Aesthetic and minimalist design
Help users recognise, diagnose and re- Ease of customising the system to ensure
cover alignment between the system, the user,
and business process
Help and documentation
2.2.2 Usability Inspection Methods
Usability inspection methods are methods that require someone, often an expert, to eval-
uate an interface (Nielsen, 1994b). These methods can be used throughout the whole
design process as they require little time and resources. There are many different types
of inspection methods. Well known inspection methods being: heuristic evaluation and
cognitive walkthrough.
Singh and Wesson (2009) have identified usability evaluation criteria for ERP systems.
The criteria are navigation, presentation, task support, learnability, and customisation. A
set of heuristics was created based on these criteria. During a case study on an ERP sys-
tem the heuristics showed to be very useful for identifying problems related to navigation
such as being able to find certain information and functionalities quickly and efficiently.
However, when compared to Nielsen’s (1994a) 10 Usability Heuristics, usability prob-
lems related to error recovery and prevention were found. This research shows that using
only one of these heuristics to evaluate a system could cause missing one or more very
important usability problems. Another shortcoming of using heuristic evaluation is that
the usability expert might not have sufficient knowledge about the domain of the sys-
tem which could lead to major usability problems to be left undiscovered. For example,
functionalities being placed in the system where an end user would not expect them. Ad-
ditional to this, a usability expert might have a different mental model when it comes to
these kind of systems than the end users, which too could lead to undiscovered usability
problems, such as the systems navigation being so different than other ERP systems that
22end users are not able to navigate proficiently through the system.
During a cognitive walkthrough, the evaluator has to go through a system and perform
specific tasks. The evaluator performs the tasks from the perspective of the user (Polson,
Lewis, Rieman, & Wharton, 1992). This approach is focused on understanding the learn-
ability of a system. Cognitive walkthroughs are often used for walk-up-and-use sys-
tems, such as ATMs or train ticket machines. These systems are difficult to develop as
users have to be able to understand the system immediately without any prior knowledge
(Polson et al., 1992). For complex systems, a cognitive walkthrough can be used to go
through possible problem solving strategies a user might have.
2.2.3 Inquiry Methods
Inquiry methods are used to collect subjective information from the user, such as inter-
views, focus groups, and questionnaires (Fernandez et al., 2011). Interviews and focus
groups allow for more flexibility in retrieving information (Helander, 2014). Follow up
questions can be asked when an answer of a participant is not completely clear or when
talking about a problem. Participants can be asked to provide a solution as well, giving
the researcher more insight in what users would want to see. Both interviews and fo-
cus groups can produce a large amount of valuable information using a relatively small
amount of participants, however, a lot of time and resources are often needed for this
approach. During interviews there is also a chance that the interviewer unintentionally
steers the interviewee towards certain answers or that the interviewee does not want to
sound too negative and is not completely honest. When interviewed about the usability of
a product it could lead to not all usability problems being discovered.
Questionnaires can be used to gather information from a large group of users, however the
information is less detailed than from interviews. Questionnaires often take little time to
fill in and participants are more likely to be honest as they are often anonymous. Having
many participants filling in a questionnaire can show how many people experience certain
usability problems. This can give insight in which problems are important and which
will affect less people. Many usability related questionnaires have been developed and
validated. Three well known questionnaires related to software usability are the User
Engagement Scale (UES), the System Usability Scale (SUS) (Brooke, 1996) (O’Brien,
Cairns, & Hall, 2018), and the NASA task load index (NASA-TLX) (Hart & Staveland,
1988). The UES is able to measure the user’s engagement with a system using either the
full length questionnaire comprised of 30 questions or a short form version containing 12
questions. The long and short form UES should be answered using a 5-point Likert scale.
23The SUS contains 10 general questions about the usability of a system that can be an-
swered using a 5-point Likert scale (Brooke, 1996). The system usability scale can be
used to measure the user’s perceived usability (Lewis & Sauro, 2017). Compared to five
other usability questionnaires the SUS has been proven to be very accurate for evaluating
website usability, when a sample size of 12 or more participants is used (Tullis & Stet-
son, 2004). The SUS has been developed in English, however, the questionnaire can be
difficult to understand for non-native English speakers (Finstad, 2006). This has lead to
many different translations of the SUS, such as a Portuguese (Martins, Rosa, Queirós,
Silva, & Rocha, 2015), Slovene (Blažica & Lewis, 2015), Turkish (Demirkol & Şeneler,
2018), and an Arabic version (AlGhannam, Albustan, Al-Hassan, & Albustan, 2018). All
translations have been validated by being translated from and back to English by differ-
ent translators. A Dutch version of the SUS can be found on the website of UserSense
(UserSense, 2020), a company that does user tests for other companies. The SUS will
result in a score from 0 to 100. Figure 7 gives insight in what a good SUS score is and
how it can be compared to different scoring types (Bangor, Kortum, & Miller, 2009).
Figure 7. A comparison of the adjective ratings, acceptability scores, and school grading
scales in relation to the average SUS score (Bangor et al., 2009).
The NASA-TLX measures the task load of a user and the type of task load the user
experiences (Hart & Staveland, 1988). The NASA-TLX consists of six different kinds of
task load: mental demand, physical demand, temporal demand, performance, effort, and
frustration. By using these different dimensions the NASA-TLX can give insight what
aspect of a task is the most demanding for users. Only a high mental task load would be
acceptable for complex systems such as ERP systems, however, frustration or physical
task load should be avoided as these factors can be an indicator of a bad interface.
When using a questionnaire to evaluate the usability of a system it is important to use
a validated questionnaire, as this will result in reliable results. However, the results will
only be reliable when the questionnaire is used precisely as intended and conducted within
the domain they are developed for (O’Brien et al., 2018).
242.3 Usability Guidelines for ERP Systems
Many different studies show different guidelines or find different aspects that are impor-
tant to keep in mind when you want to design an ERP system that is successful and usable.
A review of several ERP usability studies by Parks (2012) shows that the most impor-
tant aspects of an ERP system are: satisfaction, ease of use, usefulness, and acceptance.
These aspects are mainly based on the user’s perspective of the systems usability. Singh
and Wesson (2009) have identified five criteria for ERP usability: navigation, learnability,
task support, presentation (input and output), and customisation. In contrast to the gen-
eral aspects regarding usability found by Parks (2012), the criteria by Singh and Wesson
(2009) are different aspects of usability that can be evaluated separately.
2.3.1 Navigation
Navigation within an ERP system has been identified as one of the main usability prob-
lems in ERP systems (Wong et al., 2016). Navigation is strongly related to disorientation,
engagement, and performance while using a website (Webster & Ahuja, 2006). While
websites can not always be compared directly to complex systems, disorientation within
a system is never desirable. By using a breadcrumb trail the user always knows where
they are located in the system (Rogers & Chaparro, 2003). A breadcrumb trail can show
the systems structure by showing a path that can lead to the page the user is currently us-
ing. Research by Webster and Ahuja (2006) has shown that following design guidelines is
not always beneficial for the usability, making sure the user understands the structure of a
website can help them navigate better than a menu that follows all guidelines. Matthews
(2008) has suggested that navigation in ERP systems should be intuitive and simplified to
the level end users have experienced using web navigation. Designing a system that cor-
responds with the user’s mental model can make the user’s navigation through the system
easier.
2.3.2 Learnability
A study by Umble et al. (2003) shows that the lack of training of the end users is one of
the reasons the implementation of an ERP system can fail. However, the usability of the
system is not mentioned as a way to make implementation of a system more successful.
Even though training is important for being able to work with a complex system, it should
be designed in a way it is easy to learn.
Research by Grossman, Fitzmaurice, and Attar (2009) resulted in guidelines for the learn-
25ability of software in general. The key aspects to keep in mind when designing to facil-
itate high learnability are: task flow, awareness, locating, understanding, and transitions.
Task flow relates to the users’ understanding of how they should perform a task. When
documentation is needed to execute the task, they should know what queries to use. A
user’s awareness of what functionalities are present in the system is important as well, the
interface should be designed in a way that functionalities can be found easily, for exam-
ple shortcuts are presented to the user when performing a task without using an existing
shortcut. Documentation for locating functionalities should not be static, but it should be
related to what the user interface looks like at the moment. Understanding how to use
complex functionalities is important and can be supported by using demonstrations, for
example using multimedia content in the documentation that demonstrates how a certain
task is executed. At last the user’s transition to start using more complex functionalities,
that allow for optimal usage of the system, should be encouraged, by gradually exposing
the user to more advanced functionalities (Grossman et al., 2009). Transition would not
be a desirable aspect for an ERP system. All functionalities should initially be present.
Basic training for the users of an ERP system should make sure they know of all func-
tionalities and how to work with them. The other aspects mentioned by Grossman et al.
(2009) might be useful for the users to quickly become proficient at working with the
system.
2.3.3 Error Messages
Another important aspect to increase the usability of ERP systems is to have clear error
messages or feedback when something has gone wrong. Generic error messages do not
help the user and will only cause the user to spend a lot of time figuring out what has
caused the error message (Topi et al., 2005). Unclear error messages do not only influence
the time spent performing a task, they also cause the end user to be frustrated (Ceaparu,
Lazar, Bessiere, Robinson, & Shneiderman, 2004). The language used for error messages
should be understandable for the user, technical information often confuses and frustrates
the user more (Ceaparu et al., 2004).
2.3.4 Documentation
Perceived usefulness and usability of the documentation also plays a large role in the
acceptance of ERP software. A positive attitude towards the documentation often leads to
a higher satisfaction of the system itself (Scott, 2008). However, a large problem is that
users prefer asking help from another person than reading the help (Scott, 2008; Rettig,
1991). The documentation might also still be difficult to understand for end users, as the
26writers of the documentation are often the developers of the product and not actual writers
(Rettig, 1991). Having dedicated writers for the documentation that have not been active
in the development of the product might help improve the usability of the documentation.
2.3.5 Balance between all aspects
All aspects discussed above are important for the usability of ERP systems. However,
it is important to find the right balance between these aspects. Increasing one of these
aspects might have a negative influence on another aspects, which should be avoided.
During the improvement of the system there will be a point where Pareto optimality will
be reached and no improvements can be made without making something else worse
(Pardalos, Migdalas, & Pitsoulis, 2008). Figure 8 shows an example of how three different
versions of a product, with different scores for the aspects of usability, all have reached
Pareto optimality when they are the starting point. For example version B scores higher
on ’Ease of use’ than version A, but on ’Error messages’ version B scores lower than
version A. This shows that the better ease of use has compromised the quality of the error
messages.
Figure 8. Spider chart showing an example of different Pareto optimalities.
As all the aspects influence other aspects of usability, it is important to be able to mea-
sure the effect of each aspect separately. Only by keeping track of each of these aspects
separately, a Pareto optimality can be achieved. Only changes that do not negatively in-
fluence other aspects can be implemented. However, there might be cases where a certain
aspect is too important not to improve, even though it compromises the quality of another
aspect. For example, making the navigation much more clear and intuitive for the user,
27which leads to the user having to click one or two time more than before. This might
compromises the ease of use slightly, but it can lead to the users being able to work much
more quickly and efficient than before.
Table 3. Values for the example of Pareto optimality.
Aspects of usability Version A Version B Version C
Ease of use 40 50 50
Satisfaction 50 40 30
Learnability 40 40 30
Navigation 50 50 40
Error messages 30 20 50
Documentation 20 30 40
283. Case Study: The Focus ERP System of AFAS
Software
3.1 Architecture of Focus
Focus is an ERP cloud application that can be customised for each organisation. Onto-
logical enterprise models (OEMs) created by enterprise modellers describe enterprises as
they are in real-life, using the enterprise’s terminology. The OEM prescribes a customised
application for the enterprise (Van Der Schuur et al., 2017). Figure 9 shows the interac-
tion between the OEM, the application, and the enterprise modeller. Focus is a web-based
application, which makes it accessible from any device such as a laptop, tablet, or smart-
phone.
Figure 9. Focus software generation approach (Van Der Schuur et al., 2017).
Figure 10 shows that the model of Focus is passed through a code generator which results
in an application. Each company has their own environment of the application to ensure
they can work with their own data. The model is divided in work fields. Each work field
has different objects that need to be modelled. For the work field sales the objects include
a sales invoice, sales products, and customers.
Figure 11 shows how a sales invoice in the work field sales is modelled. A sales invoice
has a party, which is the customer. A sales invoice can only exist for one customer, a
custom can have several different sales invoices. The customer can either be a person or
an organisation. A sales invoice can contain one or more products and products can be
29Figure 10. Model to application.
present in more than one sales invoices. A product can either be a good or a service.
In general, a work field is displayed in the navigation menu as a menu item (see Figure
12), when the user clicks on a menu item a sub menu will appear containing the objects
within the work field (see Figure 13).
Figure 11. Model of a sales invoice in the sales work field.
Appendix A contains a UML activity diagram (Figure 21) of how a sales invoice is cre-
ated. The screenshots (Figures 23 - 33) below the diagram show what the system looks
like during the different steps of the diagram. The diagram shows two different ways
to navigate to the page where a new sales invoice can be created, one using the spot-
light function and one using the navigation menu. The spotlight function can be used
to directly navigate to every functionality or certain records such as clients. When the
client has arrived on the new sales invoice page they can enter the needed information and
choose several options: save, save and send, and cancel. When a user has forgotten fill in
a field or has entered an invalid value they will get an error message saying not all fields
30are filled in correctly. When everything is entered correctly the user can save and send the
sales invoice or click send and then send the invoice on the next page.
Currently Focus is still in development, which means that not all functionalities most
ERP systems have are implemented. It will gradually be expanded. New functionalities
and designs are often implemented in the system within a couple of weeks. UX tests for
these new designs should be set up and performed quickly to make sure no large usability
problems are present in a new version of the software.
Figure 12. Navigation menu showing Figure 13. Navigation menu showing
the work fields. the work fields and their objects.
3.2 Existing solutions for usability testing of Focus
The usability of Focus is evaluated by letting clients perform tasks while thinking out
loud. The tasks they perform during the user test depend on what they use Focus or
another ERP system for. Participants will not be asked to perform a task they never do
31during their work. Both existing clients of Focus and future clients perform the user tests.
This allows to find more in depth usability problems from clients who are using the system
daily and how intuitive the system is to use for future clients. The user is asked additional
questions about what they think of the product and what they would improve and how. As
the evaluations are currently done remotely, both the user and their screen are recorded.
Designers and developers of Focus can watch the videos of the user test and comment
on what should be changed in the product based on the user’s remarks and behaviour.
In general, five users will perform the same task during the usability tests. Research by
Nielsen and Landauer (1993) has shown that five usability tests are sufficient to find most
usability problems. It is important to know if certain problems are experienced by more
users or by only one. Usability problems experienced by more people will be prioritised.
However, in case only one person struggles with a certain task, this is still analysed and
changed if the developers and/or the designers think it will be valuable to improve.
The user tests are based on new functionalities and changes in the UI. When a new func-
tionality is released, participants will be asked to perform a task using this functionality.
Changes in the UI are tested in a similar way, functionalities where the changes in the UI
are present will be tested. Creating personas to help design the user test has been done
in the past. However, it took a lot of time and it did not help create better user tests.
Eye tracking has also been used in the past. However, no comprehensive analysis was
performed on the data making it difficult to interpret the data. New things are constantly
tried for the user tests. What works stays and what did not work well will not be used
again. However, it is difficult to precisely see what has been tried and why is not be-
ing used anymore. While automating processes is important to AFAS, the approach to
usability testing contains very little automation.
At the moment of writing this thesis, Focus has three accounting firms as customers and
around 50 end users. Both employees of the accounting firms and their clients are the end
users of Focus. Due to the small amount of users the support department is able to handle
the contact with the end users through a teams chat per accountancy firm. The users are
able to contact the support team when they run into problems when using the software.
The support team is in close contact with the developers and designers to make sure bugs
and other unclarities in the software can be addressed quickly.
Going through the messages from a period of roughly one and a half month, showed
that most questions are related to bugs in the application. Besides these questions, two
remarkable problems showed up. First, people do not use the documentation and directly
ask someone when they cannot find the solution for their problem. As the developers do
know where it can be found in the documentation they often answer the question with
32You can also read