Updated estimation of forest biomass carbon pools in China, 1977-2018
←
→
Page content transcription
If your browser does not render page correctly, please read the page content below
Research article
Biogeosciences, 19, 2989–2999, 2022
https://doi.org/10.5194/bg-19-2989-2022
© Author(s) 2022. This work is distributed under
the Creative Commons Attribution 4.0 License.

Updated estimation of forest biomass carbon pools
in China, 1977–2018
Chen Yang1 , Yue Shi2 , Wenjuan Sun2 , Jiangling Zhu1 , Chengjun Ji1 , Yuhao Feng1 , Suhui Ma1 , Zhaodi Guo3 , and
Jingyun Fang1
1 Institute
          of Ecology, College of Urban and Environmental Sciences, and Key Laboratory for Earth Surface Processes of the
Ministry of Education, Peking University, Beijing, 100871, China
2 State Key Laboratory of Vegetation and Environmental Change, Institute of Botany,

Chinese Academy of Sciences, Beijing, China
3 National Satellite Meteorological Center, China Meteorological Administration, University of Chinese Academy of

Sciences, Beijing, China

Correspondence: Jingyun Fang (jyfang@urban.pku.edu.cn)

Received: 17 January 2022 – Discussion started: 4 February 2022
Revised: 9 May 2022 – Accepted: 30 May 2022 – Published: 21 June 2022

Abstract. China is one of the major forest countries in the     1   Introduction
world, and the accurate estimation of its forest biomass car-
bon (C) pool is critical for evaluating the country’s C bud-
get and ecosystem services of forests. Although several stud-   Terrestrial ecosystems’ carbon (C) sinks, which absorb ap-
ies have estimated China’s forest biomass using national for-   proximately 30 % of annual anthropogenic carbon dioxide
est inventory data, most of them were limited to the period     (CO2 ) emissions, are mostly contributed by forests (Pan et
of 2004–2008. In this study, we extended our estimation         al., 2011; Terrer et al., 2021). Globally, forests cover ∼ 30 %
to the most recent period of 2014–2018. Using datasets of       of the land area (Fahey et al., 2010; Guo et al., 2013) and se-
eight inventory periods from 1977 to 2018 and the continu-      quester large amounts of C in woody biomass and soils (Pugh
ous biomass expansion factor method, we estimated that the      et al., 2019). Even small changes in the forest C pool could
total biomass C pool and average biomass C density in Chi-      induce profound feedback on the climate system of the planet
nese forests increased from 4717 Tg C (1 Tg = 1012 g) in the    (He, 2012). Thus, forests play fundamental roles in regulat-
period of 1977–1981 to 7975 Tg C in the period of 2014–         ing the global C balance and mitigating climate change (Pan
2018 and 38.2 Mg C ha−1 to 45.8 Mg C ha−1 (1 Mg = 106 g),       et al., 2011; Harris et al., 2021).
respectively, with a net increase of 3258 Tg C and an annual       China has a forest area of 220 Mha, accounting for 5.51 %
sink of 88.0 Tg C yr−1 . Over the most recent 10 years (2009–   of the global total forest and ranking fifth among countries
2018), the average national forest biomass C density and C      (FAO, 2021). The forests in China are distributed over a wide
sink were 44.6 Mg C ha−1 and 154.8 Tg C yr−1 , respectively,    range of climatic conditions and are diverse in forest types,
much larger than those of 39.6 Mg C ha−1 and 63.3 Tg C yr−1     which makes them unique for forest C cycle research (Fang
in the period 1977–2008. These pronounced increases were        et al., 2010). Meanwhile, China’s forests, especially planted
largely attributed to afforestation practices, forest growth,   forests, are generally young, with low biomass C density, im-
and environmental changes. Our results have documented the      plying a great C sequestration potential in the future (Xu et
importance of ecological restoration practices, provided an     al., 2010; Zhao et al., 2019). In 2020, the Chinese govern-
essential basis for assessing ecosystem services, and helped    ment announced the goal to achieve C neutrality by 2060, for
to achieve China’s C neutrality target.                         which sequestering more C through forest C sinks has been
                                                                regarded as an essential part of China’s action plans (Yu et al.,
                                                                2021). Therefore, accurate estimates of the forest biomass C
                                                                pool and sink capacity are crucial for China’s aim of reducing

Published by Copernicus Publications on behalf of the European Geosciences Union.
2990 C. Yang et al.: Updated estimation of forest biomass carbon pools in China
net greenhouse gas emissions (Xu et al., 2010) and reaching 2 Methods
national C neutrality.
However, there are several limitations in the previous stud- 2.1 Methods for estimation
ies. On the one hand, most of the estimates of China’s forest
biomass C pool (and the corresponding C sink) were based Mean biomass density (MBD), remote sensing, and BEF are
on the national forest inventory data no later than the 7th Na- three common methods for estimating large-spatial-scale for-
tional Forest Inventory (2004–2008) (e.g. Fang et al., 1996, est biomass C stocks (Guo et al., 2010; Zhang et al., 2013).
2001, 2007; Fang and Chen, 2001; Xu et al., 2010; Guo The MBD method, defined as multiplying the mean biomass
et al., 2013; Zhang et al., 2013; Li et al., 2015; Zhang et density value of each forest type by its area, is widely used
al., 2015). Nevertheless, China’s large-area planted forests to estimate the biomass C stocks at different spatial scales.
formed by extensive afforestation since the 1980s have just However, because of investigators’ intentional tendencies
grown into the rapid-growing middle-aged stage in the most to choose better-growing stands during forest censuses, the
recent decade (2009–2018) (Lu et al., 2018), thus clarifying MBD method usually overestimates the C pool (Fang et al.,
how China’s forest C pool has changed since the 2010s is 2006; Guo et al., 2010). The remote sensing method can
of vital importance to accurately evaluate the C sink formed provide large-scale information of vegetation, while there
by large-scale afforestation. Meanwhile, a 4-decade-long es- are several inherent methodological issues that must be ad-
timate of the forest C pool can also provide necessary infor- dressed, such as atmospheric and background noise, similar
mation for exploring the driving mechanism of China’s for- spectral characteristics of different vegetation, and saturation
est C sink and validating the conclusions from various mod- of signals in dense vegetation (Zhang et al., 2013). Differ-
els. On the other hand, the estimated C pool and/or sinks of ent from the above two methods, the BEF method is based
China’s forest differed considerably among their dedicated on the internal relationship between the biomass and timber
periods. For example, the estimate of the forest C sink dur- volume of forests (Fang et al., 2002). By establishing proper
ing 1994–1998 ranged from −2.9 to 108 Tg C yr−1 (Fang et regression models between biomass and timber volume, the
al., 2007; Zhang et al., 2013; Li et al., 2015; Zhao et al., BEF method can incorporate the effects of forest age, for-
2019). This large discrepancy could be due to limitations est stand density, and forest site quality on biomass density,
in sample size and data representativeness, diversity of data thus achieving appropriate estimates of the forest biomass C
sources, inconsistent biomass–volume fit relationships (Li et pool (Fang et al., 2002; Guo et al., 2010). Thus, the BEF
al., 2015; Tang et al., 2018), or in particular divergences in method has obvious advantages in estimating forest biomass
the methodologies. Therefore, it is necessary to adopt a uni- at regional and national scales (Fang et al., 1998; Fang and
fied and well-validated method to update the estimations of Wang, 2001; Guo et al., 2010; Teobaldelli et al., 2009).
the forest biomass C pool at the national scale over the past Here, we used the continuous BEF method suggested by
4 decades, especially the most recent decade (2009–2018), Fang et al. (2001) to estimate China’s forest biomass C stocks
to fill gaps in our knowledge regarding China’s forest C pool during 1977–2018, which is a well-validated approach that
and its changes. enables upscaling estimates from field plots to a regional
In this study, we used eight national forest inventories level. In this approach, the BEF is calculated by the first-
compiled during the period 1977–2018 and conducted a well- order derivative formula (Eq. 1) using the ground survey data
validated biomass expansion factor (BEF) method to update of forest volume, and then BEF is used to calculate biomass
the estimate of China’s forest biomass C pool. Three major (Eq. 2):
aims of the study are to (1) objectively describe the long-term
BEF = a + b/x, (1)
changes in China’s forest biomass C pool and C sink at the
national scale, especially focusing on the changes in the most y = BEF · V , (2)
recent decade (2009–2018); (2) clarify the contributions of
different forest zonal types, age groups, and forest stand ori- where x and V are the stock volume density and stock vol-
gins to China’s forest biomass C pool and its changes; and ume of a forest type at a certain age in each province, and
(3) qualitatively evaluate the potential influencing factors of a and b are BEF function coefficients. BEF is the biomass
China’s forest C sink by comparing the changes in biomass expansion factor, and y is the biomass of a forest type at a
C stocks in the most recent decade with those in the previous certain age. The coefficients in Eq. (1) were retrieved from
30 years (1977–2008). previous studies (Fang et al., 1998, 2002; Fang and Wang,
2001) (Table S1 in the Supplement). A constant C conver-
sion factor of 0.5 was used to convert biomass into C (Fang
et al., 2001).
Biogeosciences, 19, 2989–2999, 2022 https://doi.org/10.5194/bg-19-2989-2022C. Yang et al.: Updated estimation of forest biomass carbon pools in China 2991
2.2 Data sources Table 1. Forest area, biomass C pool, C density, and C sinks from
1977 to 2018.
Eight national forest inventory datasets compiled by the
Chinese Ministry of Forestry Administration from 1977 to Period Forest parameter
2018 were used in this study. Forests’ dominant tree species, Area C pool C density C sink
area, timber volume, forest age, and stand origins were re- 104 ha Tg C Mg C ha−1 Tg C yr−1
ported for all provinces. According to Fang (2000), five zonal
1977–1981 12 350 4717 38.2
forest types including cold-temperate coniferous, temperate 1984–1988 13 169 4885 37.1 23.9
coniferous, temperate deciduous broad-leaved, temperate– 1989–1993 13 971 5402 38.7 103.5
subtropical mixed, and evergreen broad-leaved are dominant 1994–1998 13 241 5388 40.7 −2.9
tree species. To quantify age-related tree growth, forests were 1999–2003 14 279 5862 41.1 94.9
further divided into five subgroups: young, middle-aged, pre- 2004–2008 15 559 6427 41.3 112.9
mature, mature, and overmature. Forest area and C stocks Average 13 762 5447 39.6 63.3
were calculated for each province. Chongqing Municipality, 1977–2008
which was separated from Sichuan Province in 1997, was 2009–2013 16 349 7074 43.3 129.4
merged into Sichuan here. The detailed data of Taiwan, Hong 2014–2018 17 409 7975 45.8 180.2
Kong, and Macau are missing from the inventory datasets;
Average 16 879 7525 44.6 154.8
thus, the calculations did not account for these three regions.
2009–2018
2.3 Data correction Overall change 5059 3258 7.61 88.0
1977–2018
Since 1994, the canopy coverage criterion of forests in the
national forest inventory has been changed from > 0.3 to >
0.2. We unified the criterion by adopting the power functions
been due to the decrease in the area of natural forest from
(Eqs. 3 and 4) provided by Guo et al. (2013):
1994–1998 (Tables 1 and 2, Fig. 1).
AREA0.2 = 1.290 × AREA0.995 2 The biomass C pools of planted forests and natural
0.3 (R = 0.996), (3)
forests increased significantly during the study periods (Ta-
CARBON0.2 = 1.147 × CARBON0.996
0.3 (R
2
= 0.996), (4) ble 2). The biomass C pool of the planted forest increased
from 250 Tg C in 1977–1981 to 1470 Tg C in 2014–2018.
where AREA0.2 and AREA0.3 are the forest areas (104 ha) This indicated that biomass C sinks had an average in-
with canopy coverages of 0.2 and 0.3, respectively, and crease of 33.0 Tg C yr−1 . The biomass C density of planted
CARBON0.2 and CARBON0.3 are the biomass C pools forests increased from 15.6 Mg C ha−1 during 1977–1981
(Tg C) with crown densities of 0.2 and 0.3, respectively. to 28.3 Mg C ha−1 during 2014–2018. Compared with the
previous 3 decades (1977–2008), the average biomass C
3 Results density and C sink in the most recent decade (2014–
2018) increased by 4.6 Mg C ha−1 and 10.0 Tg C yr−1 , re-
3.1 Forest biomass C pool and its changes spectively. For natural forests, the biomass C pool increased
in most time steps during the study periods. Especially in
The total forest biomass C stock, average biomass C den- the most recent 10 years, the biomass C sink of natural
sity, and biomass C sink during 1977–2008 were 5447 Tg C, forests has grown rapidly, indicating 100.8 Tg C yr−1 dur-
39.6 Mg C ha−1 , and 63.3 Tg C yr−1 , respectively (Table 1). ing 2009–2013 and 128.1 Tg C yr−1 during 2014–2018 (Ta-
The corresponding values were 7525 Tg C, 44.6 Mg C ha−1 , ble 2). Compared with the previous 3 decades (1977–2008),
and 154.8 Tg C yr−1 , respectively, during 2009–2018, mak- the average biomass C density and C sink in the most re-
ing an increasing C sink of 91.5 Tg C yr−1 (Tables 1 and S3). cent decade (2014–2018) increased by 7.8 Mg C ha−1 and
Compared with the forest biomass C pool during 1977–1981, 81.5 Tg C yr−1 , respectively. From 1977 to 2018, the increase
it increased by 3258 Tg C (69.1 %) during the 4 decades up in the biomass C pool of natural forests was 2037 Tg C, indi-
to 2014–2018. The C density of forest biomass increased cating C sinks of 55.1 Tg C yr−1 on average.
by 7.61 Mg C ha−1 (19.9 %) during 1977–2018 (Table 1,
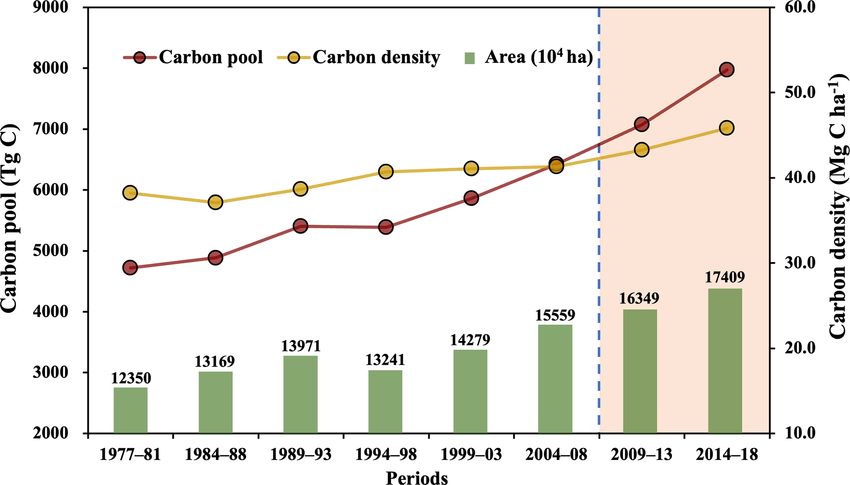
Fig. 1). Meanwhile, the forest area increased by 41.0 % from 3.2 Changes in biomass C pools in different zonal
1.24 × 10⁸ ha during 1977–1981 to 1.74 × 10⁸ ha during forest types
2014–2018 (Table 1). All these changes had led to a large
C sink of 180.2 Tg C yr−1 in 2014–2018 (Table 1, Fig. 1). Compared with 1977–2008, temperate coniferous forest,
In addition, the forest biomass C pool varied considerably temperate deciduous broad-leaved forest, and evergreen
across the different periods. It was found to have decreased broad-leaved forest all presented larger area during 2009–
by 2.9 Tg C yr−1 over 1994–1998, which was thought to have 2018. With the exception of the temperate deciduous broad-
https://doi.org/10.5194/bg-19-2989-2022 Biogeosciences, 19, 2989–2999, 20222992 C. Yang et al.: Updated estimation of forest biomass carbon pools in China
Table 2. Area, biomass C pool, C density, and C sink of planted and natural forests.
Period Planted forest Natural forest
Area C pool C density C sink Area C pool C density C sink
104 ha Tg C Mg C ha−1 Tg C yr−1 104 ha Tg C Mg C ha−1 Tg C yr−1
1977–1981 1595 250 15.6 10 755 4468 41.5
1984–1988 2347 418 17.8 24.1 10 822 4467 41.3 −0.1
1989–1993 2675 526 19.7 21.6 11 296 4876 43.2 81.9
1994–1998 2914 642 22.0 23.3 10 326 4746 46.0 −26.2
1999–2003 3229 836 25.9 38.7 11 049 5026 45.5 56.2
2004–2008 4000 1067 26.7 46.2 11 559 5360 46.4 66.7
Average 2794 623 22.3 30.3 10 968 4824 44.0 33.0
1977–2008
2009–2013 4665 1183 25.4 23.3 11 685 5864 50.2 100.8
2014–2018 5193 1470 28.3 57.3 12 212 6505 53.3 128.1
Average 4931 1327 26.9 40.3 11 948 6185 51.8 114.5
2009–2018
Overall change 33.0 55.1
1977–2018
about the area, C pool, C density, and C sinks between 1977
and 2018, please refer to Table S2.
3.3 Biomass C sequestration in different forest age
groups
In the original national forest inventory, only three age
groups were recognized, namely young forests, middle-aged
forests, and old forests. In the subsequent inventories (after
1984), forests were categorized into five different age groups
Figure 1. Changes in the area, biomass C pool, and C density of
as we mentioned above (Table S6). To facilitate the com-
forests from 1977 to 2018. The pink box highlights the results of parison of different periods, we grouped the premature for-
the recent decade. est, mature forest, and overmature forest into one forest age
group – old forest. The young and middle-aged forests re-
mained unchanged. The three classes are aggregated from
the five classes.
leaved forest, the C sinks of four of the five forest types in- The growth rate by area and C pool of all forest age groups
creased in the most recent 10 years (2009–2018) in com- over the most recent 10 years (2009–2018) were higher than
parison to 1977–2008 (Table 3). In particular, the biomass those for the previous 30 years (1977–2008). In addition,
C sink of evergreen broad-leaved forests during 2009–2018 the forest area and C pool for each age group reached the
was 84.6 Tg C yr−1 , which is much higher than the average C highest level recorded during 2014–2018. The area and C
sink for the previous 30 years (22.8 Tg C yr−1 , 1977–2008). pool of old forests were both the largest, at 6.33 × 10⁷ ha
The C pool of the evergreen broad-leaved forest reached and 4387 Tg C, respectively (Fig. 2). The area of young,
2747 Tg C during 2014–2018 (Tables 3 and S2). Overall middle-aged, and old forests increased from 1977 to 2018
changes in the biomass C pools from 1977 to 2018 indicated by 1.47 × 10⁷ , 1.08 × 10⁷ , and 2.51 × 10⁷ ha, respectively
that, with the exception of cold-temperate coniferous forests, (Fig. 2, Table S5). Meanwhile, the C pools increased by
the biomass C pools of four out of the five forest types all 657, 791, and 1810 Tg C, respectively (Fig. 2, Table S5).
increased. The largest increase took place in the evergreen The biomass C densities of young, middle-aged, and old
broad-leaved forest (1463 Tg C), which had an average an- forests increased by 7.9, 7.5, and 1.9 Mg C ha−1 , respectively
nual C sink of 39.5 Tg C yr−1 (Table S2). For more details (Fig. 2, Table S5).
Biogeosciences, 19, 2989–2999, 2022 https://doi.org/10.5194/bg-19-2989-2022C. Yang et al.: Updated estimation of forest biomass carbon pools in China 2993
Table 3. Area, biomass C pool, C density, and average C sink of different zonal forest types in the most recent decade compared to the
previous 30 years∗ .
Zonal forest types Periods Area C pool C density C sink
104 ha Tg C Mg C ha−1 Tg C yr−1
Cold-temperate coniferous forest 1977–2008 2080 1461 70.2 −8.2
2009–2018 1844 1321 71.6 11.3
Temperate coniferous forest 1977–2008 1125 381 33.9 9.9
2009–2018 1740 652 37.5 13.7
Temperate deciduous broad-leaved forest 1977–2008 3614 1430 39.6 26.2
2009–2018 3714 1730 46.6 19.5
Temperate–subtropical mixed forest 1977–2008 3989 975 24.4 12.6
2009–2018 3834 1308 34.1 25.7
Evergreen broad-leaved forest 1977–2008 2953 1200 40.7 22.8
2009–2018 5748 2515 43.7 84.6
∗ The average C sink for the previous 30 years was calculated by dividing the difference between the 2004–2008 and 1977–1981 C pools
by 27. The average C sink over the most recent decade was calculated by dividing the difference between the 2014–2018 and 2004–2008
C pools by 10.
4 Discussion (e.g. Li et al., 2015; Zhang et al., 2021). Others used a linear
model proposed by Fang et al. (2007) to correct the inven-
4.1 China’s forest C sink size tory data (e.g. Zhang et al., 2013; Zhao et al., 2019, 2021),
while the linear conversion equations would underestimate
National forest inventories provide the most comprehen- forest areas and biomass C stocks in the provinces with large
sive statistical and temporal datasets for investigating for- amounts of forest (Fig. S1). Obviously, these underestimates
est change. Using data from eight forest inventories includ- would inevitably induce previous studies to report higher C
ing the most recent forest inventory period of 2014–2018, sinks than those of this study. Moreover, the divergences in
this study provided an updated estimate of China’s forest BEF model parameters, root-to-shoot ratio, and C conversion
biomass C pool and obtained how it has varied over the factor would also contribute to the discrepancies among the
last 40 years (1977–2018). Our results showed that the lat- estimates of C stocks, thus inducing the different C seques-
est forest biomass C pool (7975 Tg C, 2014–2018) was much tration rates (e.g. Zhao et al., 2019, 2021).
larger than 4717 Tg C from 1977–1981, with an increase of Despite the differences in the estimates of biomass C
3258 Tg C (69.1 %), and accordingly, the C sink averaged stocks and their changes, most previous studies and this work
88.0 Tg C yr−1 . In particular, the biomass C pool increased all agreed that the average biomass C sink of China’s forests
by 154.8 Tg C yr−1 during the period of 2009–2018, which since the 1980s is approximately 100 Tg C yr−1 . In addition,
was significantly higher than the average C sequestration rate several studies based on field investigations pointed out that
of 63.3 Tg C yr−1 in the previous 3 decades (1977–2008). both the dead organic matter and soils in China’s forest also
In summary, China’s forests acted as a significant C sink in functioned as C sinks over the past 4 decades, with average
biomass during 1977–2018, while the C sink was further en- values of 6.7 and 57.3 Tg C yr−1 , respectively (Zhu et al.,
hanced in the most recent decade. 2017; Yang et al., 2014; Fang et al., 2018). Together with
In terms of the order of magnitude, our estimates of the biomass C sink estimated in this study, this study sug-
biomass C stocks are comparable with those from previous gests that China’s forest ecosystems would sequester approx-
studies (e.g. Fang et al., 2007; Zhang et al., 2013; Li et al., imately 100–200 Tg C yr−1 in total over the last 4 decades.
2015; Zhang et al., 2021; Zhao et al., 2019, 2021), while Recently, some studies based on “top-down” atmospheric in-
there are some discrepancies between the size of the C pool versions reported that the net land C sink of China could
in this study and those reported by others. In particular, most reach 0.8–1.1 Pg C yr−1 during the 2010s and suggested that
studies provided smaller estimates than ours in the periods this large sink was mainly attributed to forest ecosystems
prior to 1994 (Table S7). This may be due to methodologi- (J. Wang et al., 2020, 2022). However, according to the size
cal differences in the conversion of canopy coverage criteria. of the forest C sink we mentioned above, that large C sink
Some studies did not consider the shift from the old criterion could not be supported by this and other studies based on
(> 0.3 canopy coverage) to the new criterion (> 0.2 canopy field investigations including national forest inventories.
coverage), which led to shrinking forest areas and thus sig-
nificant underestimation of the C pool in the earlier periods
https://doi.org/10.5194/bg-19-2989-2022 Biogeosciences, 19, 2989–2999, 20222994 C. Yang et al.: Updated estimation of forest biomass carbon pools in China
ment of China’s forest C sink, in which area expansion con-
tributed more to planted forests while forest growth was a
great contributor to natural forests (Fang et al., 2014a; Li et
al., 2016). This conclusion could also explain the enhanced C
sink during the period of 2009–2018 observed in this study.
Our results showed that between the 7th Forest Inventory
(2004–2008) and the 9th Forest Inventory (2014–2018), the
area of planted forest increased by 30 % (from 0.40 × 10⁸
to 0.52 × 10⁸ ha), while the C sink increased by only 24 %
(from 46.2 to 57.3 Tg C yr−1 ) during the same period, indi-
cating that area expansion is the main factor driving the en-
hanced C sink of planted forests (Table 2). In contrast, the
area of natural forest increased by only approximately 6 %
(from 1.15 × 10⁸ to 1.22 × 10⁸ ha), but the corresponding
C sink nearly doubled (from 66.7 to 128.1 Tg C yr−1 ) (Ta-
ble 2), suggesting that the enhanced C sink of natural forests
is mainly contributed by forest growth rather than area ex-
pansion.
The area expansion of China’s forest could be largely
due to national ecological projects. Since the late 1970s,
China has launched six key national ecological projects to
restore degraded ecosystems and to protect the country’s en-
vironment (Lu et al., 2018). Within the framework of these
projects, large-scale afforestation and reforestation have been
conducted, which contributed 71.2 % of the total forest area
expansion in China during 1977–2018 (Table 2), resulting
in China having the largest planted forest area in the world
(Guo et al., 2013; Lu et al., 2018). Obviously, such area ex-
pansion, which was mainly led by ecological projects, would
promote an increase in the biomass C sink in China’s forests,
especially in planted forests.
The increased growth in China’s forest could be due to sev-
eral reasons. On the one hand, environmental changes (e.g.
elevated CO2 , climatic change, nitrogen deposition) may be
an important reason for the increase in China’s forest growth
over the most recent decade (Piao et al., 2009a, b; Tian et
al., 2011; Pan et al., 2011, 2013; Fang et al., 2014b; Liu et
al., 2021). We noticed that differing from what happened
in the old forest, in which the C density remained roughly
Figure 2. Changes in area (a), C pool (b), and C density (c) of forest steady, the C densities in the young and middle-aged forests
for each age group from 1977 to 2018. The pink box highlights the showed a significant increase from 1977 to 2018, especially
latest results from the most recent 10 years. during 2009–2018 (Fig. 2). A previous study pointed out that
such an increase in the C density of the forest at an age
stage often means accelerated tree growth induced by en-
4.2 Potential influencing factors of biomass C sinks vironmental changes (Fang et al., 2014b). Meanwhile, after
excluding the potential impacts from tree species and forest
As we mentioned above, China’s forests presented an en- age, our regression analysis showed that the average C den-
hanced biomass C sink in most provinces during the recent sity presented significantly positive relationships with atmo-
decade (Table S3). Further analyses of this study showed that spheric CO2 concentration, mean annual temperature (MAT),
the enhancement of the biomass C sink widely occurred in and nitrogen deposition (Fig. S2), which could also reflect
China’s forests during 2009–2018 (Table S3), although the the promoting effect of elevated CO2 , rising temperature,
enhancing extent would be different between forest stand ori- and increased nitrogen deposition on forest growth. Over the
gins or among forest zonal types/age groups (Tables 2, 3, past 4 decades, China’s forests have experienced significant
S7). It has been demonstrated that forest area expansion and increases in CO2 concentration (Global Monitoring Labo-
increased forest growth jointly contributed to the enhance- ratory, https://www.gml.noaa.gov/, last access: 20 Decem-
Biogeosciences, 19, 2989–2999, 2022 https://doi.org/10.5194/bg-19-2989-2022C. Yang et al.: Updated estimation of forest biomass carbon pools in China 2995
ber 2021), mean annual temperature (China Meteorologi- sink, acting as the main source of forest C sink in nearly half
cal Data Service Center, https://data.cma.cn/data/index.html, of China’s provinces (Table S4) and currently contributing
last access: 20 December 2021), and nitrogen deposition more than 30 % of the total forest biomass C sink across the
(Eyring et al., 2013), which have increased from 342 ppm, whole country (Table 2). This result proved that afforestation
10.5 ◦ C, and 0.8 g N m−2 during the first 5 years of the 1980s indeed promoted the growth of China’s forest C sink.
to 404 ppm, 11.6 ◦ C, and 1.4 g N m−2 during 2014–2018, re- However, it could be easy to fall into the misunderstand-
spectively. In particular, the annual mean growth rates of ing of using this result to prove the success of China’s af-
CO2 and MAT in the most recent decade (2.29 ppm yr−1 forestation and further overemphasize its importance in for-
and 0.07 ◦ C yr−1 , respectively) were greater than those in est C sink management. The national forest inventory only
the previous 3 decades (1.68 ppm yr−1 and 0.04 ◦ C yr−1 , re- records the forest stands that are successfully established
spectively). All these changes would accelerate the growth of and last retained; thus the area of planted forest would be
forests in China and thus lead to the enhanced biomass C sink much less than the actual afforestation area. From 1977 to
in the past 40 years, especially in the most recent decade. 2018, the cumulative afforestation area in China was approx-
On the other hand, the implementation of ecological imately 1.9×10⁸ ha, nearly 4 times the current planted forest
projects could be another important reason for the increased (National Forestry and Grasslands Administration, 2019a).
forest growth in China. These projects implemented a se- This implied that most of the trees cultivated in afforesta-
ries of forest management practices, such as forest enclo- tion projects have failed to survive to the current moment.
sure, tending, and reduction of timber harvesting, to promote This situation is particularly widespread in the vast arid and
the growth of forests and achieved remarkable effects (Xu et semi-arid regions of China. Compared with natural forests,
al., 2017; Fang et al., 2018; Lu et al., 2018). For example, planted forests are more sensitive and vulnerable to drought
due to the illegal occupation of forestland and vast excessive stress because of their high transpiration rate, high plant den-
logging, China’s natural forest experienced a sharp decline sity, and low biodiversity (Isbell et al., 2015; Martín-Benito
in the area during the period of 1994–1998 (Table 2) (Na- et al., 2010; Zhong et al., 2021). Therefore, planted forests
tional Forestry Administration, 2000 unpublished data). Al- in arid and semi-arid regions such as northwest China gener-
though the stock volume density and C density continued to ally present low survival rates due to frequent drought events
rise, the severely shrinking area induced reductions in for- (Cao, 2008; Cao et al., 2011; F. Wang et al., 2020; Zhang
est stock volumes and C stocks (Table 2). Thus, the govern- et al., 2022). Although people try to improve the survival
ment launched the Natural Forest Protection project in 1998 rate of trees by selecting an appropriate afforestation method,
(National Forestry Administration, 2000 unpublished data). choosing proper tree species, and cooperating with a series
As a result, the area and biomass C pool of natural forests of management measures, such as the application of fertil-
increased greatly from 1.03 × 10⁸ ha and 4746 Tg C during izer and irrigation, tending operations, etc. (Liu et al., 2016;
1994–1998 to 1.22 × 10⁸ ha and 6505 Tg C during 2014– Zhou et al., 2013), it is still a significant challenge to achieve
2018, respectively (Table 2). Meanwhile, in the most recent successful afforestation in the arid and semi-arid regions of
decade, extensive young forests planted by these projects China (Wang et al., 2014; Yu et al., 2019; Zhong et al., 2021;
have gradually entered the middle-aged or premature stages, Zhou et al., 2013). Currently, most of the land available for
in which forests usually have rapid growth rates (Guo et al., afforestation in China is distributed in arid and semi-arid re-
2013). Our results showed that during 1977–2018, the areas gions or other regions with poor site conditions (C. Zhang
of middle-aged and old forests expanded from 4.3 × 10⁷ and et al., 2018), which would be bound to greatly decrease in
3.8 × 10⁷ to 5.4 × 10⁷ and 6.3 × 10⁷ ha, respectively (Fig. 2, the success rate of afforestation. Thus, the realizability of en-
Table S5), suggesting that a large area of young forests en- hancing forest C sinks through large-scale afforestation must
tered a rapid growth stage with high C sequestration ability. be carefully evaluated in the future.
The large C sinks brought by these forests could be an im- Compared with the implementation of large-scale af-
portant source of power for China’s forest C sinks after 2010 forestation, our results suggested that enhancing the regen-
(Cai et al., 2021; Yu et al., 2021). eration of old-growth forests, especially those in natural
forests, would be of greater significance for the future man-
4.3 Effects of human intervention on forest C sink agement of forest C sinks. We noticed that from 1977 to
management 2018, the biomass C density of old forests generally re-
mained stable (Table 2). This result suggested that the ob-
In current forest C sink management, human intervention ex- served C sink of old forests would mainly derive from
ists in many aspects, among which the most important is the their area expansion, i.e. the transformation from young and
cultivation of planted forest. Planted forests play a critical middle-aged forests to old forests, rather than forest growth.
role in enhancing ecosystem services, absorbing atmospheric Due to the high mortality rate of old-growth trees, old forests,
CO2 , and mitigating climate change (Fang et al., 2001; Li et especially overmature forests, would even present a decline
al., 2018, 2019; Lu et al., 2018; Tang et al., 2018). In this in C density, thus leading to a negative contribution to the
study, we found that China’s planted forest is an important C C sink (Zhao et al., 2021). Therefore, for old forests, it is
https://doi.org/10.5194/bg-19-2989-2022 Biogeosciences, 19, 2989–2999, 20222996 C. Yang et al.: Updated estimation of forest biomass carbon pools in China
necessary to properly adopt practices such as thinning, selec- 2018) were much higher than those of the previous 30 years
tive cutting, sanitary cutting, and reforestation (Zhao et al., (5447 Tg C and 63.3 Tg C yr−1 , 1977–2008), although the
2021) to maintain a healthy state, avoid C release caused by C sink strength displayed large variations in different peri-
the large-scale death of trees, and promote their regenera- ods. Afforestation practices, forest growth, and environmen-
tion to function as a significant C sink. This would be criti- tal changes were proposed as the main drivers of this sig-
cal for the maintenance and management of forest C sinks. nificant C increase, especially in the most recent decade. Our
Of course, such artificial regeneration practices would in- study updates the previous estimates of China’s forest C stor-
evitably remove biomass C from forests, but it does not mean age and its changes and provides an essential basis for policy-
an equivalent amount of C release because C in harvesting making for ecosystem services and the carbon neutrality tar-
timbers is often turned into deposited C in wood products, get in China.
e.g. furniture, house building, and instruments, which could
exist for tens or even hundreds of years (Skog, 2008; van
Deusen, 2010; X. Zhang et al., 2018), providing sufficient Data availability. All data are included in this article and/or Sup-
growth time for young trees after regeneration. However, it plement.
should be noted that several studies have found that ageing
forests could still maintain rising C densities, although their
biomass C accumulation rates gradually decreased (Cao et Supplement. The supplement related to this article is available on-
al., 2012; Luyssaert et al., 2008; Yue et al., 2018; Zhao et al., line at: https://doi.org/10.5194/bg-19-2989-2022-supplement.
2014). Thus, the adoption of artificial regeneration practices
in old forests also needs to be carefully evaluated to avoid
Author contributions. JF and CY designed the study. CY and YS
unnecessary C release.
analysed the data. ZG provided part of datasets. WS, YS, JZ, CJ,
YF, SM, and JF wrote the manuscript and gave final approval for
4.4 Uncertainty of estimations publication.
The estimation involved in the study is presented with
some uncertainties. In general, the national forest inventory Competing interests. The contact author has declared that neither
data were assumed to have small errors of less than 5 % they nor their co-authors have any competing interests.
(Fang et al., 2001). The survey accuracy of the forest area
and timber volume was over 90 % (National Forestry and
Grasslands Administration, 2019b). The method calculated Disclaimer. Publisher’s note: Copernicus Publications remains
biomass from surveyed stand volume data, and the R 2 of the neutral with regard to jurisdictional claims in published maps and
BEF function (Eqs. 1 and 2) of the dominant tree species was institutional affiliations.
higher than 0.80 (Table S1), suggesting that our estimates
of forest biomass were statistically reliable. Previous stud-
ies have shown that the estimated error of forest biomass at Acknowledgements. This study was funded by the National Natural
the national scale using the BEF function is unlikely to ex- Science Foundation of China (31988102 and 41871038). We also
ceed 3 % (Fang and Chen, 2001; Fang et al., 1996, 2002). thank the National Forestry and Grass Administration for the data
A constant C conversion factor of 0.5 may introduce a sys- support.
tematic error of −5.9 % to 2.5 % (Ma et al., 2020). Despite
these uncertainties, the results of this study provide relatively
Financial support. This research has been supported by the Na-
high accuracy and a comprehensive assessment of the forest
tional Natural Science Foundation of China (grant nos. 31988102
C budget.
and 41871038).
5 Conclusions Review statement. This paper was edited by Ben Bond-Lamberty
and reviewed by three anonymous referees.
In this study, we estimated forest biomass C storage and its
changes in China over the past 40 years (1977–2018) and
updated their estimates in the most recent decade (2009–
2018) using the biomass expansion factor method and eight References
national forest inventories conducted every 5 years. We con- Cai, W., He, N., Li, M., Xu, L., Wang, L., Zhu, J., Zeng, N., Yan, P.,
cluded that the Chinese forest biomass C pool increased by Si, G., Zhang, X., Cen, X., Yu, G., and Sun, O.: Carbon seques-
3258 Tg C with an annual C sink of 88.0 Tg C yr−1 from tration of Chinese forests from 2010 to 2060: Spatiotemporal
1977 to 2018. The biomass C pool and C sink in the dynamics and its regulatory strategies, Sci. Bull., 67, 836–843,
most recent 10 years (7525 Tg C and 154.8 Tg C yr−1 , 2009– 2021.
Biogeosciences, 19, 2989–2999, 2022 https://doi.org/10.5194/bg-19-2989-2022C. Yang et al.: Updated estimation of forest biomass carbon pools in China 2997
Cao, J., Wang, X., Tian, Y., Wen, Z., and Zha, T.: Pattern of carbon the relative contributions of forest expansion and forest growth,
allocation across three different stages of stand development of a Glob. Change Biol., 20, 2019–2030, 2014a.
Chinese pine (Pinus tabulaeformis) forest, Ecol. Res., 27, 883– Fang, J., Kao, T., Guo, Z., Yang, Y., Hu, H., Shen, H., Zhao, X.,
892, 2012. Kishimoto-Mo, A. W., Tang, Y., and Houghton, R. A.: Evidence
Cao, S.: Why large-scale afforestation efforts in China have failed for environmentally enhanced forest growth, P. Natl. Acad. Sci.
to solve the desertification problem, Environ. Sci. Technol., 42, USA, 111, 9527–9532, 2014b.
1826–1831, 2008. Fang, J., Yu, G., Liu, L., Hu, S., and Chapin, F. S.: Climate change,
Cao, S., Chen, L., Shankman, D., Wang, C., Wang, X., and Zhang, human impacts, and carbon sequestration in China, P. Natl. Acad.
H.: Excessive reliance on afforestation in China’s arid and semi- Sci. USA, 115, 4015–4020, 2018.
arid regions: Lessons in ecological restoration, Earth-Sci. Rev., Guo, Z., Fang, J., Pan, Y., and Birdsey, R.: Inventory-based esti-
104, 240–245, 2011. mates of forest biomass carbon stocks in China: A comparison
Eyring, V., Lamarque, J., Hess, P., Arfeuille, F., Bowman, K., Chip- of three methods, Forest Ecol. Manag., 259, 1225–1231, 2010.
perfiel, M., Duncan, B., Fiore, A., Gettelman, A., Giorgetta, Guo, Z., Hu, H., Li, P., Li, N., and Fang, J.: Spatio-temporal changes
M., Granier, C., Hegglin, M., Kinnison, D., Kunze, M., Lange- in biomass carbon sinks in China’s forests during 1977–2008,
matz, U., Luo, B., Martin, R., Matthes, K., Newman, P., Pe- Sci. China-Life Sci., 43, 421–431, 2013.
ter, T., Robock, A., Ryerson, T., Saiz-Lopez, A., Salawitch, R., Harris, N. L., Gibbs, D. A., Baccini, A., Birdsey, R. A., de Bruin, S.,
Schultz, M., Shepherd, T., Shindell, D., Staehelin, J., Tegtmeier, Farina, M., Fatoyinbo, L., Hansen, M. C., Herold, M., Houghton,
S., Thomason, L., Tilmes, S., Vernier, J., Waugh, D., and Young, R. A., Potapov, P. V., Suarez, D. R., Roman-Cuesta, R. M.,
P.: Overview of IGAC/SPARC Chemistry-Climate Model Ini- Saatchi, S. S., Slay, C. M., Turubanova, S. A., and Tyukavina,
tiative (CCMI) community simulations in support of upcoming A.: Global maps of twenty-first century forest carbon fluxes, Nat.
ozone and climate assessments, Sparc Newsletter, 40, 48–66, Clim. Chang., 11, 234–240 2021.
2013. He, J.: Carbon cycling of Chinese forests: From carbon storage, dy-
Fahey, T. J., Woodbury, P. B., Battles, J. J., Goodale, C. L., Ham- namics to models, Sci. China-Life Sci., 55, 188–190, 2012.
burg, S. P., Ollinger, S. V., and Woodall, C. W.: Forest carbon Isbell, F., Craven, D., Connolly, J., Loreau, M., Schmid, B.,
storage: Ecology, management, and policy, Front. Ecol. Environ., Beierkuhnlein, C., Bezemer, T. M., Bonin, C., Bruelheide, H., de
8, 245–252, 2010. Luca, E., Ebeling, A., Griffin, J. N., Guo, Q., Hautier, Y., Hector,
FAO: FAO Stat Database, http://www.fao.org/faostat/en/#data, last A., Jentsch, A., Kreyling, J., Lanta, V., Manning, P., Meyer, S.
access: 20 December 2021. T., Mori, A. S., Naeem, S., Niklaus, P. A., Polley, H. W., Reich,
Fang, J.: Forest productivity in China and its response to global cli- P. B., Roscher, C., Seabloom, E. W., Smith, M. D., Thakur, M.
mate change, Acta Phytoecologica Sinica, 24, 513–517, 2000. P., Tilman, D., Tracy, B. F., van der Putten, W. H., van Ruijven,
Fang, J. and Chen, A.: Dynamic forest biomass carbon pools in J., Weigelt, A., Weisser W. W., Wilsey, B., and Eisenhaur, N.:
China and their significance, Acta Bot. Sin., 43, 967–973, 2001. Biodiversity increases the resistance of ecosystem productivity
Fang, J. and Wang, Z.: Forest biomass estimation at regional and to climate extremes, Nature, 526, 574–577, 2015.
global levels, with special reference to China’s forest biomass, Li, P., Zhu, J., Hu, H., Guo, Z., Pan, Y., Birdsey, R., and Fang,
Ecol. Res., 16, 587–592, 2001. J.: The relative contributions of forest growth and areal expan-
Fang, J., Liu, G., and Xu, S.: Biomass and net production of forest sion to forest biomass carbon, Biogeosciences, 13, 375–388,
vegetation in China, Acta Ecologica Sinica, 16, 497–508, 1996. https://doi.org/10.5194/bg-13-375-2016, 2016.
Fang, J., Wang, G., Liu, G., and Xu, S.: Forest biomass of China: An Li, Y., Xu, X., and Zhang, C.: Study on dynamics of arboreal forest
estimate based on the biomass-volume relationship, Ecol. Appl., carbon storage in China, Forest Engineering, 31, 50–55, 2015.
8, 1084–1091, 1998. Li, Y., Piao, S., Laurent, Z., Li, X., Chen, A., Wang, X., Ciais, P.,
Fang, J., Chen, A., Peng, C., Zhao, S., and Ci, L.: Changes in forest Huang, L., Lian, X., Peng, S., Zeng, Z., Wang, K., and Zhou,
biomass carbon storage in China between 1949 and 1998, Sci- L.: Divergent hydrological response to large-scale afforesta-
ence, 292, 2320–2322, 2001. tion and vegetation greening in China, Sci. Adv., 4, eaar4182,
Fang, J., Chen, A., Zhao, S., and Ci, L.: Estimating biomass car- https://doi.org/10.1126/sciadv.aar4182, 2018.
bon of China’s forest: Supplementary notes on report published Li, Y., Piao, S., Chen, A., Ciais, P., Laurent, Z., and Li, X.: Local
in science (291: 2320–2322) by Fang et al. 2001, Acta Phytoeco- and tele-connected temperature effects of afforestation and veg-
logica Sinica, 26, 243–249, 2002. etation greening in China, Natl. Sci. Rev., 7, 897–912, 2019.
Fang, J., Brown, S., Tang, Y., Nabuurs, G. J., Wang, X., and Shen Liu, H., Zhou, T., Wu, H., Zhao, X., Wang, Q., Gao, S., and
H.: Overestimated biomass carbon pools of the northern mid-and Li, Z.: Contrasting responses of planted and natural forests
high latitude forests, Climatic Change, 74, 355–368, 2006. to drought intensity in Yunnan, China, Remote Sens., 8, 635,
Fang, J., Guo, Z., Piao, S., and Chen, A.: Terrestrial vegetation car- https://doi.org/10.3390/rs8080635, 2016.
bon sinks in China, 1981–2000, Sci. China Ser. D, 50, 1341– Liu, J., Zhou, H., Bachelot, B., Dong, T., Zhu, Z., Liao, Y.,
1350, 2007. Plenkovic-Moraj, A., and Wu, Y.: Predicting the responses of
Fang, J., Tang, Y., and Son, Y.: Why are East Asian ecosystems subalpine forest landscape dynamics to climate change on the
important for carbon cycle research?, Sci. China-Life Sci., 53, eastern Tibetan Plateau, Glob. Change Biol., 27, 4352–4366,
753–756, 2010. 2021.
Fang, J., Guo, Z., Hu, H., Kato, T., Muraoka, H., and Song, Y.: For- Lu, F., Hu, H., Sun, W., Zhu, J., Liu, G., Zhou, W., Zhang, Q., Shi,
est biomass carbon sinks in East Asia, with special reference to P., Liu, X., Wu, X., Zhang. L., Wei, X., Dai, L., Zhang, K., Sun,
Y., Xue, S., Zhang, W., Xiong, D., Deng, L., Liu, B., Zhou, L.,
https://doi.org/10.5194/bg-19-2989-2022 Biogeosciences, 19, 2989–2999, 20222998 C. Yang et al.: Updated estimation of forest biomass carbon pools in China Zhang, C., Zheng, X., Cao, J., Huang, Y., He, N., Zhou, G., Bai, Zhang, H., Evans, R. D., Carrillo, Y., Fisher, J. B., van Sundert, Y., Xie, Z., Tang, Z., Wu, B., Fang, J., Liu, G., and Yu, G.: Effects K., Vicca, S., and Jackson, R. B.: A trade-off between plant and of national ecological restoration projects on carbon sequestra- soil carbon storage under elevated CO2 , Nature, 591, 599–603, tion in China from 2001 to 2010, P. Natl. Acad. Sci. USA, 115, 2021. 4039–4044, 2018. Tian, H, Melillo, J., Lu, C., Kicklighter, D., Liu, M., Ren, W., Luyssaert, S., Schulze, E. D., Borner, A., Knohl, A., Hessenmoller, Xu, X., Chen, G., Zhang, C., Pan, S., Liu, J., and Running, S.: D., Law, B. E., Ciais, P., and Grace, J.: Old-growth forests as China’s terrestrial carbon balance: Contributions from multiple global carbon sinks, Nature, 455, 213–215, 2008. global change factors, Global Biogeochem. Cy., 25, GB1007, Ma, S., Eziz, A., Tian, D., Yan, Z., Cai, Q., Jiang, M., Ji, C., and https://doi.org/10.1029/2010GB003838, 2011. Fang, J.: Size- and age-dependent increases in tree stem carbon van Deusen, P.: Carbon sequestration potential of forest land: concentration: implications for forest carbon stock estimations, Management for products and bioenergy versus preservation, J. Plant Ecol., 13, 233–240, 2020. Biomass Bioenerg., 34, 1687–1694, 2010. Martín-Benito, D., Del Río, M., Heinrich, I., Helle, G., and Canel- Wang, F., Pan, X., Gerlein-Safdi, C., Cao, X., Wang, S., Gu, L., las, I.: Response of climate-growth relationships and water use Wang, D., and Lu, Q.: Vegetation restoration in Northern China: efficiency to thinning in a Pinus nigra afforestation, Forest Ecol. A contrasted picture, Land Degrad. Dev., 31, 669–676, 2020. Manag., 259, 967–975, 2010. Wang, J., Feng, L., Palmer P. I., Liu, Y., Fang S., Bosch, H., O’Dell, National Forestry Administration: China Forest Resources Report, C. W., Tang, X., Yang, D., and Liu, L.: Large Chinese land car- 1994–1998, China Forestry Publishing House, Beijing, 2000. bon sink estimated from atmospheric carbon dioxide data, Na- National Forestry and Grasslands Administration: ture, 586, 720–723, 2020. China Forestry and Grassland Statistical Yearbook, Wang, J., Feng, L., Palmer P. I., Liu, Y., Fang S., Bosch, H., O’Dell, 2019, China Forestry Publishing House, Beijing, C. W., Tang, X., Yang, D., Liu, L., and Xia C.: Reply to: On the https://doi.org/10.38797/y.cnki.ycsrt.2021.000001, 2019a. role of atmospheric model transport uncertainty in estimating the National Forestry and Grasslands Administration: China Forest Re- Chinese land carbon sink, Nature, 603, 15–16, 2022. sources Report, 2014–2018, China Forestry Publishing House, Wang, L., Zhang, Y., Berninger, F., and Duan, B.: Net pri- Beijing, 978-7-5038-9982-9, 2019b. mary production of Chinese fir plantation ecosystems and Pan, Y., Birdsey, R. A., Fang, J., Houghton, R., Kauppi, P. E., Kurz, its relationship to climate, Biogeosciences, 11, 5595–5606, W. A., Phillips, O. L., Shvidenko, A., Lewis, S. L., Canadell, J. https://doi.org/10.5194/bg-11-5595-2014, 2014. G., Ciais, P., Jackson, R. B., Pacala, S. W., McGuire, A. D., Piao, Xu, B., Guo, Z., Piao, S., and Fang, J.: Biomass carbon stocks in S., Rautiainen, A., Sitch, S., and Hayes, D.: A large and persistent China’s forests between 2000 and 2050: A prediction based on carbon sink in the world’s forests, Science, 333, 988–993, 2011. forest biomass-age relationships, Sci. China-Life Sci., 53, 776– Pan, Y., Birdsey, R. A., Phillips, O. L., and Jackson, R. B.: The 783, 2010. structure, distribution, and biomass of the world’s forests, Annu. Xu, W., Xiao, Y., Zhang, J., Yang, W., Zhang, L., Hull, V., Wang, Rev. Ecol. Evol. S., 44, 593–622, 2013. Z., Zheng, H., Liu, J., Polasky, S., Jiang, L., Xiao, Y., Shi, X., Piao, S., Ciais, P., Friedlingstein, P., de Noblet-Ducoudre, Cadule, and Rao, E.: Strengthening protected areas for biodiversity and P., Viovy, N., and Wang, T.: Spatiotemporal patterns of terrestrial ecosystem services in China, P. Natl. Acad. Sci. USA, 114, 1601– carbon cycle during the 20th century, Global Biogeochem. Cy., 1606, 2017. 23, GB4026, https://doi.org/10.1029/2008GB003339, 2009a. Yang, Y., Li, P., Ding, J., Zhao, X., Ma, W., Ji, C., and Fang, Piao, S., Fang, J., Ciais, P., Peylin, P., Huang, Y., Sitch, S., and J.: Increased topsoil carbon stock across China’s forests, Glob. Wang, T.: The carbon balance of terrestrial ecosystems in China, Change Biol., 20, 2687–2696, 2014. Nature, 458, 1009–1082, 2009b. Yu, Z., Liu, S., Wang, J., Wei, X., Schuler, J., Sun, P., Harper, R., Pugh, T. A. M., Lindeskog, M., Smith, B., Poulter, B., Arneth, A., and Zegre, N.: Natural forests exhibit higher carbon sequestra- Haverd, V., and Calle, L.: Role of forest regrowth in global car- tion and lower water consumption than planted forests in China, bon sink dynamics, P. Natl. Acad. Sci. USA, 116, 4382–4387, Glob. Change Biol., 25, 68–77, 2019. 2019. Yu, Z., You, W., Agathokleous, E., Zhou, G. Y., and Liu, Skog, K. E.: Sequestration of carbon in harvested wood products S. R.: Forest management required for consistent carbon for the United States, Forest Prod. J., 58, 56–72, 2008. sink in China’s forest plantations, Forest Ecosyst., 8, 54, Tang, X., Zhao, X., Bai, Y., Tang, Z., Wang, W., Zhao, Y., Wan, H., https://doi.org/10.1186/s40663-021-00335-7, 2021. Xie, Z., Shi, X., Wu, B., Wang, G., Yan, J., Ma, K., Du, S., Li, S., Yue, J., Guan, J., Yan, M., Zhang, J., Deng, L., Li, G., and Du, Han, S., Ma, Y., Hu, H., He, N., Yang, Y., Han, W., He, L., Yu, S.: Biomass carbon density in natural oak forests with different G., Fang, J., and Zhou, G.: Carbon pools in China’s terrestrial climate conditions and stand ages in northwest China, J. Forest ecosystems: New estimates based on an intensive field survey, P. Res., 23, 354–362, 2018. Natl. Acad. Sci. USA, 115, 4021–4026, 2018. Zhang, C., Ju, W., Chen, J., Zan, M., Li, D., Zhou, Y., and Wang, X.: Teobaldelli, M., Somogyi, Z., Migliavacca, M., and Usoltsev, V. A.: China’s forest biomass carbon sink based on seven inventories Generalized functions of biomass expansion factors for conifers from 1973 to 2008, Climatic Change, 118, 933–948, 2013. and broadleaved by stand age, growing stock and site index, For- Zhang, C., Ju, W., Chen, J., Wang, X., Yang, L., and Zeng, est Ecol. Manag., 257, 1004–1013, 2009. G.: Disturbance-induced reduction of biomass carbon sinks of Terrer, C. Phillips, R. P., Hungate, B. A., Rosende, J., Pett-Ridge, China’s forests in recent years, Environ. Res. Lett., 10, 114021, J., Craig, M. E., van Groenigen, K. J., Keenan, T. F., Sulman, B. https://doi.org/10.1088/1748-9326/10/11/114021, 2015. N., Stocker, B. D., Reich, P. B., Pellegrini, A. F. A., Pendall, E., Biogeosciences, 19, 2989–2999, 2022 https://doi.org/10.5194/bg-19-2989-2022
C. Yang et al.: Updated estimation of forest biomass carbon pools in China                                                            2999

Zhang, C., Ju, W., Chen, J., Fang, M., Wu, M., Chang, X.,             Zhao, M., Yang, J., Zhao, N., Xiao, X., Yue, T., and Wilson, J.
  Wang, T., and Wang, X.: Sustained biomass carbon sequestra-           P.: Estimation of the relative contributions of forest areal expan-
  tion by China’s forests from 2010 to 2050, Forests, 9, 689,           sion and growth to China’s forest stand biomass carbon seques-
  https://doi.org/10.3390/f9110689, 2018.                               tration from 1977 to 2018, J. Environ. Manage., 300, 113757,
Zhang, L., Sun, P., Huettmann, F., and Liu, S.: Where should China      https://doi.org/10.1029/2021JG006306, 2021.
  practice forestry in a warming world?, Glob. Change Biol., 28,      Zhong, Z., He, B., Chen, Y., Yuan, W., Huang, L., Guo,
  2461–2475, 2022.                                                      L., Zhang, Y. and Xie, X.: Higher sensitivity of planted
Zhang, X., Yang, H., and Chen, J.: Life-cycle carbon budget of          forests’ productivity than natural forests to droughts in
  China’s harvested wood products in 1900–2015, Forest Policy           China, J. Geophys. Res.-Biogeo., 126, e2021JG006306,
  Econ., 92, 181–192, 2018.                                             https://doi.org/10.1029/2021JG006306, 2021.
Zhang, Y., Wang, X., Pu, Y., and Zhang, J.: Changes in forest re-     Zhou, J., Zhang, Z., Sun, G., Fang, X., Zha, T., McNulty, S., Chen,
  source carbon storage in China between 1949 and 2018, Journal         J., Jin, Y., and Noormets, A.: Response of ecosystem carbon
  of Beijing Forestry University, 43, 1–14, 2021.                       fluxes to drought events in a poplar plantation in Northern China,
Zhao, J., Kang, F., Wang, L., Yu, X., Zhao, W., Song, X.,               Forest Ecol. Manag., 300, 33–42, 2013.
  Zhang, Y., Chen, F., Sun, Y., He, T., and Han, H.: Patterns of      Zhu, J., Hu, H., Tao, S., Chi, X., Li, P., Jiang, L., Ji, C., Zhu, J.,
  biomass and carbon distribution across a chronosequence of Chi-       Tang, Z., Pan, Y., Birdsey, R. A., He, X., and Fang, J.: Carbon
  nese pine (Pinus tabulaeformis) forests, PLoS One, 9, e94966,         stocks and changes of dead organic matter in China’s forests, Nat.
  https://doi.org/10.1371/journal.pone.0094966, 2014.                   Commun., 8, 151, https://doi.org/10.1038/s41467-017-00207-1,
Zhao, M., Yang, J., Zhao, N., Liu, Y., Wang, Y., Wilson, J. P., and     2017.
  Yue, T.: Estimation of China’s forest stand biomass carbon se-
  questration based on the continuous biomass expansion factor
  model and seven forest inventories from 1977 to 2013, Forest
  Ecol. Manag., 448, 528–534, 2019.

https://doi.org/10.5194/bg-19-2989-2022                                                        Biogeosciences, 19, 2989–2999, 2022
You can also read