Neural networks for increased accuracy of allergenic pollen monitoring
←
→
Page content transcription
If your browser does not render page correctly, please read the page content below
www.nature.com/scientificreports
OPEN Neural networks for increased
accuracy of allergenic pollen
monitoring
Marcel Polling1,7*, Chen Li2,7, Lu Cao2, Fons Verbeek2, Letty A. de Weger3,
Jordina Belmonte4, Concepción De Linares4, Joost Willemse5, Hugo de Boer6 &
Barbara Gravendeel1
Monitoring of airborne pollen concentrations provides an important source of information for the
globally increasing number of hay fever patients. Airborne pollen is traditionally counted under
the microscope, but with the latest developments in image recognition methods, automating this
process has become feasible. A challenge that persists, however, is that many pollen grains cannot
be distinguished beyond the genus or family level using a microscope. Here, we assess the use of
Convolutional Neural Networks (CNNs) to increase taxonomic accuracy for airborne pollen. As a case
study we use the nettle family (Urticaceae), which contains two main genera (Urtica and Parietaria)
common in European landscapes which pollen cannot be separated by trained specialists. While
pollen from Urtica species has very low allergenic relevance, pollen from several species of Parietaria
is severely allergenic. We collect pollen from both fresh as well as from herbarium specimens and
use these without the often used acetolysis step to train the CNN model. The models show that
unacetolyzed Urticaceae pollen grains can be distinguished with > 98% accuracy. We then apply our
model on before unseen Urticaceae pollen collected from aerobiological samples and show that the
genera can be confidently distinguished, despite the more challenging input images that are often
overlain by debris. Our method can also be applied to other pollen families in the future and will thus
help to make allergenic pollen monitoring more specific.
Pollen allergies are on the rise globally, with worldwide approximately 10–30% of adults and 40% of children
affected1,2. For patients the symptoms include a runny nose, sneezing and itchy eyes, mouth or skin. Control
measures and medication are readily available, but to alleviate the symptoms most efficiently, exposure to aller-
gens should be kept to a m inimum3. Therefore, for more and more people, fast and accurate monitoring of air-
borne pollen provides an essential early warning system4,5. Pollen concentrations in the air are monitored using
samplers that collect airborne pollen on sticky tape, e.g. Hirst type s amplers6. These tapes are microscopically
inspected for their pollen content, a process that requires highly trained specialists. Moreover, although the
allergenic pollen from some plants can be monitored at the species level (e.g. species of plantain, Plantago L.7),
many other pollen grains cannot be accurately identified to this level. In many taxa, only a genus- or family-level
identification is possible using current microscopic m ethods8. This is problematic since different species and
even genera within the same family can possess very different allergenic profiles. An extra challenging factor
in airborne pollen identification from Hirst samples is that they are collected directly from the air. In contrast
to pollen grains that have been acetolyzed 9, these pollen grains still contain all organic material, and defining
features are less apparent10.
This identification challenge is exemplified in the case of the nettle family (Urticaceae). Pollen grains pro-
duced by all species from the genus Urtica L. (stinging nettles) have a low allergenic p rofile11, while pollen from
several species of Parietaria L. (pellitory) is a major cause of hay fever and asthma, in particular P. judaica L.
and P. officinalis L.12,13. These pellitory species are native to the Mediterranean, but throughout the second half
of the twentieth century, a range expansion occurred through north-eastern Europe, the Americas and Australia
1
Naturalis Biodiversity Center, Leiden, The Netherlands. 2Leiden Institute of Advanced Computer Science
(LIACS), Leiden, The Netherlands. 3Department of Pulmonology, Leiden University Medical Center, Leiden,
The Netherlands. 4Institute of Environmental Sciences and Technology (ICTA‑UAB), The Universitat Autònoma
de Barcelona, Bellaterra, Cerdanyola del Vallès, Spain. 5Microbial Sciences, Institute of Biology, Leiden, The
Netherlands. 6Natural History Museum, University of Oslo, Oslo, Norway. 7These authors contributed equally:
Marcel Polling and Chen Li. *email: marcel.polling@naturalis.nl
Scientific Reports | (2021) 11:11357 | https://doi.org/10.1038/s41598-021-90433-x 1
Vol.:(0123456789)
www.nature.com/scientificreports/
as a result of anthropogenic distribution and climate c hange14,15. Parietaria sensitization is highly different per
geographic area, but has been reported to reach 80% in southern Italy while a value of 13% was found in the
United Kingdom16. Species of Parietaria flower throughout the year but their main flowering peaks occur in
May–June and August-October, which overlaps with the flowering season of Urtica species (June–October)17.
Cross-reactivity is present between species of Parietaria, but is absent between the genera Urtica and Pari-
etaria11,18,19. Parietaria pollen is microscopically indistinguishable from that of Urtica and their contribution to
the total airborne pollen load is currently not assessed in either native or expanded range20.
Pollen grains from Urtica and Parietaria species have a simple morphology: they are small (~ 11–20 µm),
rounded to slightly ellipsoidal tri-, tetra- or zonoporate with a psilate to scabrate surface ornament and small
pores. Most species have an annulus around the pore, i.e. a thickening of the otherwise very thin exine and a
germination area called the oncus (lens-shaped body located in the apertural region)7. The only species of Urti-
caceae that can be distinguished in aerobiological samples is Urtica membranacea due to its small size (~ 10–12
μm) and a high number of pores (usually more than s ix21. The main difference between the pollen of Urtica
and Parietaria are the slightly smaller size and coarser surface ornamentation of Parietaria, and a more angular
outline and more pronounced annulus of Urtica22.
Despite recent advances in innovative technologies, palynology is still largely an image-based discipline23.
Therefore, automating this process currently receives a lot of attention. Automatic classification using manu-
ally selected pollen-specific features has typically resulted in relatively low classification success (see e.g.24,25).
However, recent studies applying advances using deep learning have been very promising26–29. Neural networks
have been used successfully to manage both the tasks of differentiating pollen from non-pollen debris as well as
correctly identifying different taxa (for an overview please refer to 23). Automatic image recognition can, however,
also be used to improve identification of pollen taxa that are difficult to distinguish using traditional methods.
Subtle variations in morphology that are not readily apparent through microscopic investigation may be consist-
ently detected by neural networks. This has for example been shown for the highly similar pollen of black spruce
(Picea mariana (Mill.) Britton, Sterns & Poggenb.) and white spruce (Picea glauca (Moench) Voss) using machine
learning 30 and for pollen of ten species of the thistle genus Onopordum L. using an artificial neural network31.
Recent advances have also been made in the field of aerobiological samples with for example the distinction of
anomalous from normal pollen grains of common hazel (Corylus avellana L.) 32. However, neural networks have
so far not been tested for improvement of taxonomic resolution in unacetolyzed pollen in aerobiological samples.
Here we use Convolutional Neural Networks (CNNs) to distinguish morphologically similar, unacetolyzed
pollen from the nettle family. We collect pollen from all species of Urticaceae present in the Netherlands (Urtica
dioica, U. membranacea, U. urens, Parietaria judaica and P. officinalis). The pollen was collected from several
sources for each species, freshly collected as well as from herbaria, and used to create a pollen image reference
dataset. We compare the results of CNNs trained from scratch with those from pre-trained CNNs using transfer
learning. Because of the limited size of the pollen image dataset, pre-training the CNN on a publicly available
image database can help to recognize the distinguishing features of pollen grains such as pores, texture and shape.
We test both the deep CNN VGG16 and the faster CNNs MobileNetV1 and V2, and optimize the performance
using data augmentation. The model is then applied to unknown Urticaceae pollen from three aerobiological
samples with high Urticaceae pollen counts. We use one sample from the Leiden University Medical Centre
(LUMC), Leiden, the Netherlands as well as one sample each from Lleida and Vielha, Catalonia, Spain (ICTA-
UAB). In the Netherlands, stinging nettles (Urtica) are highly abundant and therefore it is expected that most
Urticaceae pollen will be from this genus. Urtica is also expected to be dominant in Vielha, while in the direct
surroundings of Lleida, Parietaria is very abundant.
The main objectives of this study are (1) to see whether a CNN model can distinguish morphologically similar
unacetolyzed pollen of two common genera and a species in the Urticaceae family that have highly differing
allergenic profiles; (2) to test whether the trained model can be successfully applied on aerobiological samples
containing more complex and for the model before unseen input images.
Results
Model performance. In this study three different CNNs were tested on unacetolyzed pollen of Urticaceae
which cannot currently be separated by specialists. The highest accuracy of the models using the three classes
Urtica, Parietaria and the species Urtica membranacea was obtained using fivefold cross-validation (i.e. 80%
training, 20% validation) with either VGG16 (98.61%) or MobileNetV2 (98.76%) (Table 1). Since VGG16 and
MobileNetV2 had very similar performance, we trained these two models two more times to see which model
performed more consistently. The mean accuracy after three repetitions was 98.50% for VGG16 with 0.145%
standard deviation and 98.45% for MobileNetV2 with relatively higher standard deviation (0.289%). The models
trained from scratch showed significant lower accuracy for MobileNetV1 and V2 (both < 89%) while this value
was 96.29% for VGG16.
As the CNNs showed equally high accuracies with the pre-trained method (> 98%), we applied the more con-
sistent VGG16 model using fivefold cross-validation and show the results here. The model accurately identified
pollen to the genus level for 97.8% of the test images for Urtica and 99.0% for Parietaria (Fig. 1). For Parietaria
three images were misclassified, while five were misclassified for Urtica (all to Parietaria). The species Urtica
membranacea was confidently distinguished from all other Urticaceae species (99.2%), but distinction at the
species-level was not possible for any of the other Urtica and Parietaria species. This is because the distinguish-
ing features of pollen from these species (e.g. exine ornamentation) could not be resolved in the used image
projections.
For all species, pollen grains were collected from a minimum of four different plants. Looking at the raw pol-
len images from the different plants, we identified intra-specific differences that result from natural variability
Scientific Reports | (2021) 11:11357 | https://doi.org/10.1038/s41598-021-90433-x 2
Vol:.(1234567890)www.nature.com/scientificreports/
CNN Method Cross-validation Accuracy (%) Precision Recall F1-score
Fivefold 96.29 0.9632 0.9629 0.9629
From scratch
Tenfold 96.14 0.9616 0.9614 0.9614
VGG16
Fivefold 98.61 0.9861 0.9861 0.9861
Pre-trained
Tenfold 98.30 0.9831 0.9830 0.9830
Fivefold 84.54 0.8454 0.8454 0.8454
From scratch
Tenfold 86.40 0.8640 0.8640 0.8641
MobileNetV1
Fivefold 98.15 0.9815 0.9815 0.9816
Pre-trained
Tenfold 98.15 0.9815 0.9815 0.9815
Fivefold 87.64 0.8769 0.8764 0.8763
From scratch
Tenfold 88.56 0.8857 0.8856 0.8856
MobileNetV2
Fivefold 98.76 0.9877 0.9876 0.9876
Pre-trained
Tenfold 98.45 0.9849 0.9845 0.9846
Table 1. Performance comparisons of VGG16, MobileNetV1 and MobileNetV2, comparing models trained
from scratch with pre-trained models as well as fivefold versus tenfold cross-validation.0 . Values in bold
represent the highest accuracy scores obtained for each of the three models.
Figure 1. Confusion matrix of results of pre-trained VGG16 using 80% of the images for training and 20%
for testing. Numbers represent the actual number of correctly recognized images while those between brackets
represent the ratio of correctly classified images. U.mem = Urtica membranacea.
within each species. To test whether the CNNs learned the pollen-specific distinguishing features rather than
sample-specific details, we produced feature maps for the VGG16 model (Fig. 2b–d). Despite the highly vari-
able input images of unacetolyzed pollen from different plants, the model consistently learned features such as
edges in the first convolutional layers, while finer features such as pores and annuli were learned in deeper layers.
Application to test cases. Table 2 shows the results of the CNN on unknown and before unseen Urti-
caceae pollen from an aerobiological sample from Leiden, the Netherlands, as well as from Lleida and Vielha,
Catalonia, Spain. We set the identification threshold at a value of 60% as derived from the model test images,
and therefore the CNN also returned unknown images (see Supplementary Table S1 for the full results). For the
sample from Leiden, 85.7% of the Urticaceae pollen was identified as Urtica, with only a minor presence of Pari-
etaria (4.5%). The sample from Lleida shows dominance of Parietaria pollen grains (81.0%) while 14.3% of the
Urticaceae pollen grains were classified as Urtica. Finally, for Vielha we find a mixture of ~ 70% Urtica and ~ 20%
Parietaria. No Urtica membranacea pollen grains were identified in any of the samples. On average, unknown
images account for 8.7% of the total images when using 60% identity threshold. When using a stricter identity
threshold (e.g. 70%, see Table 2), the unknown image category increases to an average value of 13.5%.
Discussion
This study demonstrates incorporating neural networks to increase the taxonomic resolution of pollen grain
identifications in aerobiological samples. The feature maps in Fig. 2 show that the trained deep learning model
VGG16 looks at the traditionally used morphological features to distinguish Urtica from Parietaria pollen grains.
Scientific Reports | (2021) 11:11357 | https://doi.org/10.1038/s41598-021-90433-x 3
Vol.:(0123456789)www.nature.com/scientificreports/
(a)
Input Conv layer 1 Conv layer 4 Conv layer 7 … Output
(b)
Ur ca
(c)
Parietaria
(d)
U.mem
Figure 2. Feature maps. (a) simplified view of the VGG16 model showing three convolutional layers. (b–d)
Feature maps of Urticaceae pollen grains from the standard deviation projection created using ImageJ, that were
confidently distinguished by the CNNs. (b) Urtica urens, (c) Parietaria judaica and (d) Urtica membranacea.
Activation levels are indicated with white indicating high activation and black very low/no activation.
Sample location Date collected No. Pollen % Urtica % Parietaria % U. mem % Unknown Identity threshold
Leiden, NL 23/08/2019 112 85.7 4.5 0 9.8 60%
Lleida, SP 16/06/2019 63 14.3 81.0 0 4.8 60%
Vielha, SP 09/08/2019 26 69.2 19.2 0 11.5 60%
Leiden, NL 23/08/2019 112 83.0 3.6 0 13.4 70%
Lleida, SP 16/06/2019 63 12.7 79.4 0 7.9 70%
Vielha, SP 09/08/2019 26 69.2 11.5 0 19.2 70%
Table 2. Results of the deep learning model VGG16 on Urticaceae pollen from an area representing 10% of
the total deposition area of Hirst-type aerobiological samples from Leiden (the Netherlands), Lleida and Vielha
(both Catalonia, Spain). Values in bold represent the highest accuracy scores obtained for each of the three
classes. The threshold for identification was tested at 60% and 70%. Images that were classified below this level
were classified as unknown. U.mem = Urtica membranacea.
The characteristic thickening of the exine around the pores of Urtica shows the highest activation in the deeper
convolutional layers. The distinct thickening is missing in Parietaria pollen, and the model instead focuses on
the pollen outline. As expected, the only species to be distinguished by our model is Urtica membranacea which
shows a slightly angular outline due to the larger numbers of pores (Fig. 2d). For the other species used in this
study, no distinction was possible even though it has been shown that pollen from species of Urtica (U. dioica
and U. urens) (Fig. 2b) and Parietaria (P. judaica and P. officinalis) (Fig. 2c) can be separated based on differences
in their exine ornamentation22. These differences can, however, only be imaged using specialized microscopy
methods such as SEM or phase-contrast imaging, and are very hard to visualize using brightfield microscopy.
Furthermore, these features are obscured when pollen grains are not acetolyzed. For our purposes, this species
level distinction is not relevant as no known differences in allergenicity are known between either the species
of Urtica11 or Parietaria18.
Scientific Reports | (2021) 11:11357 | https://doi.org/10.1038/s41598-021-90433-x 4
Vol:.(1234567890)www.nature.com/scientificreports/
Similar to a recent study comparing pollen image classification methods, we found that using a pre-trained
CNN consistently outperforms the models trained from s cratch33. This transfer learning approach is also used by
many other recent studies on deep learning of pollen images, mainly because of the limited amount of training
images26–29,34,35. Still, we find that the VGG16 model trained from scratch achieves a high accuracy of 96.29%. This
is because compared to the MobileNets, VGG16 architecture has more and deeper parameters. The MobileNets
have less training parameters making them much lighter and faster, and the high accuracies found here indicate
that they can be used as a light-weight alternative. In our models the amount of False Positives (FP) is nearly
equal to the amount of False Negatives (FN) which is why recall, precision and F1-score were very similar.
This is the first time deep learning has been used to increase the taxonomic accuracy of unacetolyzed pollen
identifications. The models represent a significant improvement of earlier attempts in distinguishing Urticaceae
pollen using automatic image classification. In a previous study using hand-designed shape and texture features,
pollen from three Urticaceae species could be distinguished from another with an 89% accuracy36, though only
a small image dataset was used to train the model (i.e. 100 images per species). Similar results were obtained by
24
where shape features were used with a minimum distance classifier to obtain a 86% accuracy between three
species of Urticaceae. Because not all species of Urticaceae were included and a low amount of training images
was used, these studies have limited applicability to the highly diverse pollen encountered in aerobiological slides.
Furthermore, for both studies the trained model was tested on real case examples and only Urtica membranacea
was successfully identified (> 98%). The other two classes (Urtica) and (Parietaria) showed very high error rates
(up to 44.4%)24. This could be because the model was not trained with sufficient variability. Because we trained the
models with pollen from various sources and used data augmentation, they had a better generalizing capability.
Deep learning models have shown similar accuracy rates to ours on larger and more varied pollen datasets
as well, but these either focussed on the family level37–39 or on insect-collected pollen for honey a nalysis26–28.
Increasing the taxonomic resolution of pollen grains has been achieved by incorporating an extensively trained
deep learning model with super-resolution microscopy on a case study of fossil p ollen35. Similarly, incorporating
SEM images has been found to allow for highly accurate distinction of pollen types29. These microscopy methods,
however, are often much more expensive than using light microscopy and require extensive sample preparation.
Moreover, nearly all of these studies work with acetolyzed pollen that allow easier recognition of distinguishing
features, and used pollen collected from a single location.
To validate our model, we tested it on Urticaceae pollen from aerobiological samples collected from different
locations in Spain and the Netherlands. Most of the pollen grains from the sample from Leiden, the Netherlands
were identified by the deep learning model as Urtica, with only a low number of images identified as Parietaria.
While Parietaria plants are relatively abundant around the sampling location in Leiden and were flowering on
the chosen date, its pollen is most likely simply outnumbered by the much larger number of nettles in the area.
For Lleida (Catalonia), where pellitory plants are abundantly present, Parietaria pollen grains dominated the
assemblage, while the sample from Vielha showed a mixed assemblage. The number of unknown images was the
highest for the sample from Vielha (11.5%), which is most likely the result of the presence of more debris on the
pollen grains making a certain identification impossible. In all aerobiological slides, debris on top of or below
the pollen grains was observed in different focal plains. Nevertheless, the model still successfully classified most
of the pollen grains, and in most cases with high confidence (Supplementary Table S1). This shows the potential
broad application of this method and opens up opportunities to study both seasonal as well as long-term yearly
dynamics of Parietaria versus Urtica abundance of airborne pollen, as well as using this method to distinguish
other morphologically similar species of allergenic importance from different families (e.g. Betulaceae, Amaran-
thaceae, Oleaceae). To further improve the generalization of this classification system, future work will focus on
increasing the amount of training images from variable sources. Furthermore, more elaborate techniques like
regularization will be considered to improve the variability in the image dataset 40. Since for allergenic pollen
monitoring reducing the amount of false negatives (i.e. increasing recall) is particularly important, more models
will be tested to identify the best recall values.
A limitation of our method is that currently pollen from aerobiological slides have to be located manually. It
has already been shown that automating this process is feasible, e.g. using a deep learning a pproach41. In other
systems like the commercially available Classifynder system, pollen are automatically located and imaged using
darkfield imaging after which a simple neural network classifies the pollen42. This is also the case for the BAA500
system used by, e.g. Oteros et al.43, that was particularly developed for recognizing and classifying unacetol-
yzed airborne pollen for hay fever predictions. Lastly, using a CNN and digital holography on pollen grains
directly from the air (i.e. unacetolyzed) showed great promise in quantifying pollen automatically to the family
level44. While these systems achieve automated and accelerated pollen counting, our method instead particularly
increases the accuracy of information useful for allergy prevention by making it more specific.
Conclusions
In conclusion, using a combination of an image-processing workflow and a sufficiently trained deep learning
model, we were able to differentiate unacetolyzed pollen grains from two genera and one species in the nettle fam-
ily. These are genera that are indistinguishable with current microscopic methods but possess different allergenic
profiles, and thus the ability to differentiate them is of medical significance. Our method can be more broadly
applied to distinguish pollen from similarly challenging allergenic plant families and can help in producing more
accurate pollen spectra to improve the forecasts for allergy sufferers.
Material and methods
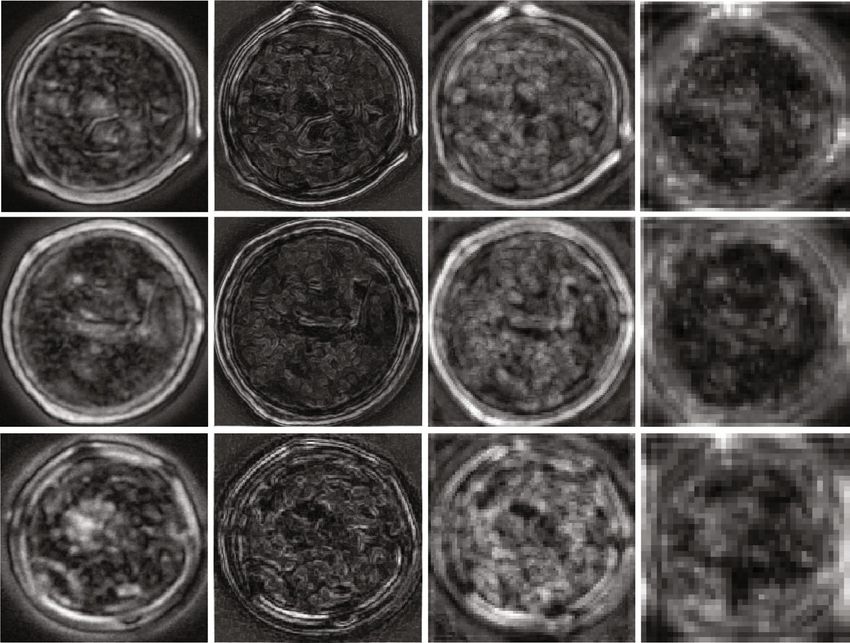
A flowchart has been constructed to visualize all the steps in the Urticaceae pollen image classification process
(Fig. 3). Details on the individual steps are described in this section.
Scientific Reports | (2021) 11:11357 | https://doi.org/10.1038/s41598-021-90433-x 5
Vol.:(0123456789)www.nature.com/scientificreports/
Collection of pollen. Pollen grains were collected from all five species of Urticaceae found in the Nether-
lands. In the genus Urtica, the native species U. dioica L. (common nettle) and U. urens L. (small nettle) are ubiq-
uitous in nitrogen rich moist areas, ditches, woodlands, disturbed sites and roadsides. The exotic Mediterranean
species U. membranacea is rarely encountered, though is included in this study since its range is expected to
increase due to the effects of global warming. The genus Parietaria is represented in the Netherlands by the spe-
cies P. judaica L. (pellitory of the wall) and P. officinalis L. (upright pellitory) that both occupy rocky substrates,
mainly in the urban environment15. Moreover, P. judaica has shown a big increase in abundance over the past
decades, e.g. in the Netherlands (Supplementary Fig. S1), but also in many other parts of the world.
Pollen from all Urticaceae species was either freshly obtained or collected from herbarium specimens (Natu-
ralis Biodiversity Center). Fresh material was collected with the help of an experienced botanist (Barbara Graven-
deel) in the direct surroundings of Leiden and The Hague during the nettle flowering seasons of 2018 and 2019.
All newly collected plant specimens have been vouchered and were deposited in the herbarium of the Naturalis
Biodiversity Center (L.3993376–L.3993387) (Supplementary Table S2). Original taxonomic assignments for
the herbarium specimens were verified using identification keys and d escriptions45. A minimum of four differ-
ent plants were sampled per species, from different geographical locations to cover as much of the phenotypic
plasticity in the pollen grains as possible and reflect the diversity found on aerobiological slides.
To produce palynological reference slides, thecae of open flowers were carefully opened on a microscopic slide
using tweezers. A stereo microscope was mounted in a fume hood to avoid inhalation of the severely allergenic
pollen of Parietaria species. Non-pollen material was manually removed to obtain a clean slide. The pollen grains
were mounted using a glycerin:water:gelatin (7:6:1) solution with 2% phenol and stained with Safranin (0.002%
w/v). These represent the same conditions as used in airborne pollen analysis on pollen collected with a Hirst
type sampler. Cover slips were secured with paraffin.
Pollen image capture. A total of 6472 individual pollen grains were scanned from the five different species
of Urticaceae. The number of images for each species varied between 1055 and 1670 (Supplementary Table S2).
The images were divided into three classes, namely Urtica (U. dioica + U. urens), Parietaria (P. judaica + P. offici-
nalis) and U. membranacea. The system used for imaging was a Zeiss Observer Z1 (inverted microscope) linked
to a Hamamatsu EM-CCD Digital Camera (C9100), located at the Institute of Biology Leiden (IBL). Grayscale
images were used, since the pollen was stained to increase contrast and not for species recognition.
The imaging procedure was as follows: on each microscope reference slide containing only pollen of one
species of Urticaceae, an area rich in pollen was identified by eye and this area was automatically scanned using
multidimensional acquisition with the Zeiss software Zen BLUE. For areas that were very rich in pollen, a user-
defined mosaic was created consisting of all the tiles to be scanned (e.g. 20 × 20 tiles), while a list of XY positions
was used for microscopic slides less rich in pollen. Because pollen grains are 3-D shapes, catching all important
features can only be achieved using different focal levels, so-called ‘Z-stacks’. A total of 20 Z-stacks were used in
this study with a step size of 1.8 µm. The settings used for scanning were a Plan Apochromat 100× (oil) objective
and numerical aperture 0.55 with a brightfield contrast manager. To maintain similar conditions in the image
collection process, the condenser was always set to 3.3 V with an exposure time of 28 ms.
Reference pollen image library. All images were post-processed in ImageJ v1.52a (Fiji)46 using the script
Pollen_Projector (https://github.com/pollingmarcel/Pollen_Projector). The input for this script is a folder con-
taining all raw pollen images (including all Z-stacks), and the output is a set of projections for each individual
pollen grain that are subsequently used as input for the deep learning model.
Pollen_Projector identifies all complete, non-overlapping pollen grains and extracts them as stacks from the
raw Z-stack. This is achieved using binarization on the raw images to detect only those rounded objects with a
circularity > 0.3 and a size larger than 5 µm. Out-of-focus images within each group of 20 Z-stack slices were
removed using a threshold for minimum and maximum pixel values. The conventional input of a convolutional
neural network is a three-channel image. In colour images RGB channels are commonly used, but since we use
grayscale images, three different Z-stack projections were chosen to represent the three different channels. The
projections used are Standard Deviation, Minimum Intensity and Extended Focus. Standard Deviation creates
an image containing the standard deviation of the pixel intensities through the stack, where positions with
large differences appear brighter in the final projection. Minimum intensity takes the minimum pixel value
through the stack and uses that for the projection. Finally, the Extended Focus projection was created using the
‘Extended_Depth_of_Field’ ImageJ macro of Richard Wheeler (www.richardwheeler.net)47. This macro takes
a stack of images with a range of focal depths and builds a 2D image from it using only in focus regions of the
images. A schematic overview of the processes behind the Pollen_Projector script is shown in Supplementary
Fig. S2. Finally, to keep the original size information of the pollen grains they were inserted into a 276 × 276 frame.
Convolutional neural networks. Convolutional Neural Networks (CNNs) are widely used in the field
of computer vision for image classification, object detection, facial recognition, autonomous driving, etc. For
this study we used the VGG16 network48, MobileNetV149 and MobileNetV250 in Keras51. Compared with tradi-
tional neural networks and shallow convolutional neural networks, VGG16 has deeper layers that extract more
representative features from images (Fig. 2a). In contrast, MobileNets are small low-power models that offer a
time-efficient alternative. A feature extractor and classifier are two key structural parts of the CNN that per-
form the classification task. The VGG16 network contains 13 convolutional layers that form five blocks, which
generate features from images in the feature extraction phase. Subsequently, three fully connected (FC) layers
were built and added to the convolutional layers to classify the different classes (Supplementary Fig. S3). The
MobileNetV1 uses depth-wise separable convolutions to build light weight deep neural networks. It has 28 lay-
Scientific Reports | (2021) 11:11357 | https://doi.org/10.1038/s41598-021-90433-x 6
Vol:.(1234567890)www.nature.com/scientificreports/
Figure 3. Flowchart showing the pollen image classification process. (a) Reference pollen image capture using
the custom Fiji macro Pollen_Projector. (b) Images were inserted into a fixed frame and split into training and
testing sets. The training set was used for cross-validation and data augmentation (flip, brightness) so as to train
the CNNs VGG16, MobileNetv1 and MobileNetv2. Results from the models trained from scratch are compared
to results from transfer learning on pre-trained models. (c) Images from before unseen unknown Urticaceae
pollen grains are fed to the resulting classifier. Created using https://app.diagrams.net/.
Scientific Reports | (2021) 11:11357 | https://doi.org/10.1038/s41598-021-90433-x 7
Vol.:(0123456789)www.nature.com/scientificreports/
ers in total. A final average pooling reduces the spatial resolution to 1 and connected with FC and Softmax layer
for classification49. MobileNetV2, which has 53 layers, is an improved version of MobileNetV1 by introducing
inverted residual structure and linear bottleneck l ayers50. MobileNetV2 is more accurate than MobileNetV1 and
can be much faster. We trained classification models based on aforementioned CNNs using our pollen image
dataset.
During the training process, the initial parameters of convolutional layers were derived from the pre-trained
network on the ImageNet dataset. Subsequently, the convolutional layers and the following fully connected layers
were further fine-turned based on our own image dataset so as to classify the different classes. The pre-trained
models were compared to models trained from scratch. In order to avoid overfitting, we compared the results of
five- and tenfold cross-validation in the training process. For fivefold cross-validation the pollen image dataset
is split into a training and validation data set in the ratio 80/20 while this is 90/10 for tenfold cross-validation.
For each fold, the number of epochs was set to 30. The accuracy of the model converged at this point and the
model is therefore found not to be overfitting (Supplementary Fig. S4).
In order to quantify model accuracy, several commonly used performance measures were used:
TP
precision =
TP + FP
TP
recall =
TP + FN
precision ∗ recall
F1score = 2 ∗
precision + recall
TP + TN
CCR =
TP + TN + FP + FN
where TP refers to True Positives, TN to True Negatives, FP to False Positives and FN to False Negatives. Recall
is the number of True Positives divided by the total number of elements that belong to the correct class, which
is the sum of the True Positives and False Negatives. The F1-score is the weighted average of the precision and
recall. The correct classification rate (CCR) reflects the accuracy of the model. The values represent the average
weighted by the number of images in each class.
Data augmentation. A large number of images for each class is required to train a deep learning model,
as the performance will increase when more variation is fed to the model. Due to the nature of the images inves-
tigated in this study, the model was sensitive to small changes, since the differences between the pollen grains
are very subtle. Therefore, data augmentation was used to increase the variety of pollen images used as input.
We selected the augmentation options brightness and flip. These options were used since size and shape of pol-
len are key features for their identification, and using other augmentation options would artificially change the
original morphology of the pollen grains. Brightness range was set from 0.1 to 2, with < 1 corresponding to a
darker image and > 1 to a brighter image. Horizontal- and vertical flip were also applied randomly (Supplemen-
tary Fig. S5). In addition, we applied L2 regularization and dropout in our neural network structures to prevent
overfitting.
Test cases. For each aerobiological sample an area representing 10% of the total deposition area was
scanned manually for Urticaceae pollen grains (i.e. eight full transects at 100× magnification) resulting in 112
pollen grains from the sample from Leiden (LUMC, the Netherlands), 63 from Lleida and 26 from Vielha (both
ICTA-UAB, Catalonia, Spain). One aspect of the Catalonian aerobiological samples was the presence of pollen
from families that produce pollen similar to Urticaceae, that are rarely encountered in the Netherlands. These
included Humulus lupulus L. (Cannabaceae) and Morus sp. (Moraceae) which were not included in our training
dataset. These can be distinguished from Urticaceae, however, in the case of H. lupulus by their much larger size
(up to 35 µm) and the very large onci and, in the case of Morus by the more ellipsoidal shape. These pollen grains
were removed from the dataset before they were fed to the CNN for classification.
Data availability
All data generated or analyzed during this study are included in this published article (and its “Supplementary
Information” files). Raw pollen images can be made available upon request.
Received: 26 November 2020; Accepted: 4 May 2021
References
1. Bieber, T. et al. Global Allergy Forum and 3rd Davos Declaration 2015: Atopic dermatitis/Eczema: Challenges and opportunities
toward precision medicine. Allergy 71, 588–592 (2016).
2. Reitsma, S., Subramaniam, S., Fokkens, W. W. & Wang, D. Y. Recent developments and highlights in rhinitis and allergen immu-
notherapy. Allergy 73, 2306–2313 (2018).
3. Johansson, S. & Haahtela, T. World Allergy Organization guidelines for prevention of allergy and allergic asthma. Int. Arch. Allergy
Immunol. 135, 83–92 (2004).
Scientific Reports | (2021) 11:11357 | https://doi.org/10.1038/s41598-021-90433-x 8
Vol:.(1234567890)www.nature.com/scientificreports/
4. Karatzas, K. D., Riga, M. & Smith, M. Allergenic Pollen 217–247 (Springer, 2013).
5. Geller-Bernstein, C. & Portnoy, J. M. The clinical utility of pollen counts. Clin. Rev. Allergy Immunol. 57, 340–349 (2019).
6. Hirst, J. M. An automatic volumetric spore trap. Ann. Appl. Biol. 39, 257–265 (1952).
7. Beug, H.-J. R. Leitfaden der Pollenbestimmung für Mitteleuropa und angrenzende Gebiete. Verlag Dr. Friedrich Pfeil (2004).
8. Ziello, C. et al. Changes to airborne pollen counts across Europe. PLoS ONE 7, e34076. https://d oi.o
rg/1 0.1 371/j ourna l.p
one.0 0340
76 (2012).
9. Erdtman, G. The acetolysis method-a revised description. Sven. Bot. Tidskr. 54, 516–564 (1960).
10. Jones, G. D. Pollen analyses for pollination research, acetolysis. J. Pollinat. Ecol. 13, 203–217 (2014).
11. Tiotiu, A., Brazdova, A., Longé, C., Gallet, P., Morisset, M., Leduc, V., Hilger, C., Broussard, C., Couderc, R., Sutra, J. P. & Sénéchal,
H. Urtica dioica pollen allergy: Clinical, biological, and allergomics analysis. Ann. Allergy Asthma Immunol. 117, 527–534 (2016).
12. D’Amato, G. & Liccardi, G. Pollen-related allergy in the European Mediterranean area. Clin. Exp. Allergy 24, 210–219. https://doi.
org/10.1111/j.1365-2222.1994.tb00222.x (1994).
13. Ciprandi, G., Puccinelli, P., Incorvaia, C. & Masieri, S. Parietaria allergy: An intriguing challenge for the allergist. Medicina 54,
106 (2018).
14. Bass, D. & Bass, D. Parietaria judaica L. A cause of allergic disease in Sydney. A study of habit and spread of the weed. Rev. Pal-
aeobot. Palynol. 64, 97–101 (1990).
15. Fotiou, C., Damialis, A., Krigas, N., Halley, J. M. & Vokou, D. Parietaria judaica flowering phenology, pollen production, viability
and atmospheric circulation, and expansive ability in the urban environment: Impacts of environmental factors. Int. J. Biometeorol.
55, 35–50. https://doi.org/10.1007/s00484-010-0307-3 (2011).
16. D’Amato, G., Ruffilli, A., Sacerdoti, G. & Bonini, S. Parietaria pollinosis: A review. Allergy 47, 443–449. https://doi.org/10.1111/j.
1398-9995.1992.tb00661.x (1992).
17. Guardia, R. & Belmonte, J. Phenology and pollen production of Parietaria judaica L. in Catalonia (NE Spain). Grana 43, 57–64.
https://doi.org/10.1080/00173130410019244 (2010).
18. Corbi, A. L., Pelaez, A., Errigo, E. & Carreira, J. Cross-reactivity between Parietaria judaica and Parietaria officinalis. Ann. Allergy
54, 142–147 (1985).
19. Bousquet, J., Hewitt, B., Guerin, B., Dhivert, H. & Michel, F. B. Allergy in the Mediterranean area II: cross-allergenicity among
Urticaceae pollens (Parietaria and Urtica). Clin. Exp. Allergy 16, 57–64 (1986).
20. D’Amato, G. et al. Allergenic pollen and pollen allergy in Europe. Allergy 62, 976–990. https://doi.org/10.1111/j.1398-9995.2007.
01393.x (2007).
21. Rodríguez, A. M., Palacios, I. S., Molina, R. T. & Corchero, A. M. Urtica membranacea and the importance of its separation from
the rest of the Urticaceae in aeropalynological studies carried out in the Mediterranean region. Plant Biosyst. 140, 321–332 (2006).
22. Punt, W. & Malotaux, M. Cannabaceae, moraceae and urticaceae. Rev. Palaeobot. Palynol. 42, 23–44 (1984).
23. Holt, K. A. & Bennett, K. D. Principles and methods for automated palynology. New Phytol. 203, 735–742. https://d oi.o
rg/1 0.1 111/
nph.12848 (2014).
24. De Sá-otero, M. P., González, A., Rodríguez-Damián, M. & Cernadas, E. Computer-aided identification of allergenic species of
Urticaceae pollen. Grana 43, 224–230. https://doi.org/10.1080/00173130410000749 (2004).
25. Goncalves, A. B. et al. Feature extraction and machine learning for the classification of Brazilian Savannah pollen grains. PloS One
11 , e0157044. https://doi.org/10.1371/journal.pone.0157044 (2016).
26. Menad, H., Ben-Naoum, F. & Amine, A. Deep convolutional neural network for pollen grains classification. In: JERI (2019).
27. Sevillano, V. & Aznarte, J. L. Improving classification of pollen grain images of the POLEN23E dataset through three different
applications of deep learning convolutional neural networks. PloS One 13(9), e0201807. https://doi.org/10.1371/journal.pone.
0201807 (2018).
28. Sevillano, V., Holt, K. & Aznarte, J. L. Precise automatic classification of 46 different pollen types with convolutional neural net-
works. PloS One, 15(6), e0229751. https://doi.org/10.1371/journal.pone.0229751 (2020).
29. Daood, A., Ribeiro, E. & Bush, M. Pollen grain recognition using deep learning. In: Bebis G, Boyle R, Parvin B, Koracin D, Porikli
F, Skaff S, et al., editors. Advances in Visual Computing, vol. 10072, 321–330. (Springer International Publishing, Cham, 2016).
Available from: http://link.springer.com/10.1007/978-3-319-50835-1_30.
30. Punyasena, S. W., Tcheng, D. K., Wesseln, C. & Mueller, P. G. Classifying black and white spruce pollen using layered machine
learning. New Phytol. 196, 937–944. https://doi.org/10.1111/j.1469-8137.2012.04291.x (2012).
31. Kaya, Y., Pınar, S. M., Erez, M. E., Fidan, M. & Riding, J. B. Identification of Onopordum pollen using the extreme learning machine,
a type of artificial neural network. Palynology 38, 129–137. https://doi.org/10.1080/09500340.2013.868173 (2014).
32. Mahbod, A., Schaefer, G., Ecker, R. & Ellinger, I. Pollen grain microscopic image classification using an ensemble of fine-tuned
deep convolutional neural networks. arXiv preprint arXiv:2011.07428 (2020).
33. de Geus, A. R., AZ, B. C., Batista, M. A. & da Silva, S. F. Large-scale pollen recognition with deep learning. in 2019 27th European
Signal Processing Conference (EUSIPCO), 1–5 (2019).
34. Daood, A., Ribeiro, E. & Bush, M. Sequential recognition of pollen grain Z-stacks by combining CNN and RNN. in The Thirty-First
International Flairs Conference (2018).
35. Romero, I. C. et al. Improving the taxonomy of fossil pollen using convolutional neural networks and superresolution microscopy.
Proc. Natl. Acad. Sci. 117, 28496–28505 (2020).
36. Rodriguez-Damian, M., Cernadas, E., Formella, A., Fernández-Delgado, M. & De Sa-Otero, P. Automatic detection and classifica-
tion of grains of pollen based on shape and texture. IEEE Trans. Syst. Man Cybern. Part C Appl. Rev. 36, 531–542 (2006).
37. Daood, A., Ribeiro, E. & Bush, M. Classifying pollen using robust sequence alignment of sparse Z-stack volumes. in International
Symposium on Visual Computing, 331–340 (2016).
38. He, P., Glowacki, G. & Gkantiragas, A. Unsupervised representations of pollen in bright-field microscopy. arXiv preprint
arXiv:1908.01866 (2019).
39. Kadaikar, A., Pan, Y., Zhang, Q., Conde-Cespedes, P., Trocan, M., Amiel, F. & Guinot, B. Variable Complexity Neural Networks
Comparison for Pollen Classification. Int. J. Biol. Biomed. Eng. (2019).
40. Zeng, S., Zhang, B., Gou, J. & Xu, Y. Regularization on augmented data to diversify sparse representation for robust image clas-
sification. IEEE Transactions on Cybernetics. https://doi.org/10.1109/TCYB.2020.3025757 (2020).
41. Gallardo-Caballero, R. et al. Precise pollen grain detection in bright field microscopy using deep learning techniques. Sensors 19,
3583 (2019).
42. Holt, K., Allen, G., Hodgson, R., Marsland, S. & Flenley, J. Progress towards an automated trainable pollen location and classifier
system for use in the palynology laboratory. Rev. Palaeobot. Palynol. 167, 175–183 (2011).
43. Oteros, J. et al. Automatic and online pollen monitoring. Int. Arch. Allergy Immunol. 167, 158–166. https://doi.org/10.1159/00043
6968 (2015).
44. Sauvageat, E. et al. Real-time pollen monitoring using digital holography. Atmos. Meas. Tech. 13, 1539–1550 (2020).
45. Duistermaat, L. Heukels’ flora van Nederland 24th edition. Groningen/Utrecht, Noordhoff Uitgevers (2020).
46. Rasband, W. S. ImageJ. US National Institutes of Health, Bethesda, MD, U.S.A. Available: http://rsb.info.nih.gov/ij/ (1997–2006).
47. Wheeler, R. Extended Depth of Field. http://www.richardwheeler.net.
48. Simonyan, K. & Zisserman, A. Very deep convolutional networks for large-scale image recognition. arXiv preprint arXiv:1409.
1556 (2014).
Scientific Reports | (2021) 11:11357 | https://doi.org/10.1038/s41598-021-90433-x 9
Vol.:(0123456789)www.nature.com/scientificreports/
49. Howard, A.G., Zhu, M., Chen, B., Kalenichenko, D., Wang, W., Weyand, T., Andreetto, M. & Adam, H. Mobilenets: Efficient
convolutional neural networks for mobile vision applications. arXiv preprint arXiv:1704.04861 (2017).
50. Sandler, M., Howard, A., Zhu, M., Zhmoginov, A. & Chen, L.-C. Mobilenetv2: Inverted residuals and linear bottlenecks. In: Pro-
ceedings of the IEEE Conference on Computer Vision and Pattern Recognition, 4510–4520 (2018).
51. Chollet, F. K. Available at: https://github.com/fchollet/keras (2015).
Author contributions
M.P.: conceptualization, methodology, visualization, formal analysis, writing—original draft. C.L.: methodology,
software, formal analysis, data curation, investigation. L.C.: resources, formal analysis, software, supervision.
F.V.: validation, supervision, software. L.W., J.B.: resources, validation, writing—review and editing. C.D.L.:
resources, validation. J.W.: software, methodology. H.B.: funding acquisition, writing—review and editing. B.G.:
conceptualization, supervision, project administration, funding acquisition.
Funding
This work was financially supported by the European Union’s Horizon 2020 research and innovation programme
under H2020 MSCA-ITN-ETN Grant agreement No 765000 Plant.ID.
Competing interests
The authors declare no competing interests.
Additional information
Supplementary Information The online version contains supplementary material available at https://doi.org/
10.1038/s41598-021-90433-x.
Correspondence and requests for materials should be addressed to M.P.
Reprints and permissions information is available at www.nature.com/reprints.
Publisher’s note Springer Nature remains neutral with regard to jurisdictional claims in published maps and
institutional affiliations.
Open Access This article is licensed under a Creative Commons Attribution 4.0 International
License, which permits use, sharing, adaptation, distribution and reproduction in any medium or
format, as long as you give appropriate credit to the original author(s) and the source, provide a link to the
Creative Commons licence, and indicate if changes were made. The images or other third party material in this
article are included in the article’s Creative Commons licence, unless indicated otherwise in a credit line to the
material. If material is not included in the article’s Creative Commons licence and your intended use is not
permitted by statutory regulation or exceeds the permitted use, you will need to obtain permission directly from
the copyright holder. To view a copy of this licence, visit http://creativecommons.org/licenses/by/4.0/.
© The Author(s) 2021
Scientific Reports | (2021) 11:11357 | https://doi.org/10.1038/s41598-021-90433-x 10
Vol:.(1234567890)You can also read