Using Machine Learning to Demystify Startups Funding, Post-Money Valuation, and Success
←
→
Page content transcription
If your browser does not render page correctly, please read the page content below

Using Machine Learning to Demystify
Startups Funding, Post-Money Valuation,
and Success
Faculty Research Working Paper Series

Yu Qian Ang
Massachusetts Institute of Technology

Andrew Chia
Harvard University

Soroush Saghafian
Harvard Kennedy School

August 2020
RWP20-028

Visit the HKS Faculty Research Working Paper Series at:
https://www.hks.harvard.edu/research-insights/publications?f%5B0%5D=publication_types%3A121
The views expressed in the HKS Faculty Research Working Paper Series are those of the author(s) and do not
necessarily reflect those of the John F. Kennedy School of Government or of Harvard University. Faculty Research
Working Papers have not undergone formal review and approval. Such papers are included in this series to elicit
feedback and to encourage debate on important public policy challenges. Copyright belongs to the author(s). Papers
may be downloaded for personal use only.

 www.hks.harvard.edu
Using Machine Learning to Demystify Startups
Funding, Post-Money Valuation, and Success

Yu Qian Ang, Andrew Chia, and Soroush Saghafian

Abstract This chapter develops a novel approach to predict post-money valuation of
startups across various regions and sectors, as well as their probabilities of success.
Using startup funding data and descriptions from Crunchbase over a ten-year period,
we develop two models linking information such as description, region, and venture
capital funding to successful outcomes such as the achievement of an acquisition
or IPO. The first model utilizes latent Dirichlet allocation, a generative statistical
model in natural language processing, to organize the startups in the dataset into
clusters representing various sectors in the typical economy. An optimized distributed
gradient boosting regressor (XGBoost) is subsequently deployed to make use of the
resultant feature set to predict post-money valuation, with Bayesian optimization used
to find the optimal hyperparameters. Our model consistently achieves an accuracy
of over 95% on hold-out test sets, even with some continuous features removed. The
second model is a feed-forward neural network constructed using TensorFlow, with
the final layer providing probabilities of success. We find that post-money valuations
across regions are typically log-normally distributed, and startups in regions such
as San Francisco Bay Area typically witness higher valuations across most sectors.
We also find that startups operating in specific geographical regions and sectors
of economy (e.g., regions and sectors with higher number of investors) typically
have higher predicted probabilities of success. Our approach offers an empirical
perspective to startups, policymakers, and venture funds to benchmark and predict
valuation and success, clearing some opacity in the modern startup economy.

Ang Yu Qian
Massachusetts Institute of Technology, Cambridge MA 02139 e-mail: yuqian@mit.edu
Andrew Chia
Harvard University, Cambridge MA 02138 e-mail: andrewchia@g.harvard.edu
Soroush Saghafian
Harvard University, Cambridge MA 02138 e-mail: soroush_saghafian@hks.harvard.edu

 1
2 Yu Qian Ang, Andrew Chia, and Soroush Saghafian

1 Introduction

In the modern economy, startups and entrepreneurship are viewed almost synony-
mously, both resulting in technological innovation, economic growth, and jobs cre-
ation. Touted as both a panacea for solving unemployment and a catalyst for growth,
it is unsurprising that major cities are vying to be the next silicon valley, competing
to attract innovative ideas, entrepreneurial talents, technology-driven startups, and
venture capital (VC) funding. Globally, startups have become an increasingly promi-
nent feature in the world economy, both as creators of economic value and disruptors
of existing industries. They also play significant roles in major cities as important
drivers of innovation and sources of next-generation ideas, in a myriad of sectors,
including healthcare, manufacturing, transportation, logistics, and finance. Having
a vibrant startup ecosystem, thus, increases the attractiveness of a city for business
investments that spur job growth or rejuvenate existing industries. It is, therefore, un-
surprising that the popular media is often filled with against-all-odds success stories
of startups. But are such startup success stories really against-all-odds? Or are there
measurable factors that can help to correctly predict the future success of startups?

 In recent years, academic research aimed at understanding the dynamics of en-
trepreneurship have proliferated due to the growing role that startups play (Shane and
Ulrich, 2004), and financing/funding has been identified as a crucial factor in any
successful startup ecosystem. On one hand, startups—especially technology-based
firms—are often financially constrained (Carpenter and Petersen, 2002) requiring
significant funding for research and development, customer acquisition, and market-
ing, among others. Startups that are well funded or VC-backed have been reported to
outperform their non-funded counterparts (Gompers and Lerner, 2001; Denis, 2004).
Obtaining financing such as VC investments or follow-up funding also contributes
to the so-called “signalling effect” (Islam et al., 2018) helping early-stage startups
gain credibility as they progress from conceptualization to commercialization. On
the other hand, obtaining sufficient funding without early signs of traction is often
impossible. Funding and startup success, hence, can be viewed as a chicken and egg
problem.

 This chicken and egg problem makes it often difficult to comprehend valuation
of startups, and identify the key factors contributing to their success. For example,
will a startup with a given amount of Series A funding be eventually successful? Is
it possible to predict such startups likelihood of success with reasonable confidence,
given that success stories are typically rare events with about 90% of startups failing
on average? Answers to these types of questions can significantly assist various play-
ers and decision-makers in the startup ecosystem, including entrepreneurs, venture
capitalists, policymakers, and researchers. For example, VCs are often perceived as
entities that fill the void in the innovation and commercialization process. However,
to ensure viability, VCs need to generate consistently superior returns on investments,
a significant challenge given the inherently risky nature of early-stage companies.
Since as high as 75% of venture-backed deals typically fail to return the investment

Machine Learning and Startups’ Performance 3

(Hoque, 2020), VCs rely on a small number of portfolio investments to achieve out-
standing paybacks—enough to cover for losses and still produce substantiate profits.
Therefore, any data-driven method that can yield superior investment decisions can
be significantly valuable.

 In this study, we review the entrepreneurial ecosystems and take stock of the key
fundraising activities in major cities around the world. We then construct two models
using modern machine learning approaches to predict startups’ potential post-money
valuation and probability of success using a dataset of funding activities across dif-
ferent regions, sectors of the economy, and funding stages, observed over a 10-year
period (2009–2018).

 Our study makes several contributions to the existing literature on startup and
entrepreneurship. First, we examine the startup financing landscape in the context
of different geographical regions and funding stages. In the ubiquitous, globalized
nature of modern technology-based startups and their products and services, there
is a need for research to shed light on how fundraising activities vary across cities.
This will also be beneficial for startups seeking funding as part of their internation-
alization strategy, and for venture funds targeting specific geographical regions and
financing stages. We also provide insights into statistical aspects of funding raised in
different regions and sectors of economy, including their distributional properties.
Second, we make use of some machine learning approaches to develop strong pre-
diction models that can (a) augment the myriad analysis and benchmarking typically
done by venture funds, startups, or policymakers, and (b) serve as basis for further
academic studies.

 In what follows, we first review the startup financing landscape and introduce
our data set. We then describe the methodology and approach behind our machine
learning models, and discuss the insights gained by making use of them on our
data set. Finally, we conclude by (a) providing recommendations for various entities
involved in the startup ecosystem, including entrepreneurs and policymakers, (b)
identifying limitations of our work, and (c) summarizing potential avenues for future
work.

1.1 Financing

Funding is a vital resource for startups; financing and equity investments through
government grants, accelerators/incubators, angel investors, and venture funds are
key resources that can shape a startup’s development trajectory. These funds are typ-
ically utilized to support critical activities such as product development, marketing,
research and development, and staffing. Recognizing the importance of financing,
governments and policymakers around the world have developed their own fund-
ing programs, such as independent government-sponsored funds (Alperovych et al.,

4 Yu Qian Ang, Andrew Chia, and Soroush Saghafian

2015), co-investment/co-financing vehicles, and grants, among the many instruments
designed to catalyze the startup ecosystem. These accompany private entrepreneurial
investments by venture capitalist, corporate venture capital funds, startup accelera-
tors/incubators and angels, as well as relatively newer financing modalities such as
equity crowdfunding (Drover et al., 2017). Naturally, most of the financing activities
gravitates and converges towards major cities. The geographical region in which a
startup is located, hence, can play an important role in the investment amounts it can
attract.

 Besides the geographical region, the investment amounts a startup can attract
typically vary significantly across funding stages. In most geographical regions and
entrepreneurial ecosystems, seed funding is usually the first institutional funding
received by a startup, although many venture funds are now looking at pre-seed due
to the competitive nature of seed investments. The name of this round, seed funding,
is self-explanatory: seed funding is used to take a startup from ideation to some
early traction, such as initial product development, market research, or validation for
product-market fit. A seed funding round typically ranges between $100,000 to $2
million, depending on the type of startup and the geographical region. The typical
valuation for a startup raising seed ranges between $3 million and $6 million (Reiff,
Nathan, 2020). Unfortunately, many startups run out of seed funding before they
can gain sufficient traction. For example, data from the market research firm CB
Insights obtained by tracking a cohort of 1,100 startups that raised seed rounds in the
United States shows that less than 50% managed to raise a second round of funding.
Furthermore, only 15% of these startups eventually raised a fourth round (which
corresponds to Series C), and 67% either ended up dead or became self-sustaining
(Insights, 2017).

 Once a seed stage startup gains sufficient traction—measured in terms of com-
mon key performance indicators such as revenue or user acquisition—it moves to
raise Series A funding. In this round, startups are expected to have a viable busi-
ness model and sufficient traction, since investors want to assure more substantive
development and growth. As the name suggests, series funding, consists of a series
of startup funding rounds that follow one after the other (Yuen, 2020), generally
with increased valuation in each subsequent round. Typical rounds include Series
A, B, C, D and sometimes E and F, and these rounds of funding is typically raised
through venture capital firms (or other institutional investors). The different rounds
are intended to also reflect the startup’s status, performance, and valuation (Williams
et al., 2013). A prospering and well-performing startup will have its company stock
valued higher in a Series B round than A, and higher still in a Series C round. A
startup not performing well may still obtain Series financing rounds, but subsequent
Series rounds will often value the company at a lower stock price (a “downround”).
Currently, the mean Series A funding round is valued at around $10 to $15 million
in the United States, a figure that has been growing steadily (Fundz Research, 2020).
The mean Series B round currently stands at around $32 million, with a median
pre-money valuation of $58 million (Fundz Research, 2020). However, these overall
Machine Learning and Startups’ Performance 5

averages are highly contextualized and differ significantly across countries, different
regions (even within the same country), and startup types.

 Although the exact juncture is not specifically defined, typically after the second
and/or third capital injection, startups enter a growth stage where funding serves to
propel rapid growth and expansion rather than ignition. This usually entails interna-
tionalization (e.g., expansion to addition markets), diversification of product lines,
aggressive marketing, or new manufacturing and production locations. With a com-
mercially viable product and product-market-fit, a startup at this stage should have
a good source of revenue and continue to attract new users/customers at breakneck
speed. Very few startups eventually reach the Series D stage, and the amount raised
by them as well as their valuations vary widely among them.

 Finally, mezzanine financing and bridge loans are hybrid loan and equity financing
mechanisms that prepare the startup for the final push for an exit. Mezzanine financing
is typically perceived as being riskier than other types of startup financing due to
higher interest rates. An initial public offering (IPO) is often the final stage of funding
that a startup goes through before it becomes an established company. A startup may
also be acquired along the way, regardless of funding stage, especially if it has new
technologies or has established significant user base or data that are of high value to
the acquirer.

1.2 Post-Money Valuation

In the startup ecosystem, valuation is the process of quantifying the worth of a com-
pany at specific junctures. Valuation is important to founders for various reasons,
including the fact that it determines the amount of equity they must give to investors
in exchange for funds. Similarly, for investors, valuation helps to set the shares they
should receive in lieu of their investments during a financing round (Miloud et al.,
2012).

 Valuation often has two stages: pre-money and post-money valuation. Pre-money
valuation typically refers to the value of a company before–and not including–the
latest funding round in question. Thus, pre-money valuation can be roughly de-
scribed as how much a startup is worth prior to the current round of investments.
Post-money valuation, however, refers to the value of the startup after receiving in-
vestments (Frei and Leleux, 2004). Both pre- and post-money valuation are usually
affected by a variety of factors, including the sector of the economy the startup
belongs to, its technology, revenue, reputation, and level of traction. Valuation meth-
ods can be broadly grouped into two main categories: qualitative and quantitative.
The former—qualitative method—is more prevalent in assessing early-stage star-
tups due to the lack of sufficient information at that point early on. The—quantitative
method—is used more often in later stages, as more information (e.g., financial)
6 Yu Qian Ang, Andrew Chia, and Soroush Saghafian

becomes available at such stages.

 One common method in valuation is the discounted cash flow method (Festel
et al., 2013), which estimates how much cash flow the company is slated to produce.
This estimation is obtained by making use of a reasonable, expected rate of invest-
ment return. A higher discount rate is typically associated with startups that have
higher risks. This method relies partly on an investment analyst’s ability to make
sound and accurate assumptions on a startup’s growth trajectory. A second popular
method, which is usually utilized for pre-revenue and early-stage startups, is the
Berkus Method, named after investor David Berkus (Berkus, 2016). This approach
makes use of a general rule of thumb to estimate the value of the startup, since current
pre-revenue forecasts rarely turned out to be accurate. Other commonly used meth-
ods include the First Chicago method, the venture capital method, the Comparables
method, the Book Value method, the Scorecard method, and the Risk Factor Summa-
tion method (Nasser, 2017). As many valuation exercises are subjective, especially
in early-stage investment, and the exact method utilized are often undisclosed, we
avoid developing models that rely on any of these methods of valuation. Instead,
we make use of machine learning algorithms and train them on actual post-money
values in our data. These algorithms then learn to predict the post-money valuation
of startups using their early stage raw data.

1.3 Success

The definition of a successful startup is in general elusive and subjective. For in-
vestors, however, the notion of success is relatively straightforward, because they
usually value return on investment. Thus, from an investor’s perspective, the holy
grail is a profitable exit, such as a successful acquisition or IPO. An exit is also
often the only realistic way for professional or institutional investors to significantly
profit from an investment. However, success is more complicated from the founders’
perspective. Some founders, and especially serial entrepreneurs, seek financial gain,
and pursue profitable exits after gaining significant trajectories. Others value success
on more introspective terms, such as creating social good. Moreover, there can be a
long incubation time between the founding of a startup and its acquisition or IPO.
Thus, labelling startups that are on their way to success but have not achieved it as
unsuccessful is often an unfair assessment of their potential. These make studying
success among startups a perplexing task.

 For the goals of this study, we start by considering the conventional, investor-
based definition of success: whether a startup will be acquired or will lunch IPO.
We then expand our definition of success to also include startups that are able
to raise follow-on funding amounts that are greater than their previous funding
rounds, since such startups tend to grow over time. We make use of this definition of
success to train a neural network to classify startups into two categories: successful
Machine Learning and Startups’ Performance 7

and unsuccessful. This classification is done based on predicting the probability of
success using features such as geographic region, sector, stage, and funding, among
others. Once it is trained, our neural network algorithm is able to accurately predict
if a startup (not included in the training data) will eventually be successful given its
features.

2 Data

The primary dataset for this study comprises startup funding instances obtained
from Crunchbase, with supplementary data on the companies, IPOs, and acquisi-
tions. Crunchbase is a platform that aggregates business information about private
and public companies. Originally built to track startups, Crunchbase now contains
information on startups, venture funds, and companies on a global scale. Crunch-
base sources their data through many channels, including an in-house data team, their
venture program, and community. We accessed Crunchbase data using a REpresen-
tational State Transfer (REST) Application Programming Interface (API) user-key,
to access compressed Tape Archive Files (TAR) that contains various raw data on
companies and funding rounds globally, starting from 1915. The data from various
files were matched using the unique identifier generated for each startup and investor.
The resultant dataset reflects a ten-year period from 2009 to 2018, with a total of
290,707 observations of startups funding instances around the world. From these
290,707 observations, we retained 46,025 observations after (a) filtering for empty
fields, mismatching, or corrupted data, and (b) focusing on observations related to
one of the top 15 cities that have the highest number of startups. These allowed us
to maintain a reasonable number of datapoints in each region, and consequently,
perform analysis that are robust (and not affected by issues such as sparsity).

 While there are other platforms and databases that tracks startup financing, in-
cluding Pitchbook, AVCJ, and CB Insights, the data aggregating methodologies used
in them are different. It is, therefore, unfeasible to simply merge data from different
sources, especially if consistency is to be maintained. Furthermore, global financing
data can never be complete in practice, since a significantly number of transac-
tions are undisclosed, and many startups operate in stealth mode for confidentiality.
Therefore, we consider our Crunchbase dataset as relatively representative, even as
the final dataset, after data wrangling, is a relatively small sub-sample of the entire
startup population.

 Figure 1 shows the top 15 major cities with the highest number of startups in our
dataset. In these cities, most startups are still operational, ranging from 83% of the
startups in the San Francisco Bay Area to 92% in New Delhi. Figure 2 shows the
status of startups in these major cities. Unsurprisingly, we see that San Francisco
Bay Area not only has the largest number of startups, but also the highest percentage
of startups that are either acquired or have launched IPO (11%). Other cities with
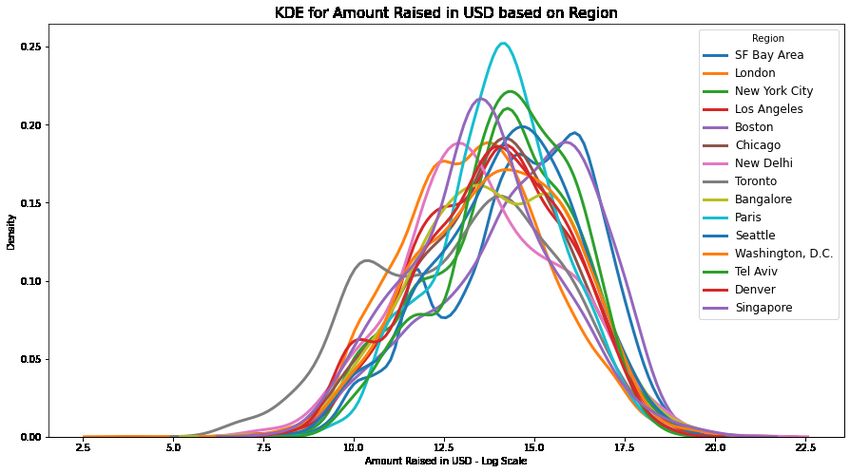
8 Yu Qian Ang, Andrew Chia, and Soroush Saghafian

relatively high percentages of startups that were acquired or launched IPO include
Toronto (11%) and Paris (10%).

 Fig. 1: Top 15 cities with the highest number of startups in our dataset

 Our preliminary exploratory analysis of the investment stage of startups revealed
over 25 funding stages in our dataset, ranging from pre-seed stage to Series J and
even post-IPO. Much of the data in many regions and in the later stages are sparse,
containing very few data points. For consistency and rigor of our machine learning
models, we used a subset of the overall data comprising funding information for the
top 15 regions, as well as the following stages: grant, angel round, seed, series A,
series B, series C, series D, and series E. Figure 3 shows the amount of funding
raised based on region and funding stage.

 To better understand the nature and properties of post-money valuations, we as-
sessed their distributional properties across regions and funding stages using kernel
density estimation (KDE). KDE is a non-parametric method commonly employed
to approximate the probability density function (PDF) of continuous values (Parzen,
1962) such as funding (Carayannis et al., 2018) or startup valuation (Quintero, 2019).
Figures 4 and 5 show the KDE for the amount raised (on a logarithmic scale) based
on region and funding stage respectively. Funding amount raised and post-money
valuation in venture capital are typically power-law distributed (Korver, 2018), and
may be subject to the Babe Ruth effect (Dixon, 2015). While most funding raised
and valuations are situated at lower values, there may exists a long tail of exception-
ally high funding amount raised or post-money valuations (Quintero, 2019). Thus,
the natural logarithm of these quantities is typically normally distributed. This also
Machine Learning and Startups’ Performance 9

 Fig. 2: Status of startups in the top 15 cities

 Fig. 3: Funding amount (USD) based on stage and region
10 Yu Qian Ang, Andrew Chia, and Soroush Saghafian

exemplifies the known fact that returns are highly concentrated on “home run” in-
vestments.

 Fig. 4: KDE for funding amount raised (logarithmic scale) based on region

Fig. 5: KDE for funding amount raised (logarithmic scale) based on funding stage
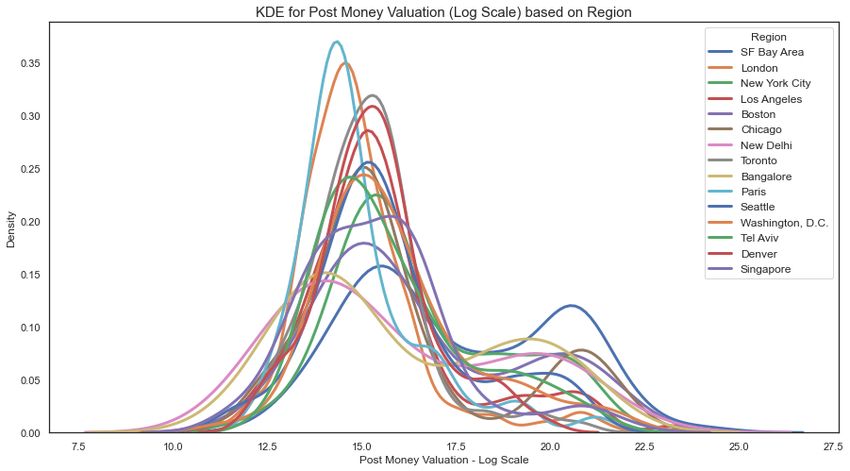
Machine Learning and Startups’ Performance 11

Fig. 6: Heatmap for funding amount (logarithmic scale) based on region and funding
stage

 Figure 6 illustrates the heatmap (in logarithmic scale) of funding stage and re-
gion. The darker colors represent higher funding amounts raised. As can be seen, the
early stage rounds are approximately similar, with New Delhi having more funding
in terms of grants. Boston and San Francisco have more Series A funding, while
Chicago, London, Singapore, and Bangalore have higher Series E funding compared
to other cities. However, since the heatmap aggregates total funding over stages, the
results could be dominated by outliers, e.g., a few companies raising significantly
higher funding of startups based on the region and funding stage, respectively.

 Figures 7 and 8 present the KDE of post-money valuations. First, most regions
have a bimodal log-normal distribution, but it is evident that the second mode in
San Francisco Bay Area has relatively higher density than the other regions. Sec-
ond, there is significant overlap in post-money valuations between angel and seed
rounds, as well as series C, series D, and series E. This suggests that while the dif-
ferentiations between seed, and A and B funding rounds seem to be relatively clear,
subsequent rounds for growth stage companies are relatively difficult to differenti-
ate based on valuation alone. Quintero (2019) also provides a similar observation
regarding the overlap between post-money valuation of startups in angel, pre-seed,
and seed rounds. As Quintero (2019) discusses, this phenomenon is likely due to the
12 Yu Qian Ang, Andrew Chia, and Soroush Saghafian

changing definition of a seed round, and/or more institutional VCs participating in
early stage pre-seed rounds.

 Fig. 7: KDE for post-money valuation (logarithmic scale) based on region

 Fig. 8: KDE for post-money valuation (logarithmic scale) based on funding stage
Machine Learning and Startups’ Performance 13

 Finally, Figure 9 illustrates the relationship between the post-money valuations
(logarithmic scale) and the funding amount raised (logarithmic scale) separately for
each region. Beyond the power-law connection, we observe from Figure 9 that in
general there is a positive relationship between the post-money valuation and funding
amount, and that the magnitude of this relationship is relatively consistent across
different regions.

Fig. 9: Plots of funding amount raised with post-money valuations based on region,
both on logarithmic scale
14 Yu Qian Ang, Andrew Chia, and Soroush Saghafian

3 Methodology

3.1 Sectoral Clustering – Latent Dirichlet Allocation

While the dataset provides us with information on the sectors of economy each
startup belongs to, the data in the category and description columns are manually
entered or selected, with inconsistencies across the entire dataset. To overcome this
issue, we employed a commonly used unsupervised learning approach in Natural
Language Processing (NLP), topic modelling, and related fields: the Latent Dirichlet
Allocation (LDA) method (Blei et al., 2003). LDA was first used in the context of
population genetics (Pritchard et al., 2000). In machine learning, it is often viewed as
a generative probabilistic model of a collection of composites of discrete parts/data
such as text corpora. In particular, it is a three-level hierarchical Bayesian model,
where each item in a collection is modelled as a finite mixture over an underlying
set of topics, which is in turn modelled as an infinite mixture over an underlying set
of topic probabilities (Blei et al., 2003).

LDA Algorithm
 LDA (as introduced in Blei et al. 2003) involves the following generative process
for each document in a corpus:

1. Choose ∼ ( )
2. Choose ∼ ( )
3. For each of the words :
 a. Choose a topic ∼ ( )
 b. Choose a word from ( | , ), a multinomial probability conditioned
 on the topic and model parameter .

 In the context of topic modelling, the composites are typically documents and
the parts are words and/or phrase. Thus, LDA represents documents as mixtures
of topics that churn out observable words based on random variables drawn from
specific distributions (see the LDA algorithm above). For this study, we use LDA
to group the startups into various sectoral clusters, based on (a) keywords in their
categories or descriptions, and (b) probabilities of the key-words being associated
with specific sectoral clusters. The optimal number of clusters is decided based on
coherence scores for number of clusters (between 5 to 50). We then assign each
startup to a cluster based on the LDA results and keyword probability assignments.
Machine Learning and Startups’ Performance 15

3.2 Predicting Post-money Valuation – ElasticNet

ElasticNet (Zou and Hastie, 2005) is a regularized linear model that employs both
 1 -norm and 2 -norm penalization to achieve better mean-square prediction error
performance compared to either pure Least Absolute Shrinkage and Selection Oper-
ator (LASSO) or Ridge regression. We use it to form a baseline model for predicting
post-money valuations. The relative weight between 1 -norm and 2 -norm penaliza-
tion as well as the overall penalization factor in ElasticNet are hyperparameters that
we tune using 5-fold cross-validation.

3.3 Predicting Post-money Valuation–XGBoost

XGBoost (Chen and Guestrin, 2016), short for eXtreme Gradient Boosting, is a
recent optimized distributed gradient boosting technique that has been widely used
in applied machine learning and online data science competitions, especially for
structured or tabular data. XGBoost is an implementation of gradient boosted deci-
sion trees which is designed for enhanced speed and performance by making use of
parallel tree boosting.

 In this study, we deploy the XGBoost regressor to model the post-money valuation
of startups in logarithmic scale. The feature set includes sector (obtained from LDA),
region, funding amount raised, number of investors in the round, and funding stage
as well as engineered features representing lag and growth.

3.3.1 Hyperparameter Tuning for XGBoost Using Bayesian Optimization

Common techniques for obtaining optimal hyperparameters include random search
and grid search, but these techniques can be inefficient and slow. One reason is that
they typically do not take advantage of the information learned during previous opti-
mization rounds. For this study, we make use of Bayesian optimization (Snoek et al.,
2012), which constantly learns from previous optimization stages to find the best set
of hyperparameters. This gives Bayesian optimization the ability to require fewer
samples and iterations to obtain the best set of hyperparameter values compared to
some other methods (e.g., random search or grid search).

 Bayesian optimization involves constructing a posterior distribution that improves
as the number of observations grows. When used for hyperparameter tuning, the al-
gorithm gets closer to the optimized set of hyperparameter values as the parameter
space worth exploring shrinks. Bayesian optimization for hyperparameter tuning
takes into account the classic exploration versus exploration paradigm, and seeks
to balance needs between both. A typical method is to fit a Gaussian process to
the known samples for every iteration. The posterior distribution is then utilized to
16 Yu Qian Ang, Andrew Chia, and Soroush Saghafian

determine the next point to be explored.

 In our test runs, where we used Bayesian optimization on XGBoost, our models
generally converged in less than 10 iterations, compared with much longer search
durations for cross-validated grid-based or randomized search. The resultant model
accuracies were, however, approximately similar across cities. Nevertheless, we
chose Bayesian optimization instead of typical methods of tuning such as cross-
validated grid-based or randomized search due to its clear advantage in computational
efficiency.

3.4 Predicting Success – Neural Network

To predict success of startups, we make use of a feed-forward neural network and
train in it using our dataset. Mindful of the size our dataset, we restrict our neural
network to two hidden layers. We also employ drop-out layers (Srivastava et al.,
2014) between the dense layers to regularize our model and avoid over-fitting.

 To train our neural network, we use two measures of startup success (as noted
earlier). The first measure is based on whether a startup eventually make it to an
exit by being acquired or by launching IPO. However, we also recognize that many
startups in our study period may still be on their way being acquired or lunching
IPO. Thus, we augment our definition of success by considering startups that are
continuing to grow in terms of the amount of funding that they are able to raise.
This second definition of success covers all firms that meet the first definition (being
acquired or lunching IPO), but also includes all firms that have not exhibited signs
of stagnation.

4 Results

4.1 Sectoral Clustering

Our LDA model found 16 sectoral clusters to be the optimal number of clusters. Fig-
ure 10 provides a wordcloud visualization of each sectoral cluster using the Python
WordCloud package (Mueller, 2020). Words in this figure represent keywords with
the highest probability of being in each sector cluster (generated by the LDA analy-
sis) and the size of the font is proportional to this probability.

 The sectors obtained using LDA and visualized in Figure 10 are rather evident. For
example, sectoral cluster one comprises startups in retail, fashion, and e-commerce.
Similarly, sectoral cluster four comprises startups mainly in the domains of artificial
intelligence, machine learning, and data analytics, while sectoral cluster fourteen
Machine Learning and Startups’ Performance 17

Fig. 10: Wordcloud for sectoral clusters found, with the larger fonts representing
higher probabilities

comprises startups in medical technology, healthcare, and pharmaceuticals. How-
ever, since LDA is primarily an unsupervised approach, the results contain some
keywords which do not fit quite well in particular clusters. An example is the in-
clusion of the word “insurance” in sector cluster six, which comprises primarily
“energy” and “industrial” related startups.

 Figure 11 shows the topic model visualization using the pyLDAvis package. The
left visualization depicts the clustering of each of the topics, where the size of the
circle is proportional to overall prevalence of the topic in the corpus. The distance be-
18 Yu Qian Ang, Andrew Chia, and Soroush Saghafian

tween each of the topics is measured by calculating the Jensen-Shannon divergence,
a measure of similarity between two probability distributions. Multidimensional
scaling is used to project the distances onto two dimensions. It is desirable to have
little to no overlap of the topic circles. The visualization on the right depicts the most
important words of each topic.

 Fig. 11: pyLDAvis topic model visualization

4.2 Predicting Post-Money Valuation

Our ElasticNet model (tuned using cross-validation) chose an 1 -norm to 2 -norm
ratio of 1.0, effectively representing a LASSO regression model. In addition, it chose
a relatively low penalization rate of 0.00652. With these hyperparameters, the model
was able to achieve an excellent accuracy of 96.275% and a mean absolute error of
0.589 on our test (i.e., out-of-sample) data.

 We examined the coefficients of the predictors in our ElasticNet model to gain an
initial understanding of the predictors that were the most important for the model.
Figure 12 shows that (log) raised amount was the most decisive factor within the Elas-
ticNet model, followed by the investment type. We also observe that the later series
rounds types of investments have a positive association with post-money evaluation,
while the earlier rounds investments have a negative association. Furthermore, the
growth in raised amount as well as employee count seem to be positively associated
Machine Learning and Startups’ Performance 19

 Fig. 12: Top 10 ElasticNet coefficients by size

with post-money valuation. However, the size of the coefficients depicted in Figure
12 suggests that past performance and growth have a higher influence on the post-
money valuation of a startup compared to the startups size (measured by employee
count).

 Our tuned XGBoost model achieved an outstanding accuracy score of 96.45%
and low mean absolute error of 0.550 on our test (i.e., out-of-sample) data. Figure 13
shows the plot of the true values (logarithm scale) and predicted values (logarithmic
scale) in the test set (using our XGBoost model), with a high 2 value of 0.9 when
fitting a linear function. Our results indicate that our XGBoost model outperforms
the ElasticNet approach. The increased accuracy and decreased mean absolute error
achieved by the XGBoost model compared to ElasticNet suggest that the relationship
between post-money valuation and its determinants is rather complex and most likely
non-linear.

 Using our XGBoost model, we next generate insights into the most important
factors in predicting post-money valuation of startups. In Figures 14 and 15, we
illustrate a representative boosted tree and the feature importance of the predictors in
the model, respectively. These figures show that funding amount raised is the most
important predictor of post-money valuation, followed by the investor count. The
observation that funding amount raised is the most important feature is consistent
with the findings of our baseline ElasticNet model. The difference in second-most
important feature (i.e., investor count in the XGBoost model versus the investment
stage in the ElasticNet approach) could be due to a high correlation between invest-
20 Yu Qian Ang, Andrew Chia, and Soroush Saghafian

 Fig. 13: True versus model predicted values in the test set

ment stage and funding amount, which is accounted for in the XGBoost model in a
non-parametric manner.

 Finally, to test the robustness of our XGBoost model and its potential over-reliance
on particular predictor(s), we first removed the top continuous predictors, and reran
it.. Between several runs, the resultant model only showed an accuracy decline of
around 3% to 5%, with the LDA sectors remaining as the most important features.
The resultant plot of true and predicted values in our test data is shown in Figure
16, with a 2 of 0.8 for the fitted linear function. As can be seen form this figure,
the points are more widely scattered and dispersed across the values compared to
our original XGBoost model (see Figure 13, and compare with 16). Nonetheless, the
low level of degradation in predictive power suggests that our XGBoost model can
be used as an effective tool even in other datasets in which some of the important
variables are not available.
Machine Learning and Startups’ Performance 21

 Fig. 14: Boosted tree example

 Fig. 15: Feature importance of XGBoost model

4.3 Predicting Success

To test the performance of our neural network in predicating success, we first per-
formed a random training/validation split of 80-20 on our data. After training our
our neural network on the training part, we gauged its prediction accuracy on the
validation set. We observed an accuracy of 92.48% when we used the first, stricter
definition of success (i.e., defining success only based on acquisition or IPO). How-
ever, when we broadened the definition of success to startups that were still growing,
we observed a prediction accuracy (on the validation set) of 81.21%. This reduc-
tion in prediction accuracy highlights the challenge of evaluating startup success.
22 Yu Qian Ang, Andrew Chia, and Soroush Saghafian

Fig. 16: True versus model predicted values in the test set with top predictors removed

Specifically, focusing only on startups that eventually exit via an IPO or acquisition
makes it difficult to make use of data on early-stage startups, and broadening the
definition of success does not seem to help since the prediction performance suffers.
This alludes to our earlier discussion in Section 1.3 that startup success is typically
less straightforward to define.

5 Recommendations

In this section, we leverage our findings to provide broad recommendations for (a)
entrepreneurs, (b) venture capital or investors, and (c) policymakers or governments
seeking to improve the startup ecosystem. First, our results suggest that entrepreneurs
seeking to maximize their post-money valuation should avoid trend-chasing (e.g.,
Machine Learning and Startups’ Performance 23

targeting a specific sector of economy) and instead focus on ideas or efforts that can
generate the most amount of funding. Specifically, our findings suggest that trend-
chasing may not maximize post-money valuation: no specific sector of economy is
specifically significant in predicting post-money valuation, at least not compared to
the total funding and investor counts. Besides the idea behind the startup, our findings
suggest that fundraising efforts can also be significantly important in achieving high
post-money valuation. Startups that are unable to gain and maintain momentum via
fundraising activities are likely to suffer in their post-money valuation. Second, we
observe that the investor count has a significant impact on post-money valuation, as
exemplified by its high feature importance. A closer examination of some startups
which raised significant amounts of funding also suggests that having “branded”
investors can have a positive impact. This is most likely due to a “signaling effect:"
investors often follow their high profile counterparts, since financial commitments
from high profile investors are often interpreted by other investors as a sign of a
startups probable future success. Having a high profile investor on board or even
leading the round leads to an increased probability of success and higher expected
post-money evaluation. Finally, we also observe that there are significant agglomer-
ation effects from being in top startup regions such as the San Francisco Bay Area
or New York, although the effect of being in a particular region shows a diminishing
rate of return as one moves through the list of top performing cities.

 In the same vein as the above, we broadly recommend for startups to develop an
internationalization strategy and consider expanding internationally at a relatively
early stage, primarily for enhanced exposure, market access, and traction. It can be
inferred from our exploratory data analysis and findings that domestic markets in
most regions serve to be particularly advantageous only for certain sectors and for
startups of certain sizes (or at certain stages). With the increasingly open nature of
most startup ecosystems around the world, innovative companies backed by technol-
ogy will be able to gain foothold quickly in different regions that place particular
emphasis on the sector(s) that they belong to, and thereby obtain an early com-
petitive advantage. Domestically, startups should gain access to credible reference
customers in their respective sector(s) as early as possible, especially if they are
developing innovative products or providing innovative services that require early
adopters. Regions with a large base of multinational corporations and even small
and medium-sized enterprises in the same sector can provide the necessary network
effect to catalyze traction, which can in turn result in rapid revenue growth.

 On the contrary, we recommend that venture funds (especially those dedicated
to early stage startups) focus their investments on specific areas/sectors of interest
or expertise, rather than adopting a broad mandate which may potentially result in
“thinning out” and subsequently hurt returns. Venture funds can be broadly classi-
fied as generalist, thesis-driven or sector-focused. With the increased competition
across funding stages and regions, it may be advantageous—especially for early stage
funds—to be sector specific. This coincides with our observation and analysis that
apart from top startup hubs such as San Francisco Bay Area, different regions seem
24 Yu Qian Ang, Andrew Chia, and Soroush Saghafian

to “favor” different sectoral clusters. The key benefits of focusing on specific sectors
are threefold. First, sector-specific domain expertise and intelligence allow the fund
to source for higher quality deal flows, and maximize value capture with the same
dollar value. Within-sector network effects such as partnerships with corporates may
also give these funds an edge over broad-based generalist VCs, and provide the fund
an edge in sourcing for high potential startups to invest in. Second, unless the fund
has celebrity or renowned General Partners (GP) or investors, having sector-specific
domain intelligence and expertise will help the fund establish credibility and gain
confidence from Limited Partners (LP)—a factor crucial in the hyper-competitive
nature of this industry. Third, our feature importance analysis shows that the ability
to predict startup success does not improve when we broaden our definition of suc-
cess to take advantage of available data points related to early stage startups. This
suggests that it is difficult to assess the merits of early stage startups using purely
quantitative measures, which necessitates deeper subject matter or sectoral analysis.

 In providing recommendations for policymakers (and more broadly, governments)
we note that they often would like to develop vibrant ecosystems, boost job creation,
and catalyze economic growth. Thus, they typically seek to promote the creation or
attraction of startups that have high potential and can grow to provide substantial
employment and/or value-add activities. Considering this, our results have a few
implications for them. First, policymakers should consider setting up co-investment
instruments or mechanisms with the private sector—while allowing the private sec-
tor to take the lead in investing—especially in areas where there are gaps in specific
funding stages, or sectors which serve as important nodes linking various economic
activity or supply chains. Similarly, our KDE plots show that there is some overlap
between government grants and other funding mechanisms along the same angel and
seed stage(s). It can be a signal that government grants are directed to the same space
as private investments, which might not be the most efficient use of resources, and
might not result in desirable outcomes. It will be worthwhile for policymakers and
policy analysts to conduct further detailed analyses in this regard. Second, policy-
makers should design policy levers to further entrench well-performing (or priority)
sectors, and anchor major players in the domain, including not just multinational
corporations but also small and medium-sized startups with high-growth potential.
Combining the two recommendations, policymakers should develop a strategy or
implement a program to systematically cultivate top global entrepreneurial, tech-
nology, and investment talents, and attract them to establish startups or investment
vehicles. The incentives to do these do not necessarily have to be directly monetary.
For example, they could include a combination of market or technology access,
financing, network, or other forms of support.

 Finally, our findings on predicting post-money valuation indicate that in some
cases, there may exist a disconnect between startup size and valuation. This can have
a few different implications for public policy decisions depending on policymakers’
objectives. If policymakers want to attract and encourage startups as a means of job
creation, they must bear in mind that startups that generate the most jobs may not
Machine Learning and Startups’ Performance 25

necessarily be those that are the most valued by the market. On the other hand, if
their objective is to target high-value startups that can serve as anchors for a vibrant
startup ecosystem, policymakers must accept that such a targeting strategy may not
yield as many jobs, at least in the short-term.

6 Conclusions, Limitations, and Future Work

In this chapter, we analyzed the global startup landscape. We did so first by provid-
ing descriptive statistical analyses and visualizations, and then by building predictive
models using machine learning techniques. Our contribution lies in (a) a novel pro-
cessing of sectoral level data through collating text-based descriptions into sectors
of the economy, (b) making use of machine learning methods to predict post-money
valuation and startup success, and (c) identifying the most important predictors of
startups’ performance.

 Our machine learning models enable predicting (within reasonable confidence) a
startups post-money valuation and success based on various variables such as region,
sector, and funding amount raised. Through our analysis of variable importance, we
find that startups across different regions performed relatively similar in terms of
post-money valuation. Thus, region is not a significant predictor of startup perfor-
mance. In contrast, however, startups’ post-money valuations differ based on some
other important features. Specifically, our results indicate that two most important
predictors of post-money valuation are the amount of funding raised and investor
count. As is expected, we also observe that startups’ post-money valuation mildly
differ based on the sector of economy and the funding stage. However, we find that
these variables (sector of economy and funding stage) are not strong predictors of
future performance of startups.

 An entrepreneur, venture capital analyst, or policymaker can use our models to
predict the post-money valuation and success of a startup by simply specifying fea-
tures such as the region, sector, and funding amount raised. This prediction, in turn,
can be used to make better investment decisions, design more appropriate economic
policies, and/or implement superior evidence-based mechanisms that can boost the
overall startup ecosystem.

 In closing, we note that our work has some important limitations that future
research can address. First, as we noted earlier, measuring performance of startups,
defining what success is, and how it can be quantified are perplexing tasks. We used
a few measures of performance and success that we could quantify based on our data.
We leave it to future work to validating our findings using other measures of startup
performance. Second, our work is focused on developing predictive methods. Future
research can combine our methods with prescriptive analyses to develop strong tools
aimed at identify the causal drivers of startups’ success. Third, we used a single
26 Yu Qian Ang, Andrew Chia, and Soroush Saghafian

source of data. Future work can enhance our analyses as well as the predictive power
of our models by first combining this data with other sources, and then training our
models on the resultant larger data set. Finally, as more information about patents and
the technical competency of startups become available, future work can (a) assess
the role that different startups play in the technology translation process (e.g., from
basic research to commercialization), and (b) determine mechanisms through which
this translation process impacts their post-money valuation and success.

Acknowledgement

The authors would like to thank Crunchbase for providing academic access to the
data for this paper. The authors attest that there is no conflict of interest in this work.

References

Alperovych Y, Hübner G, Lobet F (2015) How does governmental versus private
 venture capital backing affect a firm’s efficiency? Evidence from Belgium. Journal
 of Business Venturing 30(4):508–525
Berkus D (2016) After 20 Years: Updating the Berkus Method of Valuation
 [Accessed 9 June 2020]. URL https://www.learnerslodge.com.sg/news/
 jc-cut-off-points-2018/
Blei DM, Ng AY, Jordan MI (2003) Latent Dirichlet Allocation. Journal of Machine
 Learning Research 3(Jan):993–1022
Carayannis EG, Dagnino GB, Alvarez S, Faraci R (2018) Entrepreneurial Ecosystems
 and the Diffusion of Startups. Edward Elgar Publishing
Carpenter RE, Petersen BC (2002) Capital Market Imperfections, High-tech Invest-
 ment, and New Equity Financing. The Economic Journal 112(477):F54–F72
Chen T, Guestrin C (2016) Xgboost: A Scalable Tree Boosting System. In: Proceed-
 ings of the 22nd ACM Sigkdd International Conference on Knowledge Discovery
 and Data Mining, pp 785–794
Denis DJ (2004) Entrepreneurial Finance: an Overview of the Issues and Evidence.
 Journal of Corporate Finance 10(2):301–326
Dixon C (2015) Performance Data and the Babe Ruth Effect in Venture
 Capital [Accessed 9 June 2020]. URL https://a16z.com/2015/06/08/
 performance-data-and-the-babe-ruth-effect-in-venture-capital/
Drover W, Busenitz L, Matusik S, Townsend D, Anglin A, Dushnitsky G (2017)
 A Review and Roadmap of Entrepreneurial Equity Financing Research: Venture
 Capital, Corporate Venture Capital, Angel Investment, Crowdfunding, and Accel-
 erators. Journal of Management 43(6):1820–1853
Festel G, Wuermseher M, Cattaneo G (2013) Valuation of Early Stage High-tech
 Start-up Companies. International Journal of Business 18(3):216
Machine Learning and Startups’ Performance 27

Frei P, Leleux B (2004) Valuation–What you Need to Know. Bioentrepreneur pp 1–3
Fundz Research (2020) Series A, B, C Funding - The Ultimate
 Guide [Accessed 8 June 2020]. URL https://www.fundz.net/
 what-is-series-a-funding-series-b-funding-and-more
Gompers P, Lerner J (2001) The Venture Capital Revolution. Journal of Economic
 Perspectives 15(2):145–168
Hoque F (2020) Why Most Venture-Backed Companies Fail [Accessed
 8 June 2020]. URL https://www.fastcompany.com/3003827/
 why-most-venture-backed-companies-fail
Insights C (2017) Venture Capital Funnel Shows Odds of Becoming a Unicorn Are
 Less than 1%. March 29
Islam M, Fremeth A, Marcus A (2018) Signaling by Early Stage Startups: US
 Government Research Grants and Venture Capital Funding. Journal of Business
 Venturing 33(1):35–51
Korver C (2018) Picking winners is a myth, but the PowerLaw is
 not [Accessed 9 June]. URL https://medium.com/ulu-ventures/
 successful-vcs-need-at-least-one-outlier-to-have-a-well-performing-fund-c122c799dfb3
Miloud T, Aspelund A, Cabrol M (2012) Startup valuation by venture capitalists: an
 empirical study. Venture Capital 14(2-3):151–174
Mueller A (2020) WordCloud for Python [Accessed 9 June]. URL http://
 amueller.github.io/word_cloud/
Nasser A Stéphanieueller (2017) TechinAsia: 9 methods of startup valuation
 explained [Accessed 9 June]. URL https://www.techinasia.com/talk/
 9-method-startup-valuation
Parzen E (1962) On Estimation of a Probability Density Function and Mode. The
 Annals of Mathematical Statistics 33(3):1065–1076
Pritchard JK, Stephens M, Donnelly P (2000) Inference of Population Structure using
 Multilocus Genotype Data. Genetics 155(2):945–959
Quintero S (2019) An Empirical Perspective on Startup Valuations. Radicle Working
 Paper
Reiff, Nathan (2020) Investopedia: Series A, B,
 C Funding: How it Works. URL https://www.
 investopedia.com/articles/personal-finance/102015/
 series-b-c-funding-what-it-all-means-and-how-it-works.asp
Shane SA, Ulrich KT (2004) 50th Anniversary Article: Technological Innovation,
 Product Development, and Entrepreneurship in Management Science. Manage-
 ment Science 50(2):133–144
Snoek J, Larochelle H, Adams RP (2012) Practical Bayesian Optimization of Ma-
 chine Learning Algorithms. In: Advances in Neural Information Processing Sys-
 tems, pp 2951–2959
Srivastava N, Hinton G, Krizhevsky A, Sutskever I, Salakhutdinov R (2014) Dropout:
 A Simple Way to Prevent Neural Networks from Overfitting. The Journal of
 Machine Learning Research 15(1):1929–1958
28 Yu Qian Ang, Andrew Chia, and Soroush Saghafian

Williams D, Robbins LE, Marks KH, Funkhouser JP, Fernandez G (2013) The Hand-
 book of Financing Growth: Strategies, Capital Structure, and M & A Transactions.
 Wiley
Yuen S (2020) Entrepreneurial Ecosystems and the Diffusion of Startups. Marshall
 Cavendish Business
Zou H, Hastie T (2005) Regularization and Variable Selection via the Elastic
 Net. Journal of the Royal Statistical Society: Series B (Statistical Methodology)
 67(2):301–320
You can also read