Spring 2022 Solar Industry Update - David Feldman Krysta Dummit, ORISEa Fellow Jarett Zuboy Jenny Heeter Kaifeng Xu Robert Margolis - NREL
←
→
Page content transcription
If your browser does not render page correctly, please read the page content below

Spring 2022
Solar Industry Update
David Feldman
Krysta Dummit, ORISEa Fellow
Jarett Zuboy
Jenny Heeter
Kaifeng Xu
Robert Margolis

April 26, 2022           a   Oak Ridge Institute for Science and Education
Agenda

1 Global Solar Deployment
2 U.S. PV Deployment
3 PV System Pricing
4 Global Manufacturing
5 Component Pricing
6 Market Activity
7 U.S. PV Imports
                            NREL | 2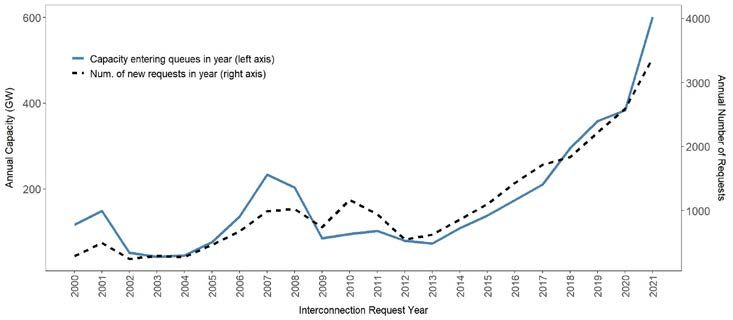
Executive Summary
Global Solar Deployment                                                                     PV System and Component Pricing
•   In 2021, 172 GWdc of PV capacity was added globally, bringing cumulative capacity       •   The median system price of utility-owned PV plant installed in 2021 was $1.20/Wac
    to 939 GWdc.                                                                                ($0.97/Wdc)—down 11% y/y in Wac but up 8% in Wdc.
•   China, the largest market, installed a record 55 GWdc (309 GWdc cumulative).            •   The median reported price by EnergySage for residential PV systems decreased
•   Analysts project increased annual global PV installations over the next 4 years, with       2.5% between the second half of 2020 and the second half of 2021 to $2.68/Wdc
    continued growth in China, the United States, Europe, and India.                            but increased between first and second half of 2021—the first reported increase on
                                                                                                record.
•   In 2021, approximately 250 MW of CSP was added in China and 110 MW in Chile.
•   An additional 1.7 GW of CSP is currently under construction.                            Global Manufacturing
                                                                                            •   In 2021, global PV shipments were approximately 194 GW (95% of which were
U.S. PV Deployment                                                                              mono c-Si technology)—an increase of 47% from 2020.
•   Over 35 GWac of new installed capacity was either from renewable energy (18.6
    PV, 14.0 GW wind) or battery technologies (3.4 GW) in 2021, surpassing last year’s      •   In 2021, the United States produced a record 4.8 GW of PV modules, up 11% y/y,
    record. PV alone represented 44% of new U.S. electric generation capacity.                  mostly as a result of a 25% increase in production by First Solar.

•   Solar still only represented 8.0% of net summer capacity and 3.9% of annual             U.S. PV Imports
    generation in 2021.
                                                                                            •   On February 4, 2022, Section 201 tariffs on crystalline silicon modules and cells
•   However, 11 states generated more than 6% of their electricity from solar, with             were extended for another 4 years at just below 15%. Bifacial modules will remain
    California leading the way at 25.0%.                                                        exempt as will be the first 5 GW of imported cells.
•   The United States installed 18.6 GWac (23.6 GWdc) of PV in 2021, ending the year        •   On April 1, 2022, based on a petition from Auxin Solar, the U.S. Department of
    with 92.5 GWac (119.7 GWdc) of cumulative PV installations.                                 Commerce (Commerce) initiated an investigation into whether Chinese companies
•   The United States installed approximately 10.6 GWh, 3.6 GWac of energy storage              are circumventing antidumping and countervailing duties by manufacturing cells
    onto the electric grid in 2021, up 197% y/y.                                                and modules in Southeast Asian countries.
                                                                                            •   23.6 GW of PV modules and 2.6 GW of PV cells were imported into the United
     A list of acronyms and abbreviations is available at the end of the presentation.          States in 2021, 77% of which came from Malaysia, Vietnam, Thailand, and NREL | 3
                                                                                                Cambodia.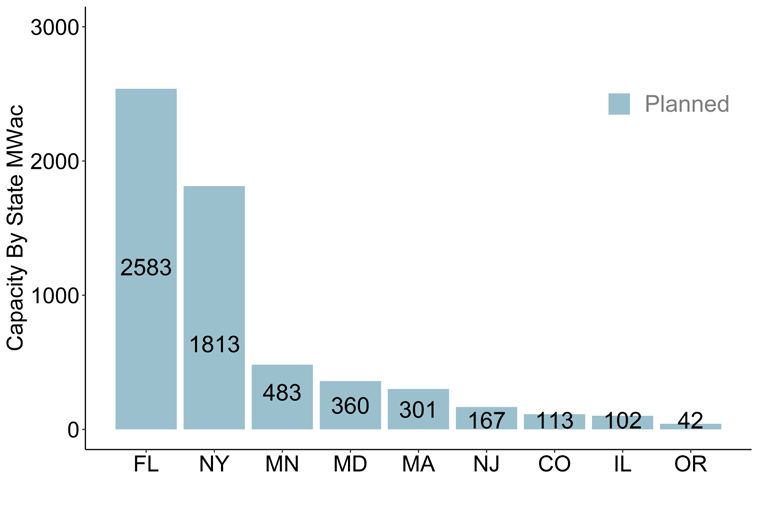
Agenda
                            • From 2010 to 2021, global PV capacity additions grew from
                              17 GWdc to 172 GWdc.
                               – At the end of 2021, global PV installations reached 939 GWdc.
1 Global Solar Deployment
                            • In 2021, solar contributed 30% to new generation capacity
2 U.S. PV Deployment          in China (a record of 55 GWdc) and 13% of cumulative
                              capacity (309 GWdc).
3 PV System Pricing            – China installed 13.2 GWdc in Q1 2022, a 148% increase,
                                 y/y.
4 Global Manufacturing
                            • Analysts project increased annual global PV installations
5 Component Pricing           over the next 4 years, with continued growth in China, the
                              United States, Europe, and India.
6 Market Activity           • In 2021, approximately 250 MW of CSP was added in China
                              and 110 MW in Chile.
7 U.S. PV Imports
                               – An additional 1.7 GW of CSP is currently under construction.
                                                                                                NREL | 4
Global Annual PV Capacity
Additions by Country
180 • From 2010 to 2021, global PV capacity additions
Rest of World grew from 17 GWdc to 172 GWdc.
160 Rest of Europe – In 2021, global PV installs increased 19%, y/y.
PV Annual Installations (GWdc)
140 Germany – The total cumulative installed capacity for PV at
United States the end of 2021 reached at least 939 GWdc.
120
India
• European markets led in the beginning of the
100 Japan decade, but PV growth then transitioned to Asia.
China
80 – At the end of 2021, 57% of cumulative PV
installations were in Asia, 21% were in Europe,
60 and 16% were in the Americas.
40 • In 2021, the top 10 countries installed 74% of
global installations.
20
– At least 20 countries installed more than 1 GW
0 of PV, and 15 countries now have more than 10
2010 2011 2012 2013 2014 2015 2016 2017 2018 2019 2020 2021 GW of cumulative PV.
NREL | 5
Sources: IEA, Snapshot of Global PV Markets: 2022; PVPS Snapshot 2020 and 2021; Trends in Photovoltaic Applications 2019.• China’s annual PV installations grew 14% y/y in 2021,
Top PV Markets representing just under one-third of annual global
deployment.
• In 2021, the United States had the second-largest PV
• The leading five markets in cumulative PV installations at the end of market in terms of both cumulative and annual
2021 were China, the United States, Japan, India, and Germany. installations.
– Brazil just bumped Germany out of the top five for annual – The EU was the second-largest market, with 178.5
deployment. GWdc of cumulative installations (19% of global)
and 26.5 GWdc annual installations (15% of global)
in 2021.
Cumulative PV Deployment, 2021 (939 GWdc) Annual PV Deployment, 2021 (172 GWdc)
350 309 60 54.9
300 50
250
40
200 31.3
30 23.6
150 120 131
78 78 20 13.0 14.4
100 60 59
25 10 6.5 5.5 5.3 4.9 4.6 4.2
50 23 20 19 17 3.4
0 0
Note: U.S. numbers were adjusted from IEA document. NREL | 6
Sources: IEA, Snapshot of Global PV Markets: 2022; Wood Mackenzie/SEIA: U.S. Solar Market Insight: 2021 YIR.• The United States, despite being a leading PV market, is
Global PV Penetration below this average and other leading markets in terms
of PV generation as a percentage of total country
electricity generation, with 4%.
• IEA estimates that in 2021, 5% of global electricity generation came – If California were a country, its PV contribution
from PV. (25%) would be the highest.
16%
Percent of Annual Electricity Generation
14%
12%
10%
8%
6%
4%
2%
0%
Greece
Turkey
USA
World
France
Chile
Germany
UK
Thailand
Canada
Norway
Italy
Belgium
Portugal
Bulgaria
Denmark
S. Korea
Spain
Netherlands
Honduras
Israel
EU
China
Romania
Malaysia
Australia
Japan
India
Switzerland
Mexico
S. Africa
Czech Rep.
Sweden
Finland
Morocco
Austria
NREL | 7
Source: IEA, Snapshot of Global PV Markets: 2022.Note: IEA reports that China reports solar in Wdc. To align Chinese solar numbers
Chinese Generation Capacity with other generation sources, and how we represent U.S. total capacity
additions, we converted solar values to Wac, using an ILR of 1.25.
Additions by Source Sources: China Electric Council, accessed (2017, 2018, 2019, 2020, 2021); China
National Energy Administration (1/28/22); NASDAQ (1/26/22); Wind Power
Monthly (1/27/22); BloombergNEF (1Q 2022 Global PV Market Outlook); IEA,
Snapshot of Global PV Markets: 2022.
• In 2021, solar contributed 26% to new generation capacity in China (55 GWdc/~44 • The share of capacity from renewables has increased
GWac) and 13% of cumulative capacity (309 GWdc/247 GWac). as China’s total electric capacity has grown.
– Solar installed in 2021 surpassed the previous high of 42 GWac set in 2017. – China’s capacity grew by 119% from 2011 to 2021.
– In 2021, for the first time, more distributed solar (53%) was installed than utility-scale solar – During the same period, the percentage of total coal and
(47%). gas capacity dropped from 72% to 56%.
– Wind and solar accounted for 57% of the capacity installed in 2021—the fifth straight year – New non-carbon generation capacity as a percentage of
they contributed more than half of capacity additions. total new capacity increased from 39% to 68%.
– Coal and gas deployment has remained relatively flat over the past 11 years as renewables
have grown.
Annual Capacity Additions (GWac) Cumulative Capacity (GWac)
2,324
250 2,500
2,200
2,011 247
191 1,900
200 2,000 203
169 Solar 1,652 1,777 164 Solar
1,521 140
142 39 1,379 105
62 Wind
150 121 44 Wind 1,500 1,147 1,258 35
111 12 125 125 123 111
96
1,063 Hydro
Hydro
100 84 28 35 1,000 Other
42 24
Other
Nuclear
50 Nuclear 500 Coal and Gas
Coal and Gas
0 0
NREL | 8
20112012201320142015201620172018201920202021 2011 2012 2013 2014 2015 2016 2017 2018 2019 2020 2021Sources: BloombergNEF (1Q 2022 Global
PV Market Outlook); TaiyangNews
Chinese Market Update (3/24/22); PV Magazine (2/25/22)
• Utility-scale PV is poised for growth in 2022, as projects delayed in 2021 owing to high equipment costs likely will be built in 2022,
and more gigawatt-scale “mega energy bases” are scheduled for construction.
– China installed 13.2 GWdc in Q1 2022, a 148% increase, y/y.
• New rooftop PV systems will not receive subsidies, but distributed PV deployment will be encouraged by China’s small-scale PV
bulk development model, rising commercial and industrial electricity prices, and new energy consumption control policies.
– Distributed PV growth could be hampered in the medium term by the need to upgrade distribution infrastructure.
• China’s central government asked state-owned independent power producers (IPPs) in late 2021 to achieve a renewables capacity
share of 50% or higher by 2025.
– IPPs must balance this goal against profitability mandates, which, in light of higher equipment prices, likely will result in variable progress
toward the renewables target.
• China’s green hydrogen and energy storage goals complement renewables-driven decarbonization goals.
– China announced a goal of up to 200,000 million tons of hydrogen from solar and wind annually by 2025.
– State Grid Corporation of China, which operates 80% of China’s electricity grids, announced a goal of 100 GW of battery storage and 100
GW of pumped storage hydropower by 2030.
NREL | 9Japanese Market Update
• Japan installed about 6.5 GWdc of PV in 2021—down 25% from a Japan’s Annual PV Capacity Additions (GWdc)
relatively high-installation year in 2020—resulting in about 78 GWdc of 12
cumulative capacity.
10
• Achieving Japan’s goal of carbon neutrality by 2050 may require 370
GWdc of PV by 2050. 8
– In late 2021, Japan raised its target for renewable electricity generation in 6
2030 from 22%–24% to 36%–38%, which is projected to include about 108
GWdc of PV by 2030. 4
– Because of scarce land and the difficulty of deploying PV on earthquake- 2
proof residences, deployment targets include water bodies, government
and commercial buildings, car parks, and farms. 0
2015 2016 2017 2018 2019 2020 2021
• Japan proposed modest feed-in tariff levels for 2022 of $0.15/kWh for
systems < 10 kW, $0.096/kWh for 10–50 kW systems, and $0.087/kWh
for 50–250 kW systems
– These levels will not make PV profitable at current construction costs,
which may result in only 3 GW being installed in 2022, said one analyst.
Sources: BloombergNEF (1Q 2022 Global PV Market Outlook); PV Magazine (7/23/21, 2/24/22); International Renewable Energy Agency (Solar Energy Data, 3/4/22); NREL | 10
TaiyangNews (12/21/21, 12/22/21); PV Tech (7/7/21, 10/25/21). Photo (Panoramic view of a 1.5 MWdc floating solar system in Japan, 2017) by Adam Warren/NREL.Indian Market Update
• After a pandemic-driven decline to 3.2 GWac in
India's Annual PV Capacity Additions (GWdc) 2020, India’s solar deployment surged 210% to an
14 all-time high of 10 GWac in 2021.
12 – Projects delayed in 2020 fueled 2021 growth.
10 – Large-scale projects accounted for 83% of 2021
8 installations and rooftop systems accounted for 17% of
them.
6
– Solar made up 62% of total new electric generation
4 capacity installed.
2
• At year-end 2021, cumulative solar installations
0
reached 49 GWac, which is equivalent to 12% of
total power capacity and 32% of renewable
capacity.
• The large-scale solar pipeline totaled 53 GWac.
Sources: BloombergNEF (1Q 2022 Global PV Market Outlook); Mercom India Research (Q4 & Annual 2021
NREL | 11
India Solar Market Update); PV Magazine (2/28/22).• India’s 2021 growth occurred despite rising costs.
Indian Market Update – in Q4 2021, large-scale PV project prices rose 21.6%
and rooftop PV prices rose 14.8% y/y.
– Imported module prices rose 14% in 2021.
S…
N…
S…
N…
S…
N…
M…
M…
M…
M…
M…
M…
J…
J…
J…
J…
J…
J…
2000 0.35
• Module imports accelerated to exploit an 8-month zero-
1800 import-tax period that began in August 2021, ahead of a
Module Imports (MWdc)
1600 basic customs duty—40% for modules, 25% for cells—
0.3 starting in April 2022.
1400
Module Imports (MWdc)
1200 • Concerns have been raised about the impacts of a basic
Price ($/Wdc)
Module Import Price,
customs duty on price and availability delaying PV
1000 Excluding Tax ($/Wdc) 0.25
projects.
800
600 • India’s Approved List of Models and Manufacturers is
0.2 meant to boost domestic module manufacturing by
400
constraining imports over time.
200
0 0.15
• A $3.2 billion, 5-year subsidy program is stimulating
Indian polysilicon, wafer, cell, and module production.
Jul-19
Sep-19
Jul-20
Sep-20
Jul-21
Sep-21
Mar-19
Mar-20
Mar-21
Jan-19
May-19
Nov-19
Jan-20
May-20
Nov-20
Jan-21
May-21
Nov-21 BNEF estimates that module and cell production
capacity could reach 36 and 18 GW by end of 2023.
Sources: BloombergNEF (1H 2022 India Renewables Market Outlook); PV Tech (3/9/22, 3/11/22);
NREL | 12
PV Magazine (3/15/22).Europe and Russia Depend on
Each Other Due to Energy
• In 2019, more than half of Russia’s exports was fuel.
Selected energy exports from Russia (2021)
rest of
OECD Europe world Asia and Oceania
• Most of the energy Russia exports goes to Europe.
crude oil and
condensate – Energy accounted for nearly two-thirds of EU’s
49% 13% 38%
4.7 million
barrels per day
imports from Russia in 2021 and 40% of
Europe’s natural gas comes from Russia.
natural gas
8.9 trillion
• Approximately 1/3 of EU natural gas consumption is
74% 13% 13%
cubic feet per year used for electricity, another 1/3 is used for
residential and commercial buildings, and 27% goes
to industry.
coal
262 million 32% 15% 53%
short tons per year – Germany is particularly dependent on Russia,
with half of its natural gas and coal coming
from Russia.
– In contrast, 8% of U.S. imported oil, or 2% of
supply, comes from Russia.
Sources: AP News (11/17/21); EIA (03/14/22); EuroNews (02/25/22); NBC News (03/09/22); Reuters (02/28/22, 03/07/22);World Bank. NREL | 13Russian Invasion of Ukraine • LNG, with the United States being a key supplier, is an
Prompts Changes to European essential element of the plan, but in the short term there
are limitations to LNG export (U.S.) and import facilities.
Energy Mix • The plan calls for doubling solar and wind capacity by 2025
• On March 8, 2022, The European Commission released a plan to cut and tripling it by 2030—the equivalent of deploying 480
Russian gas imports by two-thirds in 2022 and all oil, gas, and coal GW of wind and 420 GW of solar capacity and increasing
by 2027. average deployment rate 20%.
– Half the 2022 cuts will come from imports from elsewhere, and – It also calls for 12–15 GW of additional rooftop solar
the rest will rely on renewable energy deployment and demand in 2022, which is roughly double BNEF’s current
behavioral energy savings. forecast.
– Green hydrogen and electrification (e.g., heat pumps) will
also encourage solar adoption.
EU Targets for Russian Gas Imports to be Displaced in 2022 by Sectoral Targets – There is also a proposal to temporarily allow states to
recoup “windfall” profits from wind and solar operators to
120
101.5
Russian imported gas to be displaced lower energy costs to consumers.
100
LNG diversification
80
60 Wind and solar • Switching from Russian natural gas in the short term may
40
Behavioral energy saving increase coal and nuclear production, particularly in
20
0 Pipeline import diversification Germany, which had planned to phase nuclear out by 2022
-20
1
Biomethane production and coal by 2030.
-40
-60 -50
Heat pump adoption
– Also, Germany released a plan in late February to get
100% of its electricity from renewables by 2035.
Source: BNEF, “Europe Plans Break from Russian Gas; European Commission (03/08/22);
NREL | 14
Reuters (02/28/22).Annual Global PV Demand • About 172 GWdc of PV were installed globally in 2021.
• Analysts project continued increases in annual global PV
installations, with the growth rate slowing over time.
350
– 218 GWdc in 2022 (27% y/y growth)
300
– 253 GWdc in 2023 (16%)
PV Annual Installations (GWdc)
250
– 282 GWdc in 2024 (11%)
200 – 303 GWdc in 2025 (8%)
150 • Among analysts who updated global projections since last
quarter, global estimates increased significantly (e.g., by
100
12%–21% in 2025).
50
• China, Europe, the United States, and India are projected
0 to account for about two-thirds of global PV installations
2020 2021 2022P 2023P 2024P 2025P over this period.
Europe U.S. India Rest of World China
• Projected U.S. deployment growth is relatively stagnant
Notes: P = projection. Bars represents median projections for country-level estimates. Error bars
represent high and low projections. Not all sources have data for all categories. during this period, declining in 2022, growing in 2023, and
Sources: BNEF, 1Q 2022 Global PV Market Outlook, 3/1/22; Goldman Sachs Equity Research, Americas then declining again in 2024 and 2025.
Clean Technology: Solar 2021 Outlook, 01/09/22; Goldman Sachs Equity Research, Americas Clean
Technology: Solar, Assessing the Impact of Volatile Macro - Oil, Commodities & EU in Focus, Raise
Demand View Thru 2025, 3/29/22; Wood Mackenzie and SEIA's US Solar Market Insight, 2021 Year in
Review, 3/22; U.S. Energy Information Administration, Annual Energy Outlook, 3/3/22; IEA, Snapshot of NREL | 15
Global PV Markets: 2022.• At the end of 2021, global CSP capacity
Current Global CSP Capacity reached approximately 6.6 GW.
• Cumulative global CSP installations were
7 almost six times higher in 2021 than in 2010.
– Initially most of the growth came from Spain (first-
6
Cumulative CSP Installations (GW)
Other largest) and the United States (second-largest).
5 UAE
South Africa
• From 2015 to 2021, 2.6 GW of CSP was
4
Morocco
installed in other parts of the world,
Israel
particularly the Middle East, North Africa,
3
India
South Africa, and China.
– There was also development in other parts of the
2 China
world, such as India and South America.
Chile
1
Spain • In 2021, 250 MW of CSP started operation in
0 USA China and 110 MW began in Chile.
2010
2011
2012
2013
2014
2015
2016
2017
2018
2019
2020
2021
– All projects used power tower technology.
– Molten salt storage durations ranged from 8 hours
to 17.5 hours.
NREL | 16
Sources: The World Bank (2021); Ren21 (2021); NREL.Global CSP Pipeline
• Approximately 1.7 GW of CSP is currently under
Projects Under Construction construction in four countries, using a mix of
0.8 trough and tower technology.
Parabolic Trough Tower
0.7 – The projects all have 5–15 hours of thermal
CSP Capacity (GWac)
0.6 energy storage.
0.5
0.4 • In addition to these projects, another ~10 GW of
0.3 CSP is in some stage of development, though its
0.2 prospects of reaching commercial operation are
0.1
unclear.
0.0 – Many of these projects are in Chile, China, the
China Morocco South Africa UAE Middle East, and South Africa.
Note: Timelines vary by the circumstances of individual CSP projects, but each step can take two years, or six years in total.
NREL | 17
Sources: The World Bank (2021); HeliosCSP (02/28/22, 03/24/22, 04/07/22); BNEF, “Capacity & Generation” data set, accessed March 1, 2022.Using CSP for Industrial
Process Heat
• In the United States, there have been recent additions (e.g., 2.3 MWth solar steam
boiler for almond pasteurization in California and solar water heating in New York).
• In Spain, companies built a pilot plant to produce cement using direct solar heat
instead of fossil fuels. Cement is one of the most carbon-intensive industries,
globally.
• An Australian oil and gas producer purchased 5 MWe of Heliogen equipment for a
demonstration project in the Mojave Desert, with the aim of producing green
hydrogen, aiding in oil and gas extraction, or producing electricity in Australia and
elsewhere.
NREL | 18• In 2021, PV represented approximately 44% of new U.S.
Agenda electric generation capacity, compared to 4% in 2010.
– Over 35 GWac of new installed capacity was either from renewable
energy or battery technologies in 2021, surpassing last year’s
record.
1 Global Solar Deployment • Solar still represented only 8.0% of net summer capacity and
3.9% of annual generation in 2021.
2 U.S. PV Deployment – However, 11 states generated more than 6% of their
electricity from solar, with California leading the way at
25.0%.
3 PV System Pricing
• The United States installed 18.6 GWac (23.6 GWdc) of PV in
4 Global Manufacturing 2021, ending the year with 92.5 GWac (119.7 GWdc) of
cumulative PV installations.
5 Component Pricing • The United States installed approximately 10.6 GWh, 3.6
GWac of energy storage onto the electric grid in 2021, up
6 Market Activity 197% y/y.
7 U.S. PV Imports
NREL | 19Q4 2021/Q1 2022
Many states took actions related to distributed generation
compensation policies, including considering changes to credit rates,
the creation of net metering successor tariffs, and the
State Updates implementation of rebates.
Some states are also working to calculate the exact value of solar or
DG, while others are assessing the costs and benefits of their existing
net metering rules.
A working group formed by the Michigan
Public Service Commission released its
The Indiana Court of final report, which identified three
Appeals found that potential rate designs for distributed
Vectren’s recently energy resources. Pedernales Electric
approved net metering Cooperative approved changes to its net
successor tariff utilizing metering rates, following the release of
instantaneous netting is its value of solar study. Idaho and
in conflict with Indiana’s Maryland also began studies into the
DC
distributed generation value/cost of DER.
statute.
Duke Energy Carolinas and Duke Energy
Progress proposed revised net metering tariffs
in North Carolina. And Mississippi Public
Service Commission released proposed net
metering rule revisions. Thesproposals include
various solar rebate programs (including low-
income programs).
As part of a November 2021 decision in Arizona Public Service’s
general rate case, the Arizona Corporation Commission removed In March 2022, The Florida Legislature passed House Bill 741 which, starting in 2023,
the utility’s existing grid access charge for distributed solar would regress payments to solar customers from a retail rate to the “avoided cost” to
customers participating in the TOU-E tariff (time-of-use rates with the utility by 2029. The bill also allows for fixed charges for grid connected solar
no demand charges). customers starting in 2026. In April, the governor vetoed the bill, citing the “financial
crunch” it would have put on people in the state.
NREL | 20
Source: Meister Consultants Group, 50 States of Solar: Net Metering Quarterly Update (Q4 2021, Q1 2022), pv magazine: Florida House Bill 741.New U.S. Capacity Additions,
2010–2021 • In 2021, PV represented approximately 44% of
new U.S. electric generation capacity (31% UPV,
13% DPV), compared to 4% in 2010.
UPV DPV CSP Batteries Wind Nuclear Other Natural gas – Wind represented 33% of added capacity.
45
– Since 2017, PV has represented
U.S. Electric Capacity Additions (GW)
40 approximately 35% of new electric
35 generation capacity.
30 • Over 35 GWac of new installed capacity was
25 either from renewable energy or battery
20 technologies in 2021, surpassing last year’s
record and nearly matching the total U.S.
15
capacity additions in 2020 and 2018.
10
• Combined with wind, 77% of all new capacity
5
in 2021 came from renewable sources.
0
2010 2011 2012 2013 2014 2015 2016 2017 2018 2019 2020 2021 • Battery installations jumped by a factor of 5
from 2020 to 2021; it now represents 8% of
capacity additions.
Note: “Other” includes coal, geothermal, landfill gas, biomass and petroleum. DPV = Distributed PV; UPV = Utility-scale PV NREL | 21
Sources: EIA, “Electric Power Monthly” Tables 6.1, 6.2B, 1.1, 1.1A; Forms 860M & 861M. April 2022.2021 U.S. Generation and Capacity • Solar still represents a small but growing
percentage of the U.S. electric generation mix.
– In 2021, solar represented 8.0% of net
summer capacity and 3.9% of annual
• Renewables are becoming an increasingly large part of the U.S.
generation.
electric generation mix, representing 27% of capacity and 21% of
generation in 2021. • Capacity is not proportional to generation, as
– Adding nuclear, non-carbon sources represented 35% of certain technologies (e.g., natural gas) have lower
capacity and 40% of generation. capacity factors than others (e.g., nuclear).
2021 U.S. Generation (Total 4,165 TWh) 2021 U.S. Generation Capacity (Total 1.2 TW)
Natural gas Natural gas
38% 42%
Coal Coal
22% 18%
Other
2.2% Other Nuclear
Geothermal Nuclear 6% 8%
0.4% Wind 19%
9% Hydro
CSP Geothermal
Hydro Wind 7%
0.1% DPV 0.2%
UPV 6% 11%
1.2% CSP DPV
2.7% UPV
0.1% 2.8%
5.1%
NREL | 22
Sources: EIA, “Electric Power Monthly” Tables 6.1, 6.1A, February 2022, “Electricity Data Browser,” April 5, 2022.U.S. Generation, 2011–2021
2,000 • Energy generation from coal trended upward in
2021 for the first time since 2014, just barely
1,800 exceeding total renewable generation, while
1,600 generation from natural gas trended down for the
Coal first time since 2017.
Annual Generation (TWh)
1,400 – The percentage of electricity generated by fossil fuels
Hydro
in the United States dropped from 68% in 2011 to 60%
1,200 Natural gas in 2021, while the percentage of electricity generated
1,000 Nuclear by renewable generation increased from 13% to 21%
Wind over the same period.
800 – EIA attributed the increase in coal-fired electricity
Solar
generation to increased U.S. natural gas prices,
600 Geothermal relatively stable coal prices, and increased energy
Other demand.
400
Renewables • In 2021, renewable energy facilities continued to
200
produce more electricity than nuclear sources.
0
• Generation from solar and wind both continued to
2011
2012
2013
2014
2015
2016
2017
2018
2019
2020
2021
increase, while generation from hydropower and
nuclear sources continued to decrease.
NREL | 23
Sources: U.S. Energy Information Administration (EIA), “Electricity Data Browser.” Accessed April 5, 2022; Reuters (10/18/21).Solar Generation as a Percentage
of Total Generation, 2021
30% • In 2021, 11 states generated more than 6%
CSP of their electricity from solar, with
Solar Generation as a Percentage of Total
25.0% C&I
25% Residential
California leading the way at 25.0%.
UPV
19.7% – Five states generated more than 16% of their
20% electricity using solar.
Net Generation
18.0%
17.1%
16.1%
– Nationally, 3.9% of electricity was generated
15%
from solar.
9.5% 9.0%
10% 8.6% 7.9% • The role of utility versus distributed solar
6.6% 6.4%
varies by state, with northeastern states
3.9%
5% and Hawaii relying more on DPV.
– Northeastern states also tend to have a
0%
CA MA NV HI VT UT AZ RI NC NJ NM U.S. greater proportion of their DPV coming from
C&I, although it is still fairly even.
Note: EIA monthly data for 2021 are not final. Additionally, smaller utilities report information to EIA on a yearly
basis, and therefore a certain amount of solar data has not yet been reported. “Net Generation” includes DPV
generation. Net generation does not take into account imports and exports to and from each state, and
therefore the percentage of solar consumed in each state may vary from its percentage of net generation.
Source: U.S. Energy Information Administration (EIA), “Electricity Data Browser.” Accessed February 28, 2022. NREL | 24Solar Generation as a Percentage
of Total Generation, 2014–2021
30.0%
CA • From 2014 to 2021, leading solar deployment
MA states greatly increased solar electricity
Solar Generation as a Percentage of Total
25.0%
NV penetration.
HI
20.0%
VT
• In the past 5 years, five states (solid lines)
Net Generation
UT shifted over 9% of their electricity generation
15.0% AZ to solar sources.
RI – Some of the increase in Massachusetts's
10.0% NC percentage is due to significant reduction in total
NJ
electricity production within the state.
5.0% NM
• The United States, as a whole, has a much
CO
lower levels, but it has still increased
U.S.
0.0%
generation by 458% since 2014.
2014 2015 2016 2017 2018 2019 2020 2021
Note: EIA monthly data for 2021 are not final. Additionally, smaller utilities report information to EIA on a yearly
basis, and therefore a certain amount of solar data has not yet been reported. “Net Generation” includes DPV
generation. Net generation does not include imports and exports to and from each state, and therefore the
percentage of solar consumed in each state may vary from its percentage of net generation. NREL | 25
Source: U.S. Energy Information Administration (EIA), “Electricity Data Browser.” Accessed April 5, 2022.U.S. Installation Breakdown
Annual: EIA (GWac) • Approximately 47% of U.S. PV capacity installed in
2021 was in Texas, Florida, and California.
• Despite a concentration of PV installations in the
• Despite the impact of the pandemic on the overall economy, the top three markets, diversification of growth
United States installed 18.6 GWac of PV in 2021, its largest total continues across the United States.
ever—up 24% y/y.
– 19 states had more than 1 GWac of cumulative PV
– Residential (3.9 GWac), C&I (1.5 GWac), and utility-scale PV installations at the end of 2021 (New Mexico and
(13.2 GWac) were up 32%, 5%, and 25%, respectively, in Illinois both achieved this distinction for the first
2021. time in 2021), and 25 states installed more than 100
MWac in 2021.
U.S. PV Installations by Market Segment
20 18.6 2021 U.S. PV Installations by Region
Annual PV Installed (GWac)
15.0 (18.6 GWac)
15 Florida
11.3 13.2 Southwest
9.3 13% 8%
10 8.4 8.3 Texas
5.7 23%
5 1.5 California
Other
Northeast 16%
3.9 2%
0 1,692
Midwest
2015 2016 2017 2018 2019 2020 2021 Southeast
13%
16%
Residential PV Non-Residential PV Utility PV
Note: EIA reports values in Wac which is standard for utilities. The solar industry has traditionally reported in Wdc. See the next slide for values reported in Wdc. NREL | 26
Sources: EIA, “Electric Power Monthly,” forms EIA-023, EIA-826, and EIA-861 (April 2022, February 2021, February 2019).U.S. Installation Breakdown Unlike the previous slide, these values are in
Annual: SEIA (GWdc) GWdc—not GWac.
• SEIA reports that the United States installed 23.6 GWdc of PV in 2021 • Six states installed more than 1 GWdc of PV in 2021, and
(119.7 cumulative)—an annual increase of 19% y/y. 22 states have more than 1 GWdc of cumulative PV
installations (Connecticut, Indiana, Illinois, and Oregon
– 16.7 GWdc UPV (19% y/y), 2.4 GWdc Non-residential (2% y/y), and all achieved this distinction for the first time in 2021).
4.2 GWdc Residential (30% y/y). • Texas installed over 6 GWdc in 2021 alone.
• Q4 2021 installations totaled 7.8 GWdc.
U.S. PV Installations by Market Segment 2021 U.S. PV Installations by Region
25
(23.6 GWdc)
20 Florida
7%
Annual PV Installed (GWdc)
Utility Nonresidential PV Residential PV Southwest
Texas 9%
15 26%
California
10 Other 15%
4%
Northeast
5 9% Midwest
Southeast 12%
18%
0
2010 2011 2012 2013 2014 2015 2016 2017 2018 2019 2020 2021
NREL | 27
Sources: Wood Mackenzie/SEIA: U.S. Solar Market Insight: 2021 YIR.U.S. Installation Breakdown
by State
At the end of 2021, there were 92.5 GWac of solar PV systems in the United States, of which 59.5 GW were utility-scale PV,
21.0 GW were residential PV, and 11.9 GW were C&I PV.
Cumulative PV Capacity Installed as of Dec 2021 (MWac) PV Capacity Installed in 2021 (MWac)
California 26,600 Texas 4,344
Texas 10,329 California 2,984
Florida 6,022 Florida 1,457
North Carolina 5,959 Virginia 952
Arizona 4,460 Illinois 771
Nevada 3,562 Georgia 763
New York 3,058 Nevada 731
Massachusetts 3,047 North Carolina 700
New Jersey 3,045 Arizona 688
Georgia 2,993 Residential Colorado 635 Residential
Virginia 2,349 New York 577
Utah 1,843 C&I Ohio 399 C&I
Colorado 1,772 Indiana 368
South Carolina 1,432 Utility-scale Wisconsin 326 Utility-scale
Illinois 1,379 Utah 324
Maryland 1,293 Massachusetts 319
Minnesota 1,236 New Jersey 234
Hawaii 1,037 Alabama 227
New Mexico 1,003 Oregon 196
Other 10,087 Other 1,620
0 5,000 10,000 15,000 20,000 25,000 30,000 0 1,000 2,000 3,000 4,000 5,000
Note: EIA monthly data for 2021 are not final. Additionally, smaller utilities report information to EIA on a yearly basis, and therefore, a certain amount of solar data have not
yet been reported. “Net Generation” includes DPV generation. Virginia’s C&I installations in 2021 were net negative. NREL | 28
Sources: EIA, “Electric Power Monthly,” forms EIA-023, EIA-826, and EIA-861 (February 2022, February 2021).Cumulative U.S. PV Capacity Per
Capita (2021)
• Some large states that ranked high in total cumulative capacity at the end of 2021, such as Texas (#2), Florida (#3) and New
York (#7), are noticeably lower in rankings on a watts per capita basis. Texas drops to #11, Florida to #14, and New York to #26.
– Conversely, Nevada and Hawaii, which ranked 6th and 18th in cumulative PV capacity, jump to 1st and 2nd in terms of PV
watts per capita.
1,400
Cumulative PV Capacity Per Capita
1,200
1,000
(Wac/person)
800
600
400
200
0
District of…
New…
Wyoming
Delaware
Indiana
Arkansas
Alabama
Ohio
Oklahoma
Nevada
Hawaii
Arizona
Texas
Colorado
Georgia
Vermont
New Jersey
South Carolina
Connecticut
Pennsylvania
Michigan
West Virginia
North Dakota
California
North Carolina
U.S.
Florida
Virginia
Minnesota
New York
Wisconsin
Mississippi
Iowa
Missouri
Louisiana
Montana
Washington
Tennessee
Alaska
Kansas
Utah
New Mexico
Massachusetts
Rhode Island
Maine
Oregon
Nebraska
Kentucky
Maryland
Idaho
Illinois
South Dakota
Note: EIA monthly data for 2021 are not final. Additionally, smaller utilities report information to EIA on a yearly basis, and therefore, a certain amount of solar data have not
yet been reported. “Net Generation” includes DPV generation. Virginia’s C&I installations in 2021 were net negative. NREL | 29
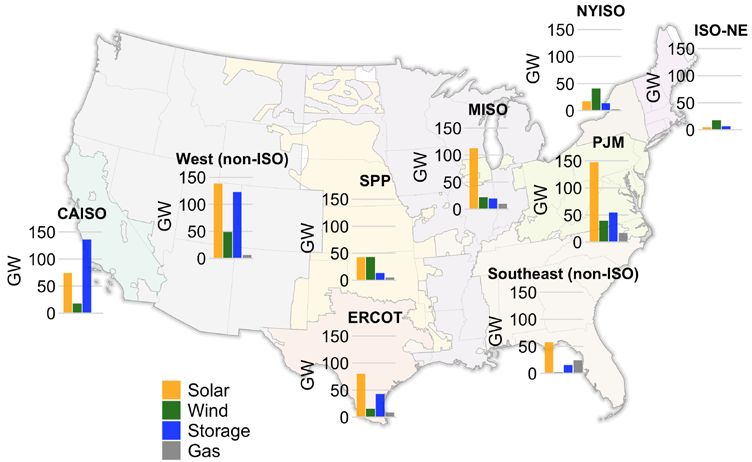
Sources: EIA, “Electric Power Monthly,” forms EIA-023, EIA-826, and EIA-861 (February 2022, February 2021); United States Census Bureau (2019).• Substantial solar and storage capacity have been
U.S. Transmission proposed in most regions of the United States.
Interconnection Queues • Annual interconnection requests have increased
dramatically—in terms of both number and
capacity—since 2013; over 600 GW was added in
2021 alone.
• Less than 23% of all projects proposed from 2000
Proposed Interconnections by Technology to 2016 have reached commercial operations.
– Wind (20%) and solar (16%) have lower
completion rates from 2000 to 2016 than other
electric generation technologies.
Interconnection Requests by Year
NREL | 30
Source: LBNL, Queued Up: Characteristics of Power Plants Seeking Transmission Interconnection as of the End of 2021.Monthly U.S. Solar Generation,
2014–2021
• Total peak monthly U.S. solar generation increased
20
by a factor of 5.7 from 2014 to 2021.
U.S. Solar Electric Generation (TWh)
18
16 – U.S. electric generation in December 2021 (during the
14 low seasonal period of electric generation) was slightly
12
below the peak solar production in 2018.
10 – In May 2021, solar produced 5.4% of all U.S. electricity
8 production.
6
4
• Utility-scale solar electricity production (including
2 PV and CSP technologies) dropped by 53% from its
summer peak (May 2021) to its winter low
(December 2021), and DPV systems dropped 47%.
Nov-20
Nov-21
May-20
May-21
Dec-14
Jun-15
Dec-15
Jun-16
Dec-16
Jun-17
Dec-17
Jun-18
Dec-18
Jun-19
Dec-19
– The drop in production would likely be greater without
CSP Residential PV C&I PV UPV Total continued builds of solar installations throughout the
year.
Note: EIA monthly data for 2021 are not final. Additionally, smaller utilities report information to
EIA on a yearly basis, and therefore, a certain amount of solar data have not yet been reported.
“Net Generation” includes DPV generation.
Sources: EIA, “Monthly Energy Review,” (April 2022). NREL | 31U.S. Installation Breakdown
Annual: EIA (GWac)
• At the end of 2021, there were 92.5 GWac of cumulative PV • Despite representing only 23% of installed U.S. PV
installations. capacity at the end of 2021, 96% of PV systems—over 3
million systems—were residential applications.
• EIA reports that at the end of 2021, 64% of U.S. installed PV capacity
was from utility-scale PV systems.
Cumulative U.S. PV Installations as of Cumulative U.S. PV Installations as of
December 2021 (92.5 GWac) December 2021 (number)
Utility
C&I 3,434
Residential 12.0
21.0
Residential
3,012,404
Utility-scale
59.5 C&I
106,785
Note: EIA reports values in Wac which is standard for utilities. The solar industry has traditionally reported in Wdc. See the next slide for values reported in Wdc. NREL | 32
Sources: EIA, “Electric Power Monthly,” forms EIA-023, EIA-826, EIA-860, and EIA-861 (April 2022, February 2021, February 2019).EIA Projections Over Time
• Between EIA’s Annual Energy Outlook (AEO) 2017
and EIA’s AEO2022, PV projections have increased
significantly.
1400 – AEO2022 projects 145 TWh more deployment by 2050
1200 145 AEO2022 than AEO2021, continuing a trend a of the past few
years (except for AEO2018/2019 which gave similar
U.S. solar Generation (TWh)
AEO2021
125
1000
AEO2020 2050 projections).
128
800 AEO2019 – Between 2024 and 2034, projections of solar
x3 150 AEO2018 generation nearly tripled between AEO2017 and
600
AEO2017 AEO2022.
400
200 – AEO2022 projects a markedly
400
x20 steeper ramp (over 20x faster
0
2020 2023 2026 2029 2032 2035 2038 2041 2044 2047 2050 steeper than that projected in
AEO2017) in solar generation
200 from 2023 to 2024.
0
2020 2023 2026
NREL | 33
Sources: EIA, 2022 Annual Energy Outlook, reference case.AEO Compared to Solar
Futures Study
• Despite these increases, compared to the Solar
3,500
Futures Study (SFS) scenarios, AEO2022 still
3,000 AEO2022 projects increases will fall short of the scale
U.S. Solar Generation (TWh)
2,500
needed to meet the Biden Administration
SFS Reference
climate goals.
2,000
SFS Decarb – By 2035, AEO2022 projects nearly the same
1,500
solar generation as the SFS Reference
SFS Decarb+E
1,000 scenario and less than half the solar
500
generation modelled in the Decarb scenario.
0
– By 2050 , AEO2022 projects 200 TWh less
solar generation than the SFS Reference
2020 2035 2050
scenario and 56% of the Decarb scenario.
NREL | 34
Sources: EIA, 2022 Annual Energy Outlook, reference case, Solar Futures Study scenarios.U.S. Off-Site Corporate
Solar PPAs
• Led by the tech industry and Fortune 500 companies,
U.S. corporate solar contracts were up 17% in 2021, y/y,
14 and the contracted capacity was 15 times larger than 5
years ago.
12
Other/Unknown – The United States represented approximately 73% of
10 Virtual PPA the global offsite corporate solar market in 2021,
followed by Spain (8%) and Canada (4%).
Signed PPAs (GW)
Green Tariff
8 – 70% of the 2021 U.S. solar contracts were in the form of
virtual PPAs, with the remainder coming mostly from
6 green tariffs.
4 – In addition to the 13.3 GW of U.S. solar PPAs,
companies signed 3.6 GW of U.S. wind projects.
2
• Through 2021, the leading five U.S. offsite corporate
0 solar offtakers were Amazon, Meta, Microsoft, Google,
2013 2014 2015 2016 2017 2018 2019 2020 2021 and Verizon, with a collective 20 GW of PPAs.
– In 2021 alone, Amazon signed 3.2 GW, Microsoft signed
2.5 GW, and Meta signed 2.0 GW of offsite U.S. solar
PPAs.
NREL | 35
Sources: BloombergNEF, “Corporate PPA Deal Tracker,” as of March 9, 2022.Residential Uptick in Building-
Integrated Photovoltaics in California
2.5 3.5% • In 2021, 2.2 MW of residential building-
integrated photovoltaics (BIPV) was installed in
Percent of Residential Market
Residential Installations MWdc)
3.0%
2.0 the California IOU territories—its highest
BIPV Market share 2.5% amount in over a decade of tracking.
1.5
– The BIPV growth in 2021 continued the trend of
2.0% rapid growth observed in 2020.
1.5%
– Tesla installed 98% of this BIPV capacity in 2021.
1.0
• Tesla may face more competition in the near
1.0%
future. One of the largest roofing manufacturers
0.5
0.5% in North America, GAF – which supplied roofs to
roughly ¼ of North American homes – launched
0.0 0.0% a solar shingle product of their own in late 2021.
• Despite this growth, BIPV made up only 0.2% of
total residential PV installed in the California IOU
territories in 2020 and 2021.
Note: BIPV, as defined by the California Energy Commission’s PV Module List, includes modules that are not rack mounted.
Sources: CA NEM database (12/31/21); Fast Company (05/03/22); Forbes (04/19/21). NREL | 36Bifacial Increase in California
• In 2021, 43 MW of bifacial modules was installed in the
Distributed PV Installations California IOU territories—three times more than in
2020.
– 7 MW (0.6%) of residential capacity was bifacial.
– 36 MW (9%) of nonresidential capacity was bifacial.
40 Bifacial residential 10%
Bifacial nonresidential 9% • Flat-roof nonresidential PV installations provide bifacial
35
energy gain, but typical sloped residential rooftop
8% installations do not provide bifacial gain.
Installations (MWdc)
Bifacial market share residential
Percent of Market
30
7% – Bifacial modules were associated with larger
Bifacial market share nonresidential
25 nonresidential systems; for example, 18% of
6% nonresidential capacity was bifacial in 2021 for systems
of 500+ kW.
20 5%
4% – Size trends for bifacial versus monofacial modules were
15 less pronounced for residential systems.
3%
10 – Installers may use bifacial modules to avoid tariff-related
2% module costs: bifacial modules were exempt from
Section 201 tariffs (enacted February 2018) from June
5 2019 to November 2020, and from November 2021 to
1%
the present.
0 0%
2014 2015 2016 2017 2018 2019 2020 2021
• California’s distributed generation data do not include
utility-scale PV projects, which are the primary
application for bifacial modules.
Note: Bifacial modules are defined as having the term “bifacial” in the description field in the California Energy Commission’s PV Module List.
Source: CA NEM database (12/31/21); Solar Power World (11/16/21); DOE, Solar Futures Study NREL | 37Annual Community Solar
Installations, 2006–2021
2,000
• Cumulative community solar capacity topped 5
1,800
Annual Installed Capacity (MWac)
Other States + DC GWac as of 2021 and spanned ~2,000 projects in 40
1,600
MD states and Washington, D.C.
1,400 IL
• As of 2021, annual U.S. installations were 43% (1.8
1,200 CO
GWac) above 2020 installations thanks largely to
1,000 GA
over 1 GWac of installations in Florida.
AR
800
TX • The second-largest state in 2021 was New York with
600
MA over 300 MWac of projects. It installed 414 GWac
400 NY of community solar projects from 2016 to 2020.
200 MN
0 FL
2006
2007
2008
2009
2010
2011
2012
2013
2014
2015
2016
2017
2018
2019
2020
2021
Note: The National Renewable Energy Laboratory’s (NREL) definition of Community Solar: “… a solar installation with multiple offtakers or owners, referred to as “subscribers.” The
subscribers enter a contractual relationship with the owner or operator of the installation (or an intermediary) to receive some or all of the financial returns from a predefined
share of the installation’s output.” Data Source: NREL Sharing the Sun data set (2022) and publication (2021) NREL | 38Planned Community Solar
Installations, 2021
• Nearly 5.9 GWac of projects were in the
NREL project queue as of 2021, indicating the
market is continuing to grow; most of the
planned capacity was in Florida, New York,
Minnesota, and Maryland.
– Projects in the NREL queue are either under
construction or were awarded and accepted
project capacity from administrators.
– If all these projects come online, the cumulative
community solar capacity would double.
FL: Duke Energy Program and FPL Program, NY: New York Solar Electric Programs Reported by NYSERDA ; MN: Xcel Compliance Filling Monthly Update, DOCKET No.
13-867 Xcel projects only; MD: Community solar pilot program MA: Solar Massachusetts Renewable Target (SMART) Application Update; NJ: Community Solar
NREL | 39
Program; CO: Solar*Rewards RES Compliance Report Xcel projects only; IL: Adjustable Block Program Community Solar; OR: Community solar program inU.S. Energy Storage Installations • California continues to dominate front-of-the meter and
by Market Segment residential installations. And Puerto Rico, Texas, Florida, and
Nevada had significant 2021 installations.
– Florida notably jumped from 1% to 10% of installations in Q4
• The United States installed approximately 10.6 GWh (3.6 GWac) of energy storage 2021 (mainly as a result of one 409 MWac project).
onto the electric grid in 2021, +197% (+144%) y/y, as a result of record levels of
• New York overtook Massachusetts in the nonresidential sector
residential and front-of-the-meter deployment.
as a result of community-scale storage.
– Q4 2021 is the first quarter during which >1 GWac of front-of-the-meter storage was
installed. • Despite the record levels of storage deployment, over 2 GW of
– Front-of-the-meter, nonresidential, and residential were up 169%, 32%, and 86% in grid-scale capacity originally slated to come online in Q4 2021
2021 y/y, respectively. was delayed to 2022 and 2023 due to supply chain issues.
U.S. Energy Storage Installations by Market Segment
12,000 3,600 2021 U.S. Energy Storage Installations by Region
Energy Storage Installed (MWh)
Energy Storage Installed (MW)
Front-of-the-Meter (MWh) Front-of-the-Meter (MW) (10.6 GWh)
10,000 Nonresidential (MWh) Nonresidential (MW) 3,000
Florida 11%
8,000 Residential (MWh) Residential (MW) 2,400 Arizona 2%
6,000 1,800
Texas
4,000 1,200 Other 4% 10%
California
New York 1%
2,000 600 63%
Hawaii 2%
0 0
2013 2014 2015 2016 2017 2018 2019 2020 2021 Massachusetts 2%
Nevada 5%
Source: Wood Mackenzie Power & Renewables and Energy Storage Association, U.S. Energy Storage Monitor: Q4 2021. NREL | 40
Ohio nonresidential deployment MW data were corrected for a suspected data entry error.Agenda
• In a select data set of utility-scale PV systems owned by
1 Global Solar Deployment 25 regulated utilities for 166 projects totaling 7.3 GWac,
the median system price in 2021 was $1.20/Wac
2 U.S. PV Deployment ($0.97/Wdc)—down 11% y/y in Wac but up 8% in Wdc.
• The median reported price by EnergySage for residential
3 PV System Pricing PV systems decreased 2.5% between H2 2020 and H2
2021 but increased between H1 and H2 2021—the first
4 Global Manufacturing reported increase on record.
5 Component Pricing – EnergySage reports an increase in storage costs—
unlike solar pricing—over time. Many of the increases
in state price medians are correlated to a decrease in
6 Market Activity
median system size.
7 U.S. PV Imports
NREL | 41Utility-Owned PV Pricing (>5 MW)
$10
Median (AC)
$9
Capacity-weighted Average (AC)
$8 Individual projects (AC) In a select data set of utility-scale PV systems owned
by 25 regulated utilities for 166 projects totaling 7.3
Installed Cost ($/Wac)
$7 Median (DC)
$6
Capacity-weighted average (DC) GWac, the median system price in 2021 was
Individual projects (DC)
$5 $1.20/Wac ($0.97/Wdc)—down 11% y/y in Wac but
$4 up 8% in Wdc.
$3 – The lowest and highest reported prices in 2021 were
$2 $0.95/Wac and $1.91/Wac ($0.76/Wdc and
$1
$1.49/Wdc).
$0 – From 2010 through 2021, system prices fell 13% per
2009 2010 2011 2012 2013 2014 2015 2016 2017 2018 2019 2020 2021 year on average per Wac and 15% per year on average
Project Completion Year per Wdc.
Sources: FERC Form 1 filings from the from the following utilities: Alabama Power, Allete, Arizona Public Service, Avangrid, DTE, Duke Energy, El
Paso Electric, Florida Power and Light, Georgia Power, Indiana Michigan Power, Kentucky Utilities, Nevada Power, Pacific Gas and Electric, Public
NREL | 42
Service of New Mexico, Southern California Edison, Tampa Electric, Tucson Electric, United Illuminating, UNS Electric, and Virginia Electric.Utility-Owned PV Pricing (>5 MW) • In a select data set of utility-scale PV systems
(166 projects totaling 7.3 GWac) owned by 25
$4.0 regulated utilities, the average system size has
Southwest 10 MW
$3.5 Southeast trended upward as system pricing has trended
Midwest 100 MW
$3.0 Mid-Atlantic downward over the past 7 years.
Installed Cost ($/Wac)
Sizing
$2.5
– The average system size in this data set was
15 MWac in 2015 and 73 MWac in 2021 (94
$2.0
MWdc).
$1.5
• System prices have been relatively in-line
$1.0 across several different regions but generally
$0.5 lower in the Southeast.
$0.0 – Utility-owned projects still represent a
Dec-14 May-16 Sep-17 Feb-19 Jun-20 Oct-21 minority of all PV systems installed in the
Project Completion Year
United States, and prices may differ from IPP-
owned projects.
Sources: FERC Form 1 filings from the from the following utilities: Alabama Power, Allete, Arizona Public Service,
Avangrid, DTE, Duke Energy, El Paso Electric, Florida Power and Light, Georgia Power, Indiana Michigan Power,
Kentucky Utilities, Nevada Power, Pacific Gas and Electric, Public Service of New Mexico, Southern California NREL | 43
Edison, Tampa Electric, Tucson Electric, United Illuminating, UNS Electric, and Virginia Electric.System Pricing from Select States
$5.0 • From H2 2020 to H2 2021, the median reported PV
$4.5 system price in Arizona, California, Connecticut,
$4.0
Massachusetts, and New York:
System Price ($/Wdc)
$3.5 – Fell 2% to $3.90/W for systems from 2.5 kW to 10 kW
$3.0 – Was flat at $3.40/W for systems from 10 kW to 100 kW
$2.5 – Fell 6% to $2.36/W for systems from 100 kW to 500 kW
$2.0 – Fell 6% to $1.77/W for systems from 500 kW to 5 MW.
$1.5
• Adding system data available after the previous
$1.0 2.5–10 kW 10–100 kW Solar Industry Update was published (in January
100–500 kW 500 kW - 5 MW
$0.5 2022) resulted in a 6% lower H2 2021 price for
$0.0 systems from 500 kW to 5 MW, compared with the
H1 H2 H1 H2 H1 H2 H1 H2 H1 H2 H1 H2 H1 H2 H2 2021 price reported in January.
2015 2016 2017 2018 2019 2020 2021
2021 MW: Arizona (210), California (1,040), Connecticut (36), Massachusetts (383), New York (546)
Note: System prices above $10/W and below $0.75/W were removed from the data set. There were not enough reported prices for systems
above 5 MW in this data set to show a trend over time.
Sources: Arizona (date of data varies, as late as 2/28/22); California NEM database (12/31/21); Connecticut (1/13/22); Massachusetts SREC
(09/01/21) and SMART (1/28/22) programs; NYSERDA (2/22/22). NREL | 44System Pricing from • The median price of a 10–100 kW system in New York
was 12% lower than the median in Arizona.
Select States, H2 2021 • The low Arizona price for 100–500 kW systems is mostly
due to 26 Salt River Project systems in H2 2021.
• Sample sizes are small for larger systems: 39 total
• In addition to price differences based on system size, there is variation
systems of 5 MW+, 123 systems of 500 kW–5 MW, and
between states and within individual markets.
351 systems of 100–500 kW, compared with about
84,000 systems of less than 100 kW.
$6
Bars represent the median, with error bars
$5 representing 80th and 20th percentiles.
System Price ($/Wdc)
$4
$3
$2
$1
$0
AZ CA MA NY AZ CA MA NY AZ CA MA NY AZ CA MA NY MA NY
2.5 kW–10 kW 10 kW–100 kW 100 kW–500 kW 500 kW–5 MW 5 MW+
2021 MW: Arizona (210), California (1,040), Massachusetts (383), New York (546)
Note: System prices above $10/W and below $0.75/W were removed from the data set.
Sources: Arizona (date of data varies, as late as 2/28/22); California NEM database (12/31/21); Massachusetts SREC (09/01/21) and SMART (1/28/22) NREL | 45
programs; NYSERDA (2/22/22).Sunrun and SunPower
Cost and Value, Q4 2021
• Residential installers reported reduced productivity
and higher-than-expected costs in Q4 2021 related to
$6.0 Net Value the COVID-19 omicron surge, adverse weather, and
G&A continuing supply chain and labor challenges.
$5.0 Sales – Tesla cited import delays of solar components as
$0.95 Installation the reason its Q1 2022 deployment shrank 48%.
$1.23
$4.0 • Costs include PV systems paired with batteries,
Installed Cost ($/W)
$0.18
$0.28 which are increasing in popularity.
$1.12 $0.68 $0.88
$3.0 $1.04 – Sunrun battery installations increased more than
$0.25
$0.24
$0.26 100% y/y in 2021, totaling 32,000 PV+storage
$0.34
systems (~5% of total customers).
$2.0
– Sunnova reported a battery attachment rate of
$2.52 $2.74
$2.46 22% in Q4 2021, and an increase in battery
$2.26
$1.0 penetration rate from 9% at end of 2020 to 11%
at end of 2021.
$0.0 – Tesla announced in April 2021 it would only sell
Q4 '20 Q4 '21 Q4 '20 Q4 '21 solar paired with storage.
Sunrun SunPower (residential)
NREL | 46
Sources: Corporate filings; UtilityDive (04/27/21).Cost over Time
Residential System Price Reported $5
by EnergySage
Median Gross Costs ($/W)
$4 3.80 3.65
3.35
3.74 3.10 3.00 2.89
$3 3.50 2.75 2.68
3.18 3.06 2.93 2.85
$2 2.67
• The median reported price by EnergySage for
residential PV systems decreased 2.5% between H2 $1
2020 and H2 2021 but increased between H1 and H2 $0
2021—the first reported increase on record. H2 H1 H2 H1 H2 H1 H2 H1 H2 H1 H2 H1 H2 H1 H2
2014 2015 2016 2017 2018 2019 2020 2021
• Residential system price varied by state. In H2 2021,
the median price of a residential system in Cost by State, H2 2021
Massachusetts was 33% higher than the median price $5
of a residential system in Arizona.
Median Gross Costs ($/W)
$4
– Part of the price disparity between states is due to 2.97 3.00
2.74 2.77 2.78
differences in average system size, though other factors, $3 2.51 2.59 2.68
2.25 2.40 2.40
such as cost of living (e.g., Massachusetts), also play a role. $2
$1
$0
AZ FL NV TX CA U.S. NJ VA NC GA MA
Note: price based on winning quoted price. NREL | 47
Source: EnergySage, “Solar Market place Intel Report H1 2021 – H2 2021.”You can also read