Design and Implementation of an Energy-Efficient Weather Station for Wind Data Collection
←
→
Page content transcription
If your browser does not render page correctly, please read the page content below
sensors
Article
Design and Implementation of an Energy-Efficient Weather
Station for Wind Data Collection †
Padma Balaji Leelavinodhan 1,2 , Massimo Vecchio 1, * , Fabio Antonelli 1 , Andrea Maestrini 1
and Davide Brunelli 2

                                          1   OpenIoT Research Unit, Fondazione Bruno Kessler, 38123 Trento, Italy; pleelavinodhan@fbk.eu (P.B.L.);
                                              fantonelli@fbk.eu (F.A.); amaestrini@fbk.eu (A.M.)
                                          2   Department of Industrial Engineering, University of Trento, 38122 Trento, Italy; davide.brunelli@unitn.it
                                          *   Correspondence: mvecchio@fbk.eu
                                          †   This paper is an extended version of our paper Leelavinodhan, P.B.; Antonelli, F.; Vecchio, M.; Maestrini, A.
                                              Energy-neutral weather stations for precision agriculture: Challenges and approaches. In Proceedings of the
                                              2020 IEEE International Workshop on Metrology for Agriculture and Forestry (MetroAgriFor), Trento, Italy,
                                              4–6 November 2020; pp. 24–28.

                                          Abstract: Agriculture faces critical challenges caused by changing climatic factors and weather
                                          patterns with random distribution. This has increased the need for accurate local weather predictions
                                          and weather data collection to support precision agriculture. The demand for uninterrupted weather
                                          stations is overwhelming, and the Internet of Things (IoT) has the potential to address this demand.
                                          One major challenge of energy constraint in remotely deployed IoT devices can be resolved using
                                          weather stations that are energy neutral. This paper focuses on optimizing the energy consumption
                                of a weather station by optimizing the data collected and sent from the sensor deployed in remote

                                          locations. An asynchronous optimization algorithm for wind data collection has been successfully
Citation: Leelavinodhan, P.B.;
                                          developed, using the development lifecyle specifically designed for weather stations and focused on
Vecchio, M.; Antonelli, F.; Maestrini,
                                          achieving energy neutrality. The developed IoT weather station was deployed in the field, and it has
A.; Brunelli, D. Design and
                                          the potential to reduce the power consumption of the weather station by more than 60%.
Implementation of an
Energy-Efficient Weather Station for
Wind Data Collection. Sensors 2021,
                                          Keywords: weather station; wind data; energy neutrality; precision agriculture; meteorology
21, 3831. https://doi.org/
10.3390/s21113831

Academic Editor: Nick Harris              1. Introduction
                                               Climate change can potentially disrupt whole national economies, with dramatic
Received: 31 March 2021                   consequences for the lives and livelihoods of every human in this world. Weather patterns
Accepted: 26 May 2021
                                          are changing, sea levels are rising, while exceptional weather events are becoming more
Published: 1 June 2021
                                          and more extreme. Climate action represents one of the 17 Sustainable Development Goals
                                          (SDGs) of the United Nations’ 2020 report [1], while the farming industry globally feels the
Publisher’s Note: MDPI stays neutral
                                          impact of climate change, through changing rainfall patterns, unseasonal weather, rising
with regard to jurisdictional claims in
                                          temperatures, and extreme climate events [2]. NASA’s evidences for this rapid climate
published maps and institutional affil-
                                          change are compelling: the planet’s average surface temperature has risen about 1.18 ◦ C
iations.
                                          since the late 19th century [3]. These mean changes in temperatures and precipitations,
                                          as well as more frequent abnormal weather events, affect crop yields, creating immense
                                          financial pressure [4]. In the European Union (EU) alone, 22 million people are employed
                                          directly in the farming sector and up to 44 million people rely on the food sector [5]. To
Copyright: © 2021 by the authors.         worsen the situation, the use of excessive fertilizers and pesticides is becoming a common
Licensee MDPI, Basel, Switzerland.
                                          agricultural practice that is causing multiple farmlands issues, such as land degradation,
This article is an open access article
                                          nutrient loss, and biodiversity loss. In general, more sustainable practices for agricultural
distributed under the terms and
                                          production and food systems are required to combat this dangerous escalation.
conditions of the Creative Commons
                                               Variability of the weather conditions, even within small regions, has increased the
Attribution (CC BY) license (https://
                                          demand for local sensor systems to monitor the crops with the objective of taking the
creativecommons.org/licenses/by/
                                          correct decision at the right time. Today, sensing the local weather conditions plays a vital
4.0/).

Sensors 2021, 21, 3831. https://doi.org/10.3390/s21113831                                                      https://www.mdpi.com/journal/sensors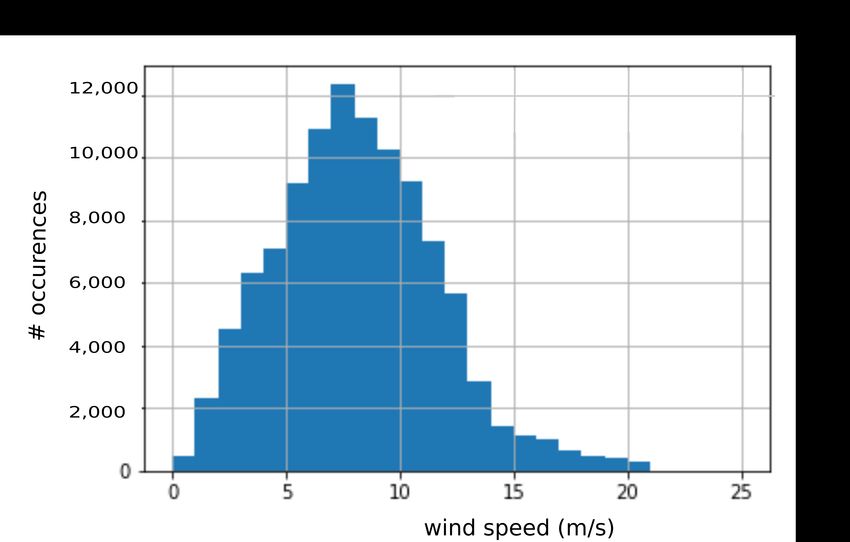
Sensors 2021, 21, 3831                                                                                            2 of 18

                         role in effective decision-making systems based on precision agriculture technology [6].
                         Precision agriculture is a management strategy to improve the production and quality of
                         the crops through Information Technology (IT) [7]. It is focused on collecting data from the
                         agricultural fields and using this data for analysis to improve the quality and the quantity
                         of crop yields. The collected data can be then used to mitigate the crops from various
                         adverse events, like undesirable climate, over usage of pesticides, diseases, and weeds,
                         and take measures to reduce the impact of such events. In precision agriculture, wind data
                         represents important information for estimating parameters, such as precipitation [8], soil
                         health [9–11], and early-warning frosts [12]; therefore, such knowledge is a valid instrument
                         for the farmer to reduce losses due to climatic factors. Furthermore, it is worth recalling
                         that wind information is also useful in other sectors, such as energy generation [13–15],
                         operation safety of Unmanned Aerial Vehicles (UAVs) [16], and even buildings [17]. Thus,
                         the development of cost-effective and robust weather stations able to collect wind data in
                         private fields is the need of the hour.
                              In response to this urgency of the agricultural sector, the Internet of Things (IoT) can
                         be a trusted ally, as it has the potential to enable uninterrupted data collection from remote
                         environments at relatively low costs [18]. Generally speaking, the demands of modern IoT-
                         based deployments [19] are related to security, privacy, reliability, scalability, etc. However,
                         when thinking about IoT devices as monitoring and actuation elements in agricultural and
                         rural scenarios, even more elementary needs act as inhibitors of the IoT global adoption.
                         Only to mention the most urgent ones: we require long-range, affordable, and power-aware
                         radio communication technologies, the need for cheap yet robust hardware devices able
                         to work outdoor and unattended for at least one yield season, the ease of installation and
                         operations [20].
                              Notwithstanding these premises, in the last few years, the demand for modular,
                         robust, and uninterrupted IoT-based weather stations is exploding. In the literature, there
                         are different system architectures for weather data collection, as listed in Reference [21].
                         The wide spread of open-source IoT software platforms and technologies, as well as the
                         availability of open-source hardware projects have highly reduced the development costs
                         and the deployment efforts of personal IoT systems. Therefore, some of today’s IoT-based
                         weather stations are cheap and easy to install and maintain [22], while they can collect data
                         from the fields and transmit them to distant servers in an affordable way [23]. However,
                         the majority of commercially available IoT-based weather stations fail to address the energy
                         constraints, resulting in the limitation of the technology. The energy problem in wireless
                         sensor networks, which includes IoT, is one of the significant barriers preventing the full
                         exploitation of this technology [24]. Usually, researchers model the energy problem as
                         an optimization problem, tackled in different ways that we can group into two major
                         categories, namely:
                         •    Hardware optimization:the correct selection and integration of hardware components
                              (microcontrollers, sensors, and communication technology) plays a vital role in achiev-
                              ing hardware optimization. For instance, in the context of low-power wide-area
                              network communication technologies, LoRa (acronym of Long Range) is often consid-
                              ered as a suitable choice to develop a remote weather station ([25,26]), although there
                              are also other technologies observed in the literature, such as WiFi [27] and Xbee [28].
                         •    Software optimization: the most used optimization strategy in this context is fine-
                              tuning the operating system’s scheduling policy so as to reduce power consump-
                              tion [29]. Other approaches include the adoption of smart software modules that,
                              by avoiding the transmission of redundant values, can reduce the average data trans-
                              mission rate, reducing the overall power consumption as a consequence [7,30,31].
                              The aforementioned works are focused only on the implementation of the weather
                         station and fail to estimate the power requirements of the weather station. They try to
                         reduce the power consumption by using low-power electronics or optimization algorithms
                         but fail to consider the battery requirements. Some commercially available solutions for
                         weather data collection rely on non-rechargeable batteries, so optimizing battery life is vital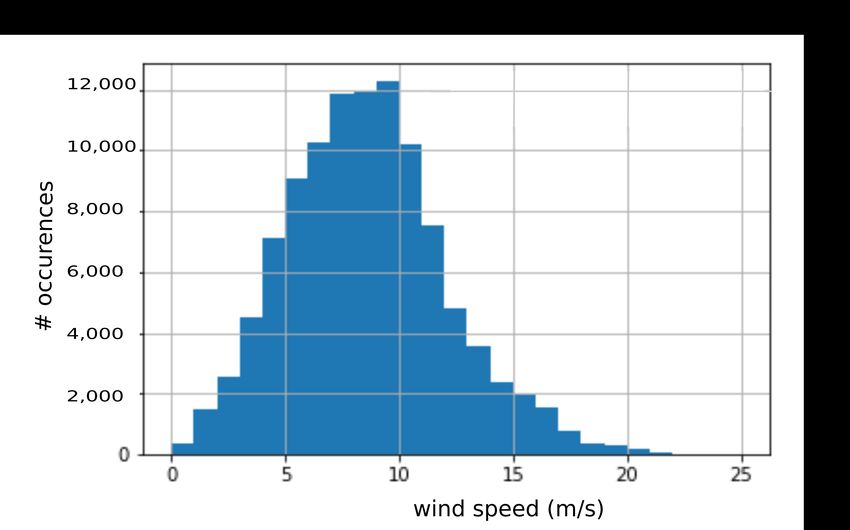
Sensors 2021, 21, 3831                                                                                           3 of 18

                         in these cases. Batteries pose environmental issues, as their proper disposal costs both time
                         and money. Furthermore, weather stations are installed frequently in locations that are
                         difficult to access. So, the labor costs of battery replacement are considerable. A battery-
                         powered IoT weather station is introduced in Reference [32] bringing in the perspective of
                         power consumption measurements in the weather station. However, most of the works
                         dealing with the development of energy-neutral weather stations for precision agriculture
                         is mere implementation and integration effort [21,27,28,33,34]. A holistic approach to solve
                         the energy demand by using rechargeable batteries, low power electronics, optimization
                         algorithms in embedded software as a whole package is not considered in the literature.
                         Even if we consider weather stations endowed with rechargeable batteries and solar
                         panels, we argue that saving energy by employing optimized embedded software is still a
                         desirable feature. With more power efficiency, such weather stations will require smaller
                         batteries and solar panels, which reduces the cost and improves the sustainability of the
                         monitoring system. In this niching literature, we can find research efforts focused on
                         achieving uninterrupted weather data collection using state-of-the-art energy harvesting
                         and storage technologies.
                               We argue that a system-level view is required to design IoT devices that are energy-
                         neutral [35]. This problem statement is complex and connected to different domains, such
                         as energy harvesting, low power electronics, software engineering, meteorology, etc. So,
                         systematic development is required, and this problem should be considered as a design
                         problem rather than an optimization problem. Along this line, we recently introduced
                         a systematic approach to the design of such an energy-neutral IoT weather station [36].
                         Following the weather station development lifecycle proposed in the previous work, in this
                         paper, we develop, deploy, and profile from an energy consumption perspective a real-time
                         wind weather station. Briefly, by extending our previous work, this paper proposes a new
                         possibility to optimize the weather station’s energy requirements, thereby opening the
                         perspective to energy-neutral weather stations. The main contribution of this paper is a
                         complete design, development, and validation of an asynchronous optimization algorithm
                         for a weather station with wind data collection. In addition, the energy profile of the
                         weather station is studied, and its energy requirements are estimated.
                               The rest of this paper is structured as follows: Section 2 provides the rationale of
                         this paper, with detailed information on setting the experiments required for the analysis,
                         methods to validate the data from the experiments performed, and to interpret its results.
                         Section 3 introduces the technical specifications of the anemometer for wind data collec-
                         tion, both from the software and hardware development perspectives. Then, Section 4
                         proposes a novel algorithm to optimize the energy consumption during wind data col-
                         lection procedure, based on wind speed and direction. On completion of weather station
                         development, it is necessary to estimate its energy requirements: In Section 5, the energy
                         profile of the weather station is measured, and the energy requirements for uninterrupted
                         operation of the weather station is estimated. In Section 6, the proposed framework is
                         thoroughly validated in a simulation environment using a public available weather dataset
                         from the National Renewable Energy Laboratory (NREL) and in real-time deployment.
                         Finally, in Section 7, we draw our conclusions, briefly identifying the most promising future
                         research paths.

                         2. Materials and Methods
                               This section summarizes our previous work also introducing the rationale of this
                         paper. Its main goal is to provide an overview of the proposed approach and the planned
                         experiments, as well as means to interpret the obtained results.
                               In our previous work [36], the intricate details of developing an energy-neutral weather
                         station were studied. Specifically, we proposed a development life cycle that can be used to
                         drive the design and the development of a real weather station, as shown in Figure 1.
                               The primary challenge of designing an energy-neutral weather station is to optimize
                         all of its components and sensors in terms of energy consumption to reach neutrality.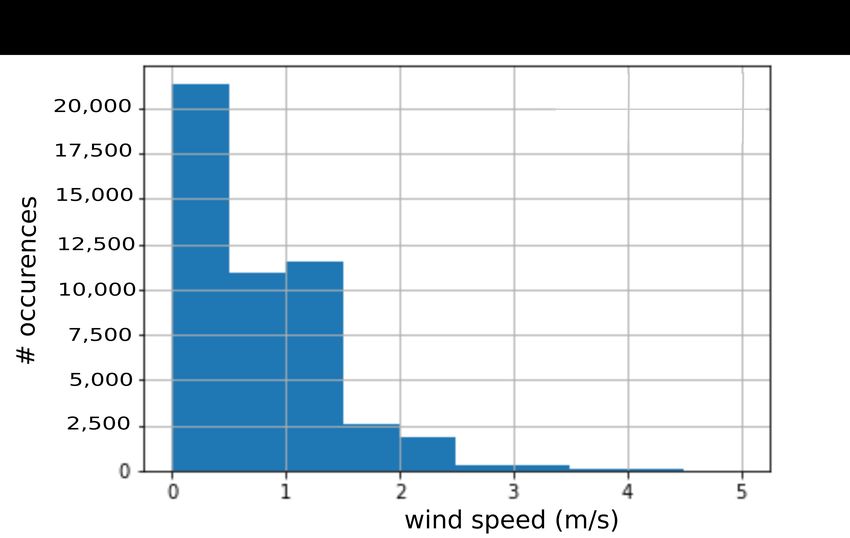
Sensors 2021, 21, 3831                                                                                               4 of 18

                         The resulting device can absorb or harvest enough energy from the environment (e.g.,
                         light, heat, radio waves, etc.) and generate the required electricity for its operation [36].
                         The first phase of the proposed life cycle consists of collecting the technical specifications,
                         based on the user-specific requirements. For instance, if the user is a farmer who needs to
                         measure a set of parameters, such as rainfall level or wind speed, then suitable sensors,
                         like a rain gauge or an anemometer, have to be part of the weather station technical
                         specifications. After finalizing the technical specifications, it is necessary to understand
                         the sensor working and then interface it with the microcontroller through the embedded
                         development and integration tools. This activity opens up new opportunities to optimize
                         the energy consumption of the employed sensors, which is the objective of the next step,
                         namely the process optimization phase. The last phase consists of estimating the energy
                         demands based on the developed weather station to determine the design parameter of
                         the energy harvesting hardware with optimal accuracy.

                         Figure 1. Development life cycle of IoT based weather station proposed in the previous work [36].

                              Strictly following this methodology described in this paper, we focus on developing
                         a weather station endowed with an anemometer sensor for collecting wind data. Cost-
                         effective and open-source hardware and software resources are used for development,
                         narrowing down the search for available options. Wind speed measurements of the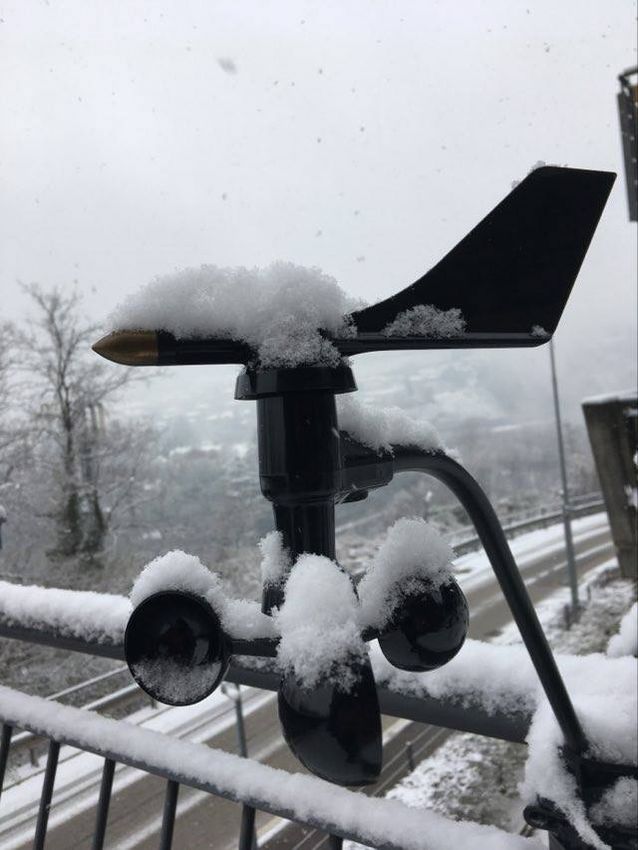
Sensors 2021, 21, 3831                                                                                            5 of 18

                         anemometer sensor depend on the sample period selected; therefore, a detailed analysis
                         on the selection of sample period is studied. Later, a simple interface is implemented
                         to collect the data from the anemometer. This data is beneficial to understand how the
                         anemometer sensor works. In addition, the relation between the parameters of wind
                         speed and wind direction is studied. The energy perspective of the weather station is
                         evaluated, and, finally, a new algorithm to collect the wind speed and direction is proposed,
                         implemented, and tested. The primary objective is to find the valuable data points and
                         send those data points through asynchronous wireless transmissions instead of sending all
                         the data at a fixed sample rate (i.e., in a synchronous way). Briefly, it is the end-user that,
                         by setting a wind speed threshold depending on the wind conditions of the deployment
                         site and/or the reconstruction error of the wind signal that his application can tolerate,
                         trades-off power consumption of the weather station and the accuracy of the monitored
                         phenomenon. The developed system only transmits significant data points, dropping
                         the ones below the set threshold. Values below the threshold limit are not stored in the
                         embedded system.
                               First of all, to validate the proposed asynchronous algorithm, real-time deployment
                         of the developed weather station is planned. However, to accurately validate the pro-
                         posed asynchronous approach, we need years of wind data. Therefore, we resort also to
                         a publicly available dataset, namely the National Renewable Energy Laboratory (NREL)
                         dataset. This wind dataset containing information about wind speed and direction is used
                         as input data for the proposed algorithm to have a more extensive simulation campaign.
                         The asynchronous algorithm focuses on reducing the number of transmissions which di-
                         rectly reduces the amount of energy consumed by the weather station. So, this analysis does
                         not provide the exact details of how much energy can be saved by the proposed algorithm,
                         but it provides proof of concept by counting the reduced number of transmissions.

                         3. Development of Weather Station for Wind Data Collection
                              In this section, the development life cycle for the proposed weather station is in-
                         troduced. Briefly, as shown in Figure 1, the development life cycle consists of 4 steps:
                         technical specifications, embedded development, process optimization, and energy de-
                         mand estimation. The first two steps of this life cycle will be elaborated in this section,
                         while the remaining two will be detailed in Section 4. In each step, the energy perspec-
                         tives are investigated to direct this activity towards developing an energy-autonomous
                         weather station.
                              The first step is to capture the user requirements and convert these user requirements
                         into technical specifications. The second step is focused on developing the embedded
                         system that comprises both the hardware and software design followed by the development.
                         So, the hardware design of the weather station is a conversion of the user requirements.
                         After completing the hardware development, the embedded software development is
                         performed, focusing only on interfacing the peripherals.

                         3.1. Hardware Design
                               The primary user requirement for a weather station is the ability to collect wind data
                         (in terms of both wind speed and direction) from remote agricultural fields, with low
                         impact in terms of cost, installation and maintenance. Another stringent requirement is the
                         application longevity: the weather station should be operational even when deployed in a
                         harsh outdoor environment without any human intervention for at least one crop season.
                         Therefore, low-power electronics devices are selected to achieve optimal energy usage. A
                         cheap and low-power embedded system consisting of the following elements is derived to
                         address the aforementioned critical requirements.
                         1.   a cup anemometer (Davis DS6410);
                         2.   a low power MCU (Arduino Pro mini);
                         3.   a LoRa Communication Technology module (Mini-Lora v1.1a).
Sensors 2021, 21, 3831 6 of 18
The requirements of a wind sensor are robustness and the ability to measure wind
speed and wind direction. DS6410 anemometer, manufactured by Davis Instruments,
fits the requirements; hence, it was selected as the wind sensor [37]. This anemometer
transduces the wind direction by means of a wind vane connected to a linearly variable
electrical resistance within the range of 0–20 KΩ. The resistance value provided as an
analog output will change according to the actual wind direction. For such A/D conversion,
the 10-bit ADC internal to the MCU will be used. More in detail, the wind vane is calibrated
from the factory to output a value of 10 KΩ to represent the South direction with an angle
of 180° meaning that East, North, and West correspond to values-angles pairs of 15 KΩ-90°,
0 Ω-0° (thanks to a dead band around the North direction) and 5 KΩ-270°, respectively.
Conversely, the wind speed is digitally transduced by the anemometer by means of three
wind cups that are free to rotate in the presence of wind. More in detail, each full revolution
of the wind cups close a mercury switch, hence producing a digital pulse as output.
The number of pulses can be converted into actual wind speed using the conversion
formula provided in the device datasheet:
p × 2.25
v= , (1)
T
where v is the wind speed measured in miles per hour (mph), T is the sample period in
seconds (s), and p is the number of full pulses measured within the sample period T. It is
important to note the value of a number of pulses measured within the sample period (p)
will be a non-negative integer.
From Equation (1), we observe that T proportionally affects the wind speed resolution.
For instance, if the sample period selected for an application was 1 s, recalling that p
can assume only non-negative integer values, the minimum speed measured would be
2.25 mph, and multiples of such a value could be measured and reported by the sensor.
We say that the sensor resolution r is equal to 2.25 mph. The opposite is also true: the
more we increase T, the r becomes small and more precise, as depicted in Figure 2. Clearly,
T directly affects the power consumption of the weather station, as the latter has to stay
active during the whole measurement period to count the number of pulses from the sensor.
Therefore, a suitable trade-off between power consumption and sensor resolution has to be
reached. For our experiments, we set T = 5 s to measure wind speeds that are multiples of
r = 0.45 miles per hour, which is a good trade-off for the types of winds characterizing our
deployment field (see Section 6).
Figure 2. Sample period (T) vs wind speed resolution (r).Sensors 2021, 21, 3831 7 of 18
Regarding the communication unit, we opted for the Mini Lora Node (https://github.
com/hallard/Mini-LoRa, accessed on 30 May 2021). Briefly, it is an open-source hardware
project providing the interface between the RFM95 Low Power Long Range Transceiver
Module (https://www.rfsolutions.co.uk/downloads/1463993415RFM95_96_97_98W.pdf,
accessed on 30 May 2021) and the Arduino Pro Mini through a Serial Peripheral Interface
(SPI) on a single PCB, with a dedicated room for various types of battery holders, such as
AA, A, 18650. With this integration board, the selected MCU could be easily connected
to the radio module, without affecting the other pins of the board, hence making the
prototyping and testing phases straightforward. Specifically, only pins A0, D1, D7, D8,
D10(SS), D11(MOSI), D12(MISO), D13(SCK) of the Arduino Pro Mini were used to interface
it with the RFM95 module of the integration board.
Regarding the IoT infrastructure, a LoRaWAN gateway was installed in our premises
to collect the data sent from the weather station, while the data collected was stored using a
Raptorbox instance (https://smks.fbk.eu/it/results/raptorbox-the-iot-platform, accessed
on 30 May 2021), which is an open-source IoT platform we have developed for rapid
prototyping of IoT applications purposes.
The complete circuit diagram for connecting the anemometer to the microcontroller
board is depicted in Figure 3. More in detail, the anemometer was interfaced with an
Arduino Pro Mini [38] development board and then deployed outdoor. The latter is based
on the ATmega328P [39] microcontroller with a working frequency of 16 MHz, manufac-
tured by Microchip [40] and endowed with 32K bytes of in-system self-programmable flash
program memory and 1K bytes of EEPROM.
Figure 3. Anemometer connection circuit.
We selected this board for our application because of its reduced cost, small size,
and its appealing low power capabilities. ATmega328P is capable of operating at a low
current of 1 µA in the power-down mode and 1.5 mA in the active mode (3 V@4 MHz
configuration). Moreover, as a member of the Arduino open-source ecosystem, it was the
perfect match for our fast-prototyping needs. The ATmega328P can operate from 2.7 V
to 5.5 V and its power consumption varies based on the operating voltage, as well as the
clock frequency. For our application, a 3.3 V power supply and 8 MHz clock frequency
were selected.
Regarding the wiring, the anemometer came with an RJ11 male connector; therefore,
a suitable female port was used to connect the sensor to the board. Specifically, the four
lines of the connector (yellow, black, green, and red) were connected to the VCC, GND,Sensors 2021, 21, 3831 8 of 18
analog input 3 (A3, for wind direction), and digital input 3 (D3, wind pulses) of the board,
respectively. Then, an Otii Arc device from Qoitech [41] was used as a constant, linear
power supply to power the circuit. The latter is a smart power meter, so, as done in
Reference [23,42], we used it also to measure, profile and log the absorbed currents during
the experiments at very high resolution and sample rate.
3.2. Embedded Software Design
To develop an embedded system that is energy efficient, the hardware and the software
play a key role [35]. Without optimizing the software design, it is difficult to handle the
embedded system’s constraints and achieve optimal usage of resources. It is required to
explore the weather station’s functionalities before developing the algorithm and embedded
code. The three major functionalities of the weather station are as follows:
1. Collect the wind speed data using the number of pulses.
2. Collect the wind direction data using the analog to digital converter.
3. Schedule the collected wind speed and direction data for transmission to the LoRa
server.
Based on these three functionalities, an algorithm was developed to acquire the data
from the anemometer and send it to the LoRa server based on the transmission rate
requirements. The algorithm flow chart is available in Figure 4. Initially, the weather
station is powered up and connected to the server. Till the joining with the Lora network
is successful, the weather station retries. On successful joining, the rest of the activities
are planned. The internal ADC is used to convert the voltage across the linearly variable
resistance into a digital value, as mentioned in Section 3. This digital value represents the
wind direction, and it is mapped to degrees by the MCU. A software timer library and
an external interrupt of the MCU are employed to measure the wind speed. The pin3 of
the MCU counts the number of pulses received by the anemometer using the external
interrupt. As mentioned in Section 3, the timer module of the MCU uses the 5 s sampling
time configuration and, once this period is over, the number of pulses measured is used
to calculate the wind speed. Wind data consisting of the wind direction and speed are
queued for the next transmission. The weather station is switched to sleep mode for a time
calculated from the transmission rate requirements. Since the wind data is momentary, it is
essential to have low sleep time to capture sudden gusts.
Open-source libraries and tools were used to develop the embedded code. Arduino Pro
Mini was programmed using PlatformIO (https://platformio.org/, accessed on 30 May 2021)
which is a cross-platform, cross-architecture, multiple framework, professional tool for em-
bedded development. Arduino-LMIC (https://github.com/matthijskooijman/arduino-lmic,
accessed on 30 May 2021) library was used to program the LoRa interface with the Arduino
Pro Mini. The Arduino-LMIC library is a simple event-based programming model in which
all the functions are modeled as events or jobs. It has a built-in run-time environment to
take care of timer queues and job management. Finally, the open-source library TimerOne
(https://www.arduino.cc/reference/en/libraries/timerone/, accessed on 30 May 2021) was
used to develop the interface with the anemometer sensor and the Arduino Pro Mini.Sensors 2021, 21, 3831 9 of 18
Figure 4. Basic algorithm for wind data collection.
4. Process Optimization
Most of the recent related activities are focused on reducing the transmission rate at the
source, as transmitting data wirelessly is, generally, the most energy demanding task for the
sensing device [30,43]. Alternatively, one can use suitable power-aware data compression
schemes to reduce the average packet size, as done in Reference [31,44]. Reducing the
transmission rate is a viable strategy, but it could be worth tackling the challenge with
more understanding of the measured parameters, for instance, the one we describe in
the following.
Briefly, measuring the wind speed with the anemometer described in Section 3 is an
energy hungry task. In addition, the energy required to transmit this data is the most
energy consuming task of the whole weather station. It is pointless to collect the wind
direction data when there is no wind, and so the whole data transmission is not adding
value to the weather station. Therefore, our sensing board is programmed to periodically
execute a check for the presence of wind (that is if a pulse on its dedicated pin is detected).
After this check, if wind is detected, the MCU enters a speed measurement phase duringSensors 2021, 21, 3831 10 of 18
which it updates the counter through the external interrupt service routine. The measured
wind speed and wind direction are transmitted only if the wind speed is greater than the
threshold wind speed set by the user.
Our main idea is to reduce the power consumption of the sensing device by collecting
and sending only valuable information rather than sending all the information. This
problem has been addressed, and a novel asynchronous optimization algorithm to collect
the data from the anemometer is proposed in this section. The algorithm works based on
the value of two flags, namely the rotation flag and the data ready flag. The functionalities
of these flags are listed below.
• Rotation flag is set —Whenever the anemometer sends the pulse to the MCU using
the external interrupt service routine. This action wakes up the MCU from sleep.
• Rotation flag is reset—After the variable rotations is incremented. If the rotation
happens for the first time, this activates the timer to keep track of the sampling period.
• Data ready flag is set—When the timer completes its sampling period, it sets the data
ready flag in the timer interrupt service routine.
• Data ready flag is reset—After the wind data is scheduled to be transmitted, all the
variables and flags are reset. During this time, the data ready flag is also reset.
From Figure 5, there are two main activities in the optimization algorithm that deserve
attention. The first one is the LoRa transmission cycle, and the other one is the sleep mode
(they are marked in green and red in Figure 5, respectively). Initially, there is no wind data
available; therefore, the MCU is put into sleep mode. In the event of wind, the anemometer
cups start rotating; this rotation is transformed into a pulse by the anemometer and sent
to the MCU causing the external interrupt to happen. This interrupt sets the rotation flag
and wakes up the MCU. Simultaneously, the number of pulses are counted and the count
down starts for the sampling time T, 5 s, in our case. Only when the sampling time is
over, the data ready flag is set, and the MCU starts to calculate the wind data from the
available anemometer readings. The calculated values are scheduled to be sent if the wind
speed is greater than the threshold wind speed and stored in the transmission queue. All
the values and flags are reset, and the MCU is ready for collecting the next wind data.
The pseudo-code of the described algorithm is depicted in Listing 1.
Listing 1. Pseudo code for Asynchronous optimization algorithm.
wind data c o l l e c t i o n f u n c t i o n
i f data ready f l a g i s s e t
Stop t h e t i m e r
C a l c u l a t e t h e wind speed using t h e r o t a t i o n s value
C a l c u l a t e t h e wind d i r e c t i o n using t h e ADC
i f t h e wind speed i s g r e a t e r than t h e t h r e s h o l d
Queue t h e wind data f o r t h e n ex t t r a n s m i s s i o n
R e s e t v a r i a b l e s wind speed , wind d i r e c t i o n and r o t a t i o n s value
R e s e t r o t a t i o n f l a g and data ready f l a g
Reset timer
else
i f the r o t a t i o n f l a g i s s e t
i f r o t a t i o n o c c u r s t h e f i r s t time a f t e r r e s e t t i m e r
S t a r t the timer
Schedule t h e wind data c o l l e c t i o n j o b
else
while r o t a t i o n f l a g i s r e s e t
S l e e p f o r 500~ m i l l i s e c o n d s
timer i n t e r r u p t s e r v i c e routine
i f sampling time i s over
S e t data ready~ f l a gSensors 2021, 21, 3831 11 of 18
external interrupt service routine
Increment r o t a t i o n s value
Set rotation flag
Figure 5. Asynchronous optimization algorithm for wind data collection.
In our framework, the optimization of energy consumption is achieved by using the
low power operation and the proposed asynchronous optimization algorithm. The main
functionality of the algorithm is to compare the collected weather parameter and trigger
transmission only when it is greater than the threshold. This kind of transmission is
asynchronous and not based on any time period; hence, it can be adapted to other weather
parameters which are random by nature. In the next section, the energy perspective of the
weather station is explored.Sensors 2021, 21, 3831 12 of 18
5. Energy Demand
The weather station was deployed in an outdoor environment as depicted in Figure 6 and
an Otii Arc device was used to profile and record the weather station’s power consumption
during its operations. In this section, the energy consumption details of the wind weather
station are presented and discussed. Briefly, by using the Otii device and the corresponding
telemetry software, we could accurately measure the current, time, and energy values
summarized in Table 1.
Figure 6. Anemometer deployed in the outdoor environment.
More in detail, a transmission cycle consists of an active phase, a transmission phase,
and a reception phase, all measured using the Otii device. One transmission cycle took on
average 6000 ms. First, the weather station switches to the active state from the sleep mode.
Then, it transmits the data, waits for data reception, and, finally, upon data reception,
switches back to the sleep mode. In the Otii software, a specific data transmission teleme-
try chuck was selected to get measures in terms of maximum current, average current,
and energy consumption during that data transmission. The weather station operates in
the active state most of the time during the transmission cycle (i.e., 5690 ms) absorbing,
on average, 4.05 mA of current. There is a spike in the current values with a peak of 126 mA,
with an average current absorption of 124 mA during the data transmission that has a short
duration of 60 ms. The average current absorbed during the data reception phase is 15 mA,
lasting the latter more than four times the duration of the transmission one (i.e., 250 ms).
The device remains in sleep mode for the remaining time, absorbing negligible currents
(i.e., 273 µA).Sensors 2021, 21, 3831 13 of 18
Table 1. Energy profile of weather station for one cycle of active and sleep modes.
State Duration (ms) Current (mA) Power (mW) Energy (mJ)
Active 5690 4.05 13.365 76.05
Transmitting data 60 124 409.2 24.55
Receiving data 250 15 49.5 12.375
Sleep mode consumes 273 µA of current and the power is 900.9 µW
It is possible to estimate the energy requirements of the weather station for a period
of time using the current consumption values measured using the Otii device. Since data
transmission is the most significant power consumption factor, different scenarios are
created to estimate the maximum and minimum power required to operate the weather
station. As we have measured that one transmission is about 6 s, we set the active cycles
as multiples of 6 s. Based on the different data rates, detailed power consumption is
depicted in Table 2. The maximum energy consumed for one day is 4720.8 mJ, which
was recorded when ten data is sent per minute. When the weather station is in complete
sleep mode without transmitting any data for one day, the energy consumed by it is
54.06 mJ. It is important to notice that these are estimated values without considering
the losses during long operation times. The data transmission function of the weather
station plays an important role in understanding the weather station as it consumes
more energy than other functionalities. From Table 2, it is clear that optimizing the data
transmitted will, in turn, optimize the power consumption of the weather station. Therefore,
the proposed asynchronous optimization algorithm has the potential to reduce the number
of transmissions that the weather station has to execute to transfer useful data to a distant
server for storage. However, such an algorithm has to be validated with weather data to
understand the actual impact of the algorithm on the whole application lifetime. This will
be the objective of the next section.
Table 2. Energy consumption profile of the test IoT device for one day.
Data per min Duration (s) Energy Consumption (mJ) Total Energy (mJ)
Active Sleep Active Sleep
0 0 60 0 54.06 54.06
1 6 54 472.1 48.65 520.75
2 12 48 994.2 43.25 1037.45
3 18 42 1416.2 37.84 1454.04
4 24 36 1888.3 32.44 1920.74
5 30 30 2360.4 27 2387.4
6 36 24 2832.5 21.6 2854.1
7 42 18 3304.6 16.22 3320.82
8 48 12 3776.6 10.8 3787.4
9 54 6 4248.7 5.4 4254.1
10 60 0 4720.8 0 4720.8
6. Algorithm Validation and Field Testing
In this section, the performance of the asynchronous optimization algorithm will
be validated first against simulated data (using the weather dataset available from the
National Renewable Energy Laboratory, NREL) and then assessed against data collected
from the deployed weather station in our test site.Sensors 2021, 21, 3831 14 of 18
6.1. Validation of Asynchronous Optimization Algorithm
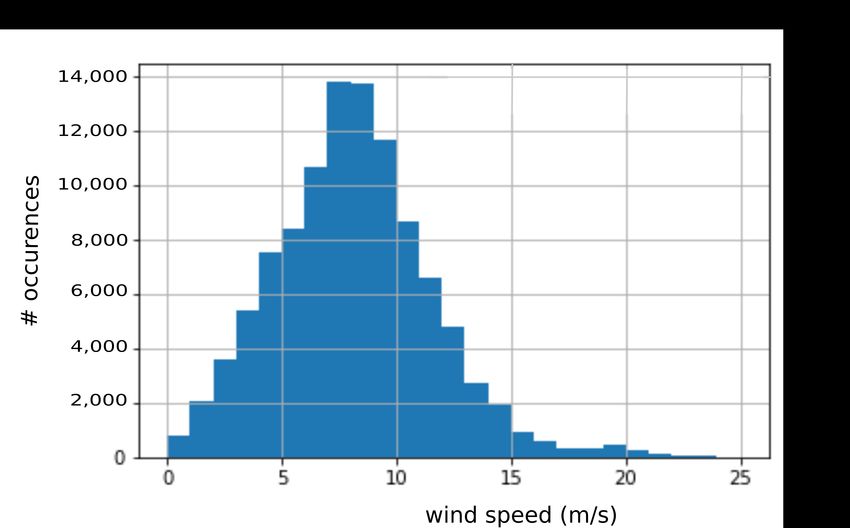
For the validation, three years (from 2016 to 2018) of wind speed and direction data
collected from the NREL Offshore NW Pacific Dataset is employed (https://developer.
nrel.gov/docs/wind/wind-toolkit/offshore-nw-pacific-download/, accessed on 30 May
2021). More in detail, it is a 20-year wind resource dataset for offshore NW Pacific located
in Canada at 48.76° latitude and −130.76° longitude, acquired at a height of 10 m from the
ground, with a sampling period of 5 min (that is 288 samples per day, or 105,120 samples
per year). We assume that this data is collected and processed by our asynchronous
optimization algorithm setting two threshold values, namely th1 = 2 m/s and th2 = 5 m/s.
The data distribution of each year wind data is available in the histograms shown in
Figure 7.
(a) year 2016. (b) year 2017.
(c) year 2018.
Figure 7. Distributions of the wind data.
The threshold wind speed data is a crucial parameter that can be decided based on
the user requirements. Especially in the agriculture fields, the farmers can optimize it
based on the nominal wind speed values for their region. As an example, out of the year
2016’s 105,120 data points, 16,086 data points were less than or equal to th2 (that is, 15% of
the total). For the sake of completeness, Table 3 reports for each year, the number of data
points with a wind speed less than th1 and th2 (R1 and R2 , respectively), together with their
compression rates (CR1 and CR2 , respectively), calculated as the fraction of the number
of reduced transmissions Ri with respect to the original (uncompressed) transmissions N,
expressed in percentage [45] (see Equation (2)).
R
CR = × 100. (2)
N
This metric can be used to evaluate the impact of our asynchronous optimization
algorithm, as it represents the percentage of transmissions reduced which, in turn, will
reduce the energy consumption. On average, the asynchronous optimization algorithm
reduces the transmissions by 5.7% and 17.83% when the threshold wind speed is set to
2 m/s and 5 m/s, respectively. This performance will change based on the geographical
locations, as well as the selection of the threshold wind speed made by the user.Sensors 2021, 21, 3831 15 of 18
Table 3. Impact of asynchronous optimization algorithm on the 3-year NREL dataset.
Year N R1 CR1 R2 CR2
2016 105,120 4438 4.22% 16,086 15.3%
2017 105,120 7341 6.98% 20,781 19.77%
2018 105,120 6450 6.14% 19,371 18.43%
6.2. Field Testing Results
Experiments were conducted to evaluate the performance of the asynchronous opti-
mization algorithm for wind data collection. The anemometer was deployed in an outdoor
environment in Povo, Trento, Italy (46.07° latitude, 11.15° longitude), with the proposed
algorithm and data was collected for nine consecutive days starting, from 22 November
2020, as shown in Figure 6. The anemometer weather station was configured to send data
every 12 s, which is mid-level data rate, as mentioned in Table 2. All the data points were
sent by the weather station to a Raptorbox instance for persistent storage. The data set was
later downloaded from the server to analyze the performance of the anemometer weather
station. The distribution of collected data is shown in Figure 8 as a histogram with a bin
size of 0.5 m/s. From the figure, it is clear that the considered location has weak wind
speed activity without any sudden gust; therefore, two threshold wind speeds were taken
at 0.5 and 1 m/s to analyze the impact of the asynchronous optimization algorithm. It was
computed that the compression rate was 43.42% for a threshold wind speed of 0.5 m/s
and 65.72% for a threshold wind speed of 1 m/s. From this experiment, it is evident that
the proposed algorithm is useful to reduce the number of transmissions which, in turn,
reduces the power requirements of the weather station.
Considering the results from the NREL dataset and those of our real testbed, we
conclude that the proposed asynchronous optimization algorithm is beneficial to the wind
station as it guarantees a reduced number of transmissions with respect to conventional
operations. Moreover, in the latter case, the energy consumption would be the same
for each monitored day, as the wind station has to transmit at a fixed sample frequency.
On the contrary, the proposed algorithm guarantees that only significant data points are
transmitted, giving the user the full freedom to set the threshold above which data points
start becoming significant, thus worth being sent. As an example, during our testing
campaign in Trento, Italy, we could verify that several data points represented wind
speeds less than 1 m/s (see the histogram of Figure 8) meaning that a threshold of 1 m/s
is reasonable to meet a good tradeoff between accuracy of the monitored phenomenon
and power consumption of the monitoring device. Clearly, moving our deployment
to regions characterized by higher wind speeds would require changing the threshold
accordingly, as we have shown with the NREL dataset. A promising research activity we
are currently focusing on considers the adoption of meta-heuristic optimization tools (i.e.,
Multi Objective Evolutionary Algorithms, Taboo Search, Harmony Search, and Simulated
Annealing, as we have already done in different application domains [46,47]) to more
efficiently explore this complex solution space. However, this topic goes beyond the scope
of this paper, so we leave it as future work.Sensors 2021, 21, 3831 16 of 18
Figure 8. Nine days field testing results.
7. Conclusions
In this work, a novel asynchronous optimization algorithm for weather stations
was designed and developed while executing the development lifecycle of the weather
station introduced in our previous work. Following the rapid prototyping principles
and methodologies, a famous open-source embedded development platform, namely
an Arduino Pro mini-board, was used to develop the proposed weather station. It was
deployed in the field to collect real-time wind data. Later, analyzing the collected wind
data lead to the design and development of a novel optimization technique. The weather
station is optimized using the developed algorithm that maximizes the operation time of
the weather station, minimizing the energy requirements by transmitting only the valuable
data. Understanding the weather station’s energy requirements is the starting point to
develop an energy-neutral weather station. It is possible to estimate the energy harvesting
capacity from the weather station’s energy requirements, which will be instrumental in
deciding the energy storage sizing.
In our future works, analysis of the asynchronous optimization algorithm in real-
time, energy harvesting, and storing part of the development lifecycle, which is under
development, will be explored. An experiment to collect the data from two weather stations,
one using the asynchronous optimization algorithm, deployed at the same geographical
location, is planned to be conducted. These data points will be statistically analyzed and
compared with each other to prove that the data transmitted by our algorithm does not lose
significant data points. Additionally, the data will be used as an input in weather prediction
algorithms, and the variation in their prediction results will be analyzed to understand
the impact of our algorithm. Another promising future direction deals with comparing
energy performances of more power-aware embedded micro-controllers, such as the ones
from the Texas Instruments MSP series, STM32 Arm Cortex MCUs, and Espressif ESP32
development kits. The objective, in this case, is to consider the cost of the hardware
and the operations (e.g., type of batteries, size of solar panels, etc.) within the technical
specifications phase.Sensors 2021, 21, 3831 17 of 18
Author Contributions: Conceptualization, methodology, F.A. and P.B.L.; software, P.B.L.; validation,
A.M., F.A., M.V., and P.B.L.; formal analysis, P.B.L., M.V., and A.M.; investigation, P.B.L.; writing—
original draft preparation, P.B.L. and M.V.; writing—review and editing, P.B.L., M.V., and D.B.;
visualization, P.B.L.; supervision, M.V. and F.A.; funding acquisition, F.A. All authors have read and
agreed to the published version of the manuscript.
Funding: This research received no external funding.
Institutional Review Board Statement: Not applicable.
Informed Consent Statement: Not applicable.
Data Availability Statement: Not applicable.
Conflicts of Interest: The authors declare no conflict of interest.
References
1. The Sustainable Development Goals Report 2020; Technical Report; United Nations: New York, NY, USA, 2020.
2. El Chami, D.; Daccache, A.; El Moujabber, M. How Can Sustainable Agriculture Increase Climate Resilience? A Systematic
Review. Sustainability 2020, 12, 3119. [CrossRef]
3. NASA Global Climate Change Homepage. Available online: https://climate.nasa.gov/ (accessed on 27 May 2021).
4. Shukla, P.; Skea, J.; Buendia, E.C.; Masson-Delmotte, V.; Pörtner, H.O.; Roberts, D.C.; Zhai, P.; Slade, R.; Connors, S.; van Diemen,
R.; et al. Climate Change and Land: An IPCC Special Report on Climate Change, Desertification, Land Degradation, Sustainable Land
Management, Food Security, and Greenhouse Gas Fluxes in Terrestrial Ecosystems; Intergovernmental Panel on Climate Change.
Unpublished work.
5. Climate Change Adaptation in the Agriculture Sector in Europe; Technical Report 4/2019; European Environment Agency: Luxem-
burg, 2019.
6. García, L.; Parra, L.; Jimenez, J.M.; Lloret, J.; Lorenz, P. IoT-Based Smart Irrigation Systems: An Overview on the Recent Trends
on Sensors and IoT Systems for Irrigation in Precision Agriculture. Sensors 2020, 20, 1042. [CrossRef]
7. Jawad, H.M.; Nordin, R.; Gharghan, S.K.; Jawad, A.M.; Ismail, M. Energy-Efficient Wireless Sensor Networks for Precision
Agriculture: A Review. Sensors 2017, 17, 1781. [CrossRef]
8. Wizelius, T. 2.13—Design and Implementation of a Wind Power Project. In Comprehensive Renewable Energy; Sayigh, A., Ed.;
Elsevier: Amsterdam, The Netherlands, 2012; pp. 391–430.
9. Fu, T.; Li, X. A Combination Forecasting Strategy for Precipitation, Temperature and Wind Speed in the Southeastern Margin of
the Tengger Desert. Sustainability 2020, 12, 1489. [CrossRef]
10. Jia, L.; Zheng, C.; Hu, G.; Menenti, M. 4.03—Evapotranspiration. In Comprehensive Remote Sensing; Liang, S., Ed.; Elsevier:
Amsterdam, The Netherlands, 2018; pp. 25–50.
11. Cascone, S.; Coma, J.; Gagliano, A.; Pérez, G. The evapotranspiration process in green roofs: A review. Build. Environ. 2019,
147, 337–355. [CrossRef]
12. Guillén-Navarro, M.A.; Martínez-España, R.; Bueno-Crespo, A.; Morales-García, J.; Ayuso, B.; Cecilia, J.M. A Decision Support
System for Water Optimization in Anti-Frost Techniques by Sprinklers. Sensors 2020, 20, 7129. [CrossRef] [PubMed]
13. Zhang, L.; Meng, K.; Jia, Y.; Ma, J.; Hai, R. A Multistep Wind Speed Forecasting System Considering Double Time Series Features.
IEEE Access 2020, 8, 161018–161030. [CrossRef]
14. Guo, P.; Chen, S.; Chu, J.; Infield, D. Wind direction fluctuation analysis for wind turbines. Renew. Energy 2020, 162, 1026–1035.
[CrossRef]
15. Gutarra, J.S.; Armando Gastelo-Roque, J.; Sulluchuco, J. A cup anemometer using 3D additive manufacturing. In Proceedings
of the 2020 IEEE XXVII International Conference on Electronics, Electrical Engineering and Computing (INTERCON), Online,
3–5 September 2020; pp. 1–4.
16. Bhandari, S.; Raheja, A.; Chaichi, M.R.; Green, R.L.; Do, D.; Pham, F.H.; Ansari, M.; Wolf, J.G.; Sherman, T.M.; Espinas, A. Lessons
Learned from UAV-Based Remote Sensing for Precision Agriculture. In Proceedings of the 2018 International Conference on
Unmanned Aircraft Systems (ICUAS), Dallas, TX, USA, 12–15 June 2018; pp. 458–467.
17. Stathopoulos, T. Introduction to Wind Engineering, Wind Structure, Wind-Building Interaction. In Wind Effects on Buildings and
Design of Wind-Sensitive Structures; Springer: Vienna, Austria, 2007; pp. 1–30.
18. Khanna, A.; Kaur, S. Evolution of Internet of Things (IoT) and its significant impact in the field of Precision Agriculture. Comput.
Electron. Agric. 2019, 157, 218–231. [CrossRef]
19. Elijah, O.; Rahman, T.A.; Orikumhi, I.; Leow, C.Y.; Hindia, M.N. An overview of Internet of Things (IoT) and data analytics in
agriculture: Benefits and challenges. IEEE Internet Things J. 2018, 5, 3758–3773. [CrossRef]
20. Dupont, C.; Vecchio, M.; Pham, C.; Diop, B.; Dupont, C.; Koffi, S. An open IoT platform to promote eco-sustainable innovation in
Western Africa: Real urban and rural testbeds. Wirel. Commun. Mob. Comput. 2018, 2018, 1028578. [CrossRef]
21. Kapoor, P.; Barbhuiya, F.A. Cloud Based Weather Station using IoT Devices. In Proceedings of the TENCON 2019 IEEE Region 10
Conference (TENCON), IEEE, Kochi, India, 17–20 October 2019; pp. 2357–2362.Sensors 2021, 21, 3831 18 of 18
22. Dombrowski, O.; Hendricks Franssen, H.J.; Brogi, C.; Bogena, H.R. Performance of the ATMOS41 All-in-One Weather Station for
Weather Monitoring. Sensors 2021, 21, 741. [CrossRef] [PubMed]
23. Pincheira, M.; Vecchio, M.; Giaffreda, R.; Kanhere, S.S. Cost-effective IoT devices as trustworthy data sources for a blockchain-
based water management system in precision agriculture. Comput. Electron. Agric. 2021, 180, 105889. [CrossRef]
24. Alippi, C.; Anastasi, G.; Di Francesco, M.; Roveri, M. Energy management in wireless sensor networks with energy-hungry
sensors. IEEE Instrum. Meas. Mag. 2009, 12, 16–23. [CrossRef]
25. Augustin, A.; Yi, J.; Clausen, T.; Townsley, W.M. A study of LoRa: Long range & low power networks for the internet of things.
Sensors 2016, 16, 1466.
26. Abd Rahman, N.H.; Yamada, Y.; Husni, M.H.; Abdul Aziz, N.H. Analysis of Propagation Link for Remote Weather Monitoring
System through LoRa Gateway. In Proceedings of the 2018 2nd International Conference on Telematics and Future Generation
Networks (TAFGEN), Kuching, Malaysia, 24–26 July 2018; pp. 55–60.
27. Singh, D.K.; Jerath, H.; Raja, P. Low Cost IoT Enabled Weather Station. In Proceedings of the 2020 International Conference on
Computation, Automation and Knowledge Management (ICCAKM), Dubai, United Arab Emirates, 9–10 January 2020; pp. 31–37.
28. Tenzin, S.; Siyang, S.; Pobkrut, T.; Kerdcharoen, T. Low cost weather station for climate-smart agriculture. In Proceedings of
the 2017 9th International Conference on Knowledge and Smart Technology (KST), Chonburi, Thailand, 1–4 February 2017;
pp. 172–177.
29. Malewski, M.; Cowell, D.M.J.; Freear, S. Review of battery powered embedded systems design for mission-critical low-power
applications. Int. J. Electron. 2018, 105, 893–909. [CrossRef]
30. Anagnostou, P.; Gomez, A.; Hager, P.A.; Fatemi, H.; Pineda de Gyvez, J.; Thiele, L.; Benini, L. Energy and power awareness in
hardware schedulers for energy harvesting IoT SoCs. Integr. Vlsi J. 2019, 67, 33–43. [CrossRef]
31. Vecchio, M.; Giaffreda, R.; Marcelloni, F. Adaptive Lossless Entropy Compressors for Tiny IoT Devices. Wirel. Commun. IEEE
Trans. 2014, 13, 1088–1100. [CrossRef]
32. Turos, L.; Csernáth, G.; Csenteri, B. Power Management In IoT Weather Station. In Proceedings of the 2018 International
Conference and Exposition on Electrical And Power Engineering (EPE), Iasi, Romania, 18–19 October 2018; pp. 133–138.
33. Warnakulasooriya, K.; Jayasuriya, Y.P.; Sudantha, B.H. Generic IoT Framework for Environmental Sensing Researches: Portable
IoT Enabled Weather Station. In Proceedings of the 2018 International Conference on System Science and Engineering (ICSSE),
Taipei, Taiwan, 28–30 June 2018; pp. 1–5.
34. Kaewwongsri, K.; Silanon, K. Design and Implement of a Weather Monitoring Station using CoAP on NB-IoT Network. In
Proceedings of the 2020 17th International Conference on Electrical Engineering/Electronics, Computer, Telecommunications and
Information Technology (ECTI-CON), Phuket, Thailand, 24–27 June 2020; pp. 230–233.
35. Sahni, Y.; Cao, J.; Shen, J. Internet of Everything—Algorithms, Methodologies, Technologies and Perspectives; Springer: Singapore, 2018.
36. Leelavinodhan, P.B.; Antonelli, F.; Vecchio, M.; Maestrini, A. Energy-neutral weather stations for precision agriculture: chal-
lenges and approaches. In Proceedings of the 2020 IEEE International Workshop on Metrology for Agriculture and Forestry
(MetroAgriFor), Trento, Italy, 4–6 November 2020; pp. 24–28.
37. Davis Anemometer 6410 Datasheet. Available online: https://www.davisinstruments.com/product_documents/weather/spec_
sheets/6410_SS.pdf (accessed on 27 May 2021).
38. Arduino Pro Mini official page. Available online: https://store.arduino.cc/arduino-pro-mini (accessed on 27 May 2021).
39. ATmega328P Datasheet. Available online: http://ww1.microchip.com/downloads/en/DeviceDoc/Atmel-7810-Automotive-
Microcontrollers-ATmega328P_Datasheet.pdf (accessed on 27 May 2021).
40. Microchip Homepage. Available online: https://www.microchip.com/ (accessed on 27 May 2021).
41. Otii Energy Consumption Analysis Tool Homepage. Available online: https://www.qoitech.com/help/otii (accessed on
27 May 2021).
42. Zeng, X.; Liao, Y.; Wu, Q. Study on the Design Strategy of Outdoor Fitness Equipment for Elderly Users. In Proceedings of the
2020 International Conference on Artificial Intelligence and Electromechanical Automation (AIEA), Tianjin, China, 26–28 June
2020; pp. 469–473.
43. Kanoun, O.; Bradai, S.; Khriji, S.; Bouattour, G.; El Houssaini, D.; Ben Ammar, M.; Naifar, S.; Bouhamed, A.; Derbel, F.; Viehweger,
C. Energy-Aware System Design for Autonomous Wireless Sensor Nodes: A Comprehensive Review. Sensors 2021, 21, 548.
[CrossRef]
44. Etelapera, M.; Vecchio, M.; Giaffreda, R. Improving energy efficiency in IoT with re-configurable virtual objects. In Proceedings
of the 2014 IEEE World Forum on Internet of Things (WF-IoT), Seoul, Korea, 6–8 March 2014; pp. 520–525.
45. Vecchio, M.; Sasidharan, S.; Marcelloni, F.; Giaffreda, R. Reconfiguration of environmental data compression parameters through
cognitive IoT technologies. In Proceedings of the 2013 IEEE 9th International Conference on Wireless and Mobile Computing,
Networking and Communications (WiMob), Lyon, France, 7–9 October 2013; pp. 141–146.
46. Lazzerini, B.; Marcelloni, F.; Vecchio, M. A multi-objective evolutionary approach to image quality/compression trade-off in
JPEG baseline algorithm. Appl. Soft Comput. 2010, 10, 548–561. [CrossRef]
47. Manjarres, D.; Del Ser, J.; Gil-Lopez, S.; Vecchio, M.; Landa-Torres, I.; Salcedo-Sanz, S.; Lopez-Valcarce, R. On the design of a
novel two-objective harmony search approach for distance-and connectivity-based localization in wireless sensor networks. Eng.
Appl. Artif. Intell. 2013, 26, 669–676. [CrossRef]You can also read