Using Mobile Augmented Reality to Facilitate Public Engagement
←
→
Page content transcription
If your browser does not render page correctly, please read the page content below
Using Mobile Augmented Reality to Facilitate Public
                         Engagement

                                    Aris Alissandrakis
                   Department of Media Technology, Linnaeus University
                                aris.alissandrakis@lnu.se

                                       Nico Reski
                   Department of Media Technology, Linnaeus University
                                   nico.reski@lnu.se

Keywords: Augmented Reality, public engagement, crowdsourcing

Abstract
This paper presents our initial efforts towards the development of a framework for facilitating public
engagement through the use of mobile Augmented Reality (mAR), that fall under the overall project
title "Augmented Reality for Public Engagement" (PEAR). We present the concept,
implementation, and discuss the results from the deployment of a mobile phone app (PEAR 4
VXO). The mobile app was used for a user study in conjunction with a campaign carried out by
Växjö municipality (Sweden) while exploring how to get citizens more engaged in urban planning
actions and decisions. These particular activities took place during spring 2016.

One of the salient features of our approach is that it combines novel ways of using mAR together
with social media, online databases, and sensors, to support public engagement. In addition, the
data collection process and audience engagement were tested in a follow-up limited deployment.
The analysis and outcomes of our initial results validate the overall concept and indicate the
potential usefulness of the app as a tool, but also highlight the need for an active campaign from
the part of the stakeholders.

Our future efforts will focus on addressing some of the problems and challenges that we have
identified during the different phases of this user study.

Introduction
This paper presents our initial efforts towards a framework for facilitating public engagement
through mobile Augmented Reality, that fall under the overall project title “Augmented Reality for
Public Engagement” (PEAR). We present the concept, implementation, and discuss the results from the deployment of a mobile phone app (PEAR 4 VXO). The app was used for a user study in conjunction with a campaign by Växjö municipality. In addition, the data collection process and audience engagement were tested in a follow-up limited deployment. The concept of Augmented Reality (AR) has been around for many years (Milgram et al. 1995; Sutherland 1968). Recently, advances in AR are particularly taking advantage of the availability of smartphone and tablet devices (Jonietz 2007). Mainstream adoption of AR technologies is predicted within the next 5-10 years according to the Gartner Hype Cycle for Emerging Technologies Report 2016 (http://www.gartner.com/newsroom/id/3412017). The success of the mobile game “Pokemon GO” has considerably contributed to the public's interest in mobile AR, even if briefly. Although both Augmented and Virtual Reality technologies are slowly becoming more accepted, their adoption for interdisciplinary purposes, especially in relation to the Humanities, has usually focused on the visual aspect of these technologies. For example, recreating a historical location, or digitizing and displaying artefacts as in the two projects Visualizing Venice (http://www.visualizingvenice.org) and Augmented Palimpsest (https:// augmentedpalimpsest.wordpress.com). The possibilities arising from interacting with the virtual content are not really considered, whether this is real world simulacrum or data abstractions. We position our work in relation to the field of Digital Humanities in providing an initial framework that allows people to engage and interact in-situ with virtual content that may be the visualization of people's consensus responses, but also an aggregation of multiple sources of data. Some of these sources could include social media, e.g. Twitter. Related Technologies Augmented Reality Augmented Reality describes the technological approach of extending and enhancing the real world environment by adding supplemental “virtual” (computer-generated) information interactively, in three dimensions, and in real-time (Carmigniani et al. 2011; Krevelen and Poelman 2010; Schmalstieg et al. 2011). Virtual objects are aligned perfectly with real ones and thus seem to co-exist in the same space (Krevelen and Poelman 2010). Ideally, AR aims to simplify and facilitate the user's interactions with real-world situations (Carmigniani et al. 2011). Although an implementation of AR using different display technologies (video-see through, optical see-through, projective; enhancing vision) is the most common approach, AR can also enhance other senses such as hearing, touch and smell (Krevelen and Poelman 2010). An essential part of an AR
application is the ability to track the real world environment in order to project and align the virtual
objects with it, using a combination of some sort of camera and an AR marker (Krevelen and
Poelman 2010). The AR marker, an image acting as a visual reference, must be placed within the
physical space in order to enable the camera to track its position and place the virtual object.

Mobile AR
Today's portable computing devices such as smartphones or tablets include several sensor
technologies, such as GPS for geo-location, an accelerometer, gyroscope or magnetometer,
which can further help to implement accurate tracking (Carmigniani et al. 2011; Papagiannakis et
al. 2008).

Although mobile AR can work fairly well, there are still issues and challenges in mobile AR related
to navigation, tracking, content management and usability (Kurkovsky et al. 2012; Wu et al. 2013).
Common uses of mobile AR include virtual character-based applications, cultural heritage,
edutainment and games, navigation and path-finding, collaborative assembly and design, and
industrial maintenance/inspection (Papagiannakis et al. 2008). An approach to visualize sensor
data in real-time using AR is presented by Rauhala et al. (2006), using a ZigBee sensor network
and ARToolKit. The SiteLens project illustrates an approach for a situated AR visualization
designed for urban site visits (White and Feiner 2009). Goldsmith et al. (2008) report on their
findings towards the design and implementation of AR environmental monitoring using a wireless
sensor network.

Twitter
Twitter is an online social network service that allows users to interact using short messages
(maximum 140 characters, although this character limit is now relaxed) called tweets. Words that
start with the character “@” indicate usernames, while words that start with the character “#” are
called hashtags and indicate topics. Tweets are quick to compose and publicly visible by default,
therefore making Twitter a convenient platform for discussion and monitoring trending topics. In
Sweden, 22% of internet users use Twitter (“Svenskarna och internet”, 2015).
Concept and Interaction Design

             Figure 1: The PEAR framework. Dashed arrows indicate future extensions.

The purpose of the PEAR framework is to visualize data from (and for) the public discussion about
a certain issue in an interactive and engaging way, thus creating additional value. It allows the
public both to be informed (by viewing the visualization using an AR mobile app), and to participate
in the discussion by using social networks, or by interacting with the AR visualization. Currently,
only participation via social networks (Twitter) is implemented in the prototype. Direct interaction
with the AR visualization within the mobile app is a feature under development.

The AR visualization is meant to be continuously updated, based on the public interaction and
available data. For example, as users debate about a topic on social media networks such as
Twitter or Facebook, public data can be collected (using certain keywords or hashtags), analyzed
and ranked (according to the frequency of different hashtags) so that a visualization
(representative of the current discussion) can be generated. The data visualization can also be
designed to highlight any recent changes (between previous and current updates), providing
further insights. Note that the data sources need not only be social media. Other online databases
with open data of public interest could also be part of the visualization, as well as more local data
sources such as pollution or environmental sensors. The extended framework concept is
illustrated in Figure 1.
The key component of the concept of PEAR is the strategic and meaningful placement of the AR marker (needed to view the visualization via the app), ideally leading the users to a real-world location that is connected to the topic of discussion, e.g. a place of interest, a historical site, a cafe in town, etc. Encouraging the user to physically move to the real-world location in order to observe (via the AR visualization) the latest updates to the discussion is intended to facilitate the user’s engagement in the discussion, as new thoughts, ideas or opinions may be formed as a result of visiting the site. It might be argued that users could also (or alternatively) obtain such information at online at home; however, they would be at a distance (both geographical and psychological) from the topic of discussion. Providing access to live information, in-situ, may encourage involvement, and allow the public to reflect on the topic from a closer perspective. Implementation of the Prototype The prototype implementation of the framework consists of two parts: a data collection (server- side) part and an interactive AR visualization (client-side) part (see Figure 2). A server and database combination based on Node.js and MongoDB periodically (e.g. hourly) request and store data from Twitter, receiving tweets containing a predefined username (related to the campaign, preferably the username of the stakeholder organization) and at least one of several predefined hashtags (to indicate the options). While all relevant data are being collected, only the latest tweet of each unique Twitter user is considered, thus permitting (a) a change of opinion, and (b) the tracking of opinions over time. The AR visualization (built with Unity and the Vuforia AR SDK) runs as an app on an Android or iOS device, requests the collected data from the server and creates the interactive 3D representation of the data.
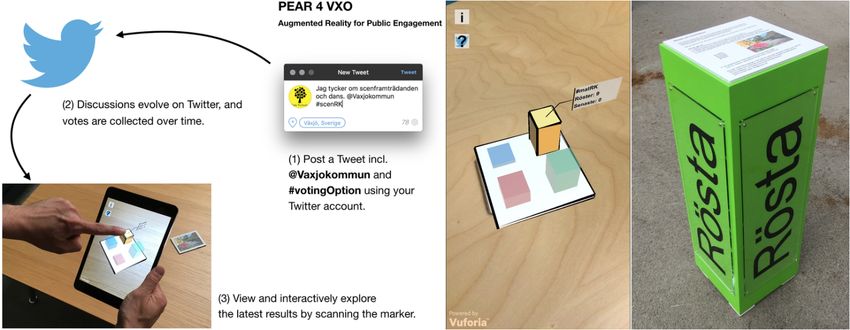
Figure 2: Overview of the PEAR architecture.

PEAR 4 VXO: A Case Study
In collaboration with the local municipality, an implementation of the PEAR framework was
deployed, related to an ongoing public debate regarding the future development of the
Ringsberg/Kristinebergs area in the city of Växjö, Sweden. The public was invited to vote about
this issue by composing tweets that included “@vaxjokommun” (the municipality’s Twitter
username) and specific hashtags such as e.g. “#parkRK” or “#matRK” (indicating a preference to
develop either a park or a restaurant/cafe at the site).

Figure 3 (right) shows the deployment of the on-site stand. The top side of the stand, in addition
to the AR marker, includes information about the campaign: it invites the public to visit, download
the AR app and scan the AR marker to view the latest results, as well as to obtain an overall
impression of the topic of discussion while they are there.
Figure 3: Overall workflow of the deployed PEAR 4 VXO campaign (left), a screenshot from the app
             (middle) and a photo of the on-site stand with information and AR marker (right).

             Figure 4: PEAR 4 VXO app use over time: individual (top), daily sums (bottom).

The PEAR 4 VXO campaign ran from the end of May to the end of August 2016. There was a
launch event during the Vårstad town festival on 28 May. The overall campaign was advertised in
the April and May municipality newsletters. On 26 May, two days before the launch, two news
items were released: https://www.mynewsdesk.com/se/vaxjo_kommun/pressreleases/nu-kan-du-
paaverka-utvecklingen-av-ringsberg-kristineberg-via-din-smartphone-1416605             and     https://
monicaskagne.wordpress.com/2016/05/26/chans-att-paverka-hur-vill-du-att-
ringsbergkristineberg-ska-utvecklas. An article about the festival in the local newspaper mentioned
the campaign. On 7 June, an event was held related to the Digital Humanities initiative at Linnaeus
University (LNU), where the PEAR 4 VXO app and overall PEAR concept were presented. On 17 June, there was a press release by LNU (https://lnu.se/en/meet-linnaeus- university/current/news/2016/new-smartphone-app-aims-to-increase-public-engagement-in- local-issues). On 20 June, a post appeared on the municipality’s Instagram account (https://www.instagram.com/p/BG35Tf-oJy8). Although the campaign was advertised in a number of ways, the outreach and engagement with the public (in relation to PEAR 4 VXO) fell short of expectations. Over the campaign period, only 22 votes were collected: five votes originated from Twitter, and 17 were obtained by asking the public's opinion offline (during the launch and other events), which were manually entered into the database. A number of possible reasons for this are discussed below. Although a version of the mobile app was made for iOS devices, it could not be made available online on the App Store in time for the campaign launch. It was possible to install the app if physical access to an iOS device could be gained, but this was not a viable option for the public. As the market share of iOS devices in Sweden is greater than of Android devices, this was a possible limitation. Regarding participation, it is possible that Twitter was not familiar or commonly used by the local public. Given the growing popularity of the social network in Sweden, this should be less of an issue in the future. Additionally, and perhaps more critically, although the municipality’s campaign pointed out the existence of the mobile app, they did not provide any direct links and information on how to download it or shared documents showing how to use Twitter to vote (as seen in Figure 3, left). Apart from the launch, the two peaks in the activity shown in Figure 4 happened around: (a) a Digital Humanities event (where a link to the Google Play Store was provided); and (b) the press release by LNU (which included this information) and the Instagram post by the municipality (that possibly encouraged people to visit the site and interact with the stand/AR marker). Nevertheless, Figure 4 illustrates that there was at least a low level of activity throughout the campaign, with users visiting the on-site marker in the Ringsberg/Kristinaberg area to check the latest voting results. Furthermore, the collected data and server logs point towards an overall successful technical implementation and deployment, as well as successful testing of both the server- and client-side components of the PEAR framework over the course of a three month campaign.
Complementary Deployment
To further test the data collection process and some aspects of engagement, we conducted
another limited deployment at the Digital Humanities symposium that took place in Växjö, Sweden
on 7 and 8 November 2016. The participants of the symposium (and members of the related
network) were asked to choose between four options that best described the research field of
Digital Humanities. Using the same implementation as for the PEAR 4 VXO deployment, the
Twitter account “@DigHum_LNU” was monitored for four new hashtags, starting a few days
before, and up to the end of the symposium. Given the short duration and relatively small audience,
no mobile app was made available; but the visualization (using a desktop version of the app and
a webcam) was shown on a large screen on-site throughout the symposium. An announcement
and instructions about the activity were available online, and a series of tweets and email
reminders were sent by the symposium’s organizers.

 Figure 5: Twitter activity during the Digital Humanities symposium. The shaded area (left) indicates when
the symposium took place; the red area indicates when a demo/presentation about PEAR took place; the
        letters E and T indicate when information emails and tweets were sent by the organizers.

The twitter activity is shown in Figure 5. There were 15 participants, and 19 tweets (some
participants posted multiple times). As mentioned in the implementation section above, the system
acknowledges only the latest tweet from each account; given this feature, two participants
remained consistent but another changed his opinion. One minor bug of the system was noted
resulting from a tweet that included two hashtags: only the latter was acknowledged by the system
as the intended vote.
Conclusion
In this paper, we introduce the PEAR framework, an approach using mobile AR to facilitate public
engagement in online debates and discussions. We present the concept of the framework and the
motivation behind it, as well as details about its implementation. Two initial deployments were
conducted: a user study in conjunction with a local communal campaign; and a more limited test
at a symposium. While the results validate the overall concept and the potential usefulness of the
app as a tool, they also indicate that an active campaign is necessary to make meaningful
conclusions regarding its effectiveness in terms of public impact and engagement.
As these were initial efforts, more studies (e.g. deployments and data collections) need to be
conducted in future in order to address the potential for facilitating public engagement using the
PEAR framework. We also see potential in the extension of the implementation, including data
visualization and collection from multiple sources at the same time, e.g. different types of social
media, online databases, and sensors.
As well as the case study that is presented in this paper, other possible situations where the PEAR
framework could be used, as a tool or complementary element, include:
• to present information about local or current events, societal issues, historical heritage
topics, etc., and facilitate making a record of the public opinion (within long-term
campaigns);
• to be used with focus groups that are considering issues such as the above;
• to assess the visitors’ opinions, understanding or appreciation of museum or library
exhibits;
• in digital storytelling activities;
• any other cases where sharing, interacting and tracking public opinion over time is useful
and meaningful.
REFERENCES
Svenskarna och internet 2015: En årlig studie av svenska folkets internetvanor.
http://www.soi2015.se. Last accessed: 3 February, 2017.
Carmigniani, J., Furht, B., Anisetti, M., Ceravolo, P., Damiani, E., and Ivkovic, M. (2011).
Augmented reality technologies, systems and applications. Multimedia Tools and Applications,
51(1):341-377.
Goldsmith, D., Liarokapis, F., Malone, G., and Kemp, J. (2008). Augmented Reality Environmental
Monitoring Using Wireless Sensor Networks. In 12th International Conference Information
Visualisation, pages 539-544. IEEE, 2008.Jonietz, E. (2007). TR10: Augmented Reality - MIT Technology Review. Web page, March 12. Krevelen, D. W. F. and Poelman, R. (2010). A Survey of Augmented Reality Technologies, Applications and Limitations. The International Journal of Virtual Reality, 9(2):1-20. Kurkovsky, S., Koshy, R., Novak, V., and Szul, P. (2012). Current issues in handheld augmented reality. International Conference on Communications and Information Technology (ICCIT), 2012, pages 68-72. Milgram, P., Takemura, H., Utsumi, A., and Kishino, F. (1995). Augmented reality: A class of displays on the reality-virtuality continuum. Telemanipulator and Telepresence Technologies, 2351:282-292. Papagiannakis, G., Singh, G., and Magnenat-Thalmann, N. (2008). A survey of mobile and wireless technologies for augmented reality systems. Computer Animation and Virtual Worlds, 19(1):3-22. Rauhala, M., Gunnarsson, A.-S., and Henrysson, A. (2006). A novel interface to sensor networks using handheld augmented reality. In Proceedings of the 8th conference on Human-computer interaction with mobile devices and services - MobileHCI '06, page 145, New York, New York, USA. ACM Press. Schmalstieg, D., Langlotz, T., and Billinghurst, M. (2011). Augmented Reality 2.0. Virtual Realities, pages 13-37. Sutherland, I. E. (1968). A head-mounted three dimensional display. In AFIPS '68 (Fall, part I) Proceedings of the December 9-11, 1968, fall joint computer conference, part I, pages 757-764, New York, NY, USA. ACM. White, S. and Feiner, S. (2009). SiteLens. In Proceedings of the 27th international conference on Human factors in computing systems - CHI 09, page 1117, New York, New York, USA. ACM Press. Wu, H.-K., Lee, S. W.-Y., Chang, H.-Y., and Liang, J.-C. (2013). Current status, opportunities and challenges of augmented reality in education. Computers & Education, 62:41-49.
You can also read