UTA Board of Trustees Meeting - September 2, 2020 - Utah Transit Authority
←
→
Page content transcription
If your browser does not render page correctly, please read the page content below

UTA Board of Trustees Meeting
          September 2, 2020
Call to Order and Opening Remarks
      Electronic Meetings Determination Statement
Public Comment
Due to the format of the meeting, no in-person comment will be taken
Public comment was solicited prior to the meeting through alternate means, including
email, telephone, and the UTA website
All comments received were distributed to the board before the meeting and will be
attached as an appendix to the meeting minutes
Safety First Minute

Consent Agenda
a.   Approval of August 21, 2020 Special Board Meeting Minutes
b.   Approval of August 26, 2020 Board Meeting Minutes
c.   Approval of August 26, 2020 Special Board Meeting Minutes
Recommended Action
  (by acclamation)
  Motion to approve consent agenda
Agency Report
a.   Ridership Report
Service Update
During Covid-19 Pandemic
       September 2, 2020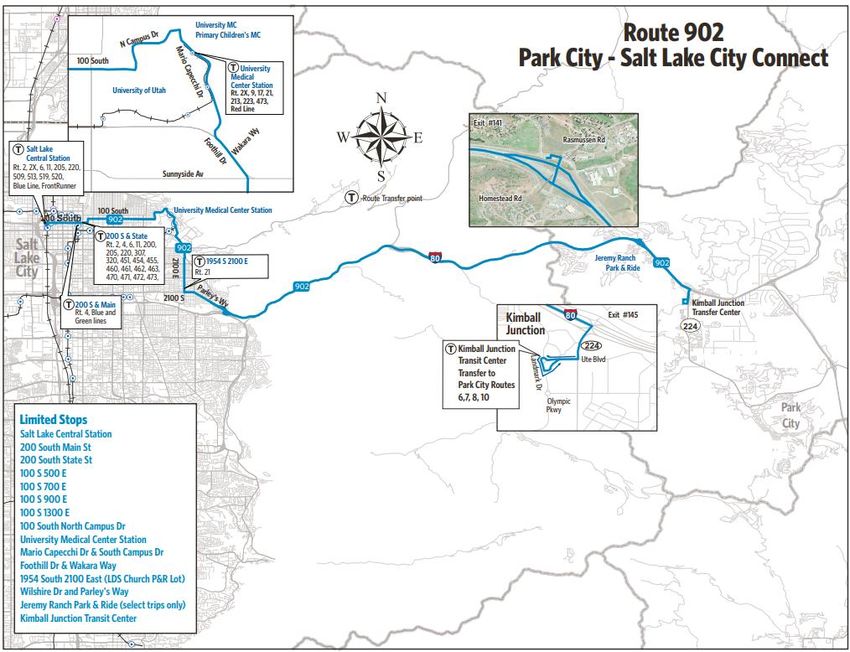
Weekday Ridership Update

                           • Weekday Ridership – 64,267
                           • +27.2% vs. August 5th
Saturday Ridership Update

                            • Saturday Ridership – 42,302
                            • +25.6% vs. August 5th
Weekday Ridership Trend
Mode Pre Covid 19 April 7th Current Current vs. Pre-Covid Current vs. April 7th
Fixed Route Bus 81,439 21,865 36,754 -55% 68%
Commuter Rail 18,869 2,408 4,869 -74% 102%
Light Rail 54,316 13,752 21,895 -60% 59%
Paratransit 1,590 183 573 -64% 213%
Micro Transit 426 91 176 -59% 93%
Total 156,640 38,299 64,267 -59% 68%Questions?
Financial Report – July 2020
UTA Board Dashboard
                                                                July 2020
                                                                 Fav/                                                              Fav/
Financial Metrics               July Actual   July Budget       (Unfav)       %                  YTD Actual        YTD Budget     (Unfav)         %
Sales Tax (June '20 mm $)      $    33.4        $     32.5      $   0.88          2.7%       $         167.6   $          166.9   $      0.69         0.4%
Fare Revenue (mm)              $     2.3        $      4.1      $   (1.89)    -45.6%         $          21.5   $           31.6   $ (10.14)       -32.1%
Operati ng Exp (mm)            $    24.0        $     25.8      $   1.89          7.3%       $         166.5   $          181.9   $     15.44         8.5%
Subs i dy Pe r Ri de r (SPR)   $   15.61        $     5.88      $   (9.73)   -165.5%         $          9.41   $           5.88   $     (3.53)    -60.0%
UTA Di esel Pri ce ($/gal)     $    1.33        $     2.50      $   1.17      46.9%          $          1.44   $           2.50   $      1.06     42.2%
Operating Metrics               July Actual         Jul-19      F/ (UF)       %                  YTD Actual        YTD 2019           F/ (UF)     %
Ri dershi p (mm)                     1.39             3.38           (2.0)    -58.9%                   14.02              21.57           (7.6)   -35.0%
Alternative Fuels              CNG Price   (Diesel Gal Equiv)   $ 1.39

                                                                                         .
2020 Passenger Revenues Thru July 31
$35
Millions
$31.6
$30
$27.5
$25 $22.9
$21.5
$20 $19.2
$18.4
$16.8
$15 $13.8 $14.3
$12.8
$10.1
$10 $9.0 $9.2
$8.3
$6.1
$4.6 $4.6 $4.1
$5
$1.0
$0
January February March April May June July
Budget Actual Revenue LossSales Tax Collections
(Percentage Growth 2020 over 2019 for 12 months ended June 30)
30%
27.0%
25%
20%
15%
12.1%
9.7%
10% 8.8% 8.4%
6.4%
5% 2.8%
0%
Salt Lake (60.5%) Utah (18.7%) Davis (10.5%) Weber (8.8%) Tooele (0.9%) Box Elder (.7%) Overall2020 Sales Tax Revenues Thru June
$180
$166.9 $167.6
Millions
$160
$134.4 $134.2
$140
$120
$105.6 $106.1
$100
$80.7 $80.8
$80
$60 $50.2 $49.5
$40
$24.6 $27.6
$20
$0
January February March April May June
Budget ActualYTD Revenue Loss and CARES Funding Estimates
Millions $60
$49.9
$40.6
$40
$28.3
$20
$10.1
$8.3
$6.1
$4.1
$1.0
$0
March April May June July
Passenger Revenue Estimated CARES Eligible Expense
Note: Passenger Revenue loss thru July2020 Expense Thru July 31 – Variance by Mode
$4.66
$1.19
$1.44
$0.13
$1.19
$2.63
$3.41
Millions $0.0 $1.0 $2.0 $3.0 $4.0 $5.0
Bus Commuter Rail Light Rail Maint. Of Way Paratransit Operations Support Administration2020 Expense Thru July 31 - Variance by Chief Officer
Millions $0.0 $3.0 $6.0 $9.0
$0.27
$1.30
$0.30
$9.43
$0.87
$0.08
$2.90
Board of Trustees Communication & Marketing Finance Operating People Service Development Executive Director2020 Expense Thru July 31 - Variance by Type
$1.89
$4.32
$5.78
$0.98
$0.36
$2.83
Millions 0.00 2.00 4.00 6.00
All Other Utilities Parts/Warranty Fuel Services Wages & BenefitsResolutions
R2020-09-01

Resolution Amending the Terms and Conditions of
Employment for Executive Director Carolyn Gonot
Recommended Action
                     (by roll call)
                         Motion to approve R2020-09-01

Resolution Amending the Terms and Conditions of Employment for Executive Director
                                Carolyn Gonot
R2020-09-02
Resolution Approving the Execution of an Interlocal
Cooperation Agreement with Park City to Cooperate on
the Procurement, Purchase, Operation, and Maintenance
of Electric Buses and Charging Infrastructure Using Funds
Awarded through the Federal Transit Administration 2018
Low No Grant ProgramProject Overview
▪ Federal Transit Administration (FTA) Fiscal Year 2018 Low No Grant awarded to Park City
▪ UDOT manages the grant process for all statewide federal funds available through FTA
▪ Park City intends to use the Low No funds to purchase two electric buses and associated
charging infrastructure to be used on the PC-SLC Connect Route, operated by UTA
▪ UDOT would like Park City to have an interlocal agreement with UTA to document transfer
of the award and use of associated vehicles and infrastructure
▪ UTA is preparing a solicitation for the purchase of 20 electric buses. Park City would like to
add the 2 buses for the Low No grant award, as well as another 12 electric buses Park City
is procuring, to the UTA procurement to reduce duplication of effort.Funding ▪ FTA Low No Grant award of $2,290,000 to be used for the Park City – Salt Lake Connect Route ▪ Rocky Mountain Power has committed $500,000 to the project toward the cost of the infrastructure improvements ▪ UTA will fund the local match for the bus purchase, estimated at $443,000. These funds will come from the vehicle replacement fund set up in the UTA/Park City agreement for the PC Connect service. ▪ All funding for the Park City additional vehicles will be provided by Park City.
Interlocal Cooperation Agreement
▪ Activities associated with the Low No grant, including procurement of two
  electric buses, one overhead charger, depot charging equipment, and retrofit of
  one overhead charger
▪ Collaboration on the procurement of twelve additional Park City buses
▪ Use and maintenance commitments for the grant-funded charging infrastructure
  and buses associated with the PC Connect service
Recommended Action
                     (by roll call)
                         Motion to approve R2020-09-02
Resolution Approving the Execution of an Interlocal Cooperation Agreement with Park
   City to Cooperate on the Procurement, Purchase, Operation, and Maintenance of
 Electric Buses and Charging Infrastructure Using Funds Awarded through the Federal
                  Transit Administration 2018 Low No Grant Program
Contracts, Disbursement, and Grants
Contract: Rail Ticket Vending Machine (TVM) System
  Maintenance and Support (Scheidt and Bachmann)

____________________________________________

                     Recommended Action
                       (by acclamation)
       Motion to approve contract as presented in meeting materials
Contract: Board Management Software
(Carahsoft Technology Corporation/Granicus)
____________________________________________
Recommended Action
(by acclamation)
Motion to approve contract as presented in meeting materialsChange Order: Positive Train Control (PTC) Mandatory
Directive Speed Upgrades, Ogden Cab Signal Speed
Upgrades, and PTC On-Call Support
(Rocky Mountain Systems Services)
____________________________________________
Recommended Action
(by acclamation)
Motion to approve change order as presented in meeting materialsPre-Procurements i. Outsource Ticket Vending Machine Maintenance ii. Purchasing Card (P-Card) Service iii. Public Relations and Marketing Agency
Discussion Items
Risk Management/Insurance Program Update
Risk Management
Insurance Coverage Update
       September 2, 2020
Board Policy 2.1 – Risk Management ▪ The Executive Director will submit an annual report to the Board of Trustees on the status of the Authority’s risk management program. ▪ The Authority will maintain Public Officials Errors and Omissions Insurance in an amount determined to adequately protect the Authority. ▪ The Executive Director will, as necessary, procure other insurance to compensate for losses that would adversely affect the Authority.
Board Policy 2.1 – Risk Management
The Executive Director will submit an annual report to the Board of Trustees on the status of the
Authority’s risk management program.

Crowe ERM Risk Assessment and Framework – all phases completed
1. Planning and Documentation
2. Onsite Interviews
3. Risk Assessment
4. ERM Practices Evaluation
5. Final Report and Framework

                              The Final Report was presented to the Board
                              in May, 2020.
Board Policy 2.1 – Risk Management
The Authority will maintain Public Officials Errors and Omissions Insurance in an amount
determined to adequately protect the Authority.
Current Public Officials Insurance Company: Stratford Insurance Company
Coverage: AM Best Rating: A (Excellent), XV ($2B or greater)
Last year we lowered the limit Admitted/Non-Admitted: Admitted
on this coverage to $2M from
$5M because of the excess Policy Term: 9/1/19 to 9/1/20
umbrella coverage of $10M Coverage: Primary
which sits on top of this policy
Policy Aggregate Limit: $2,000,000
resulting in a combined limit
of $12M. Public Entity D&O: $2,000,000
Employment Practices: $2,000,000
Retention - D&O: $100,000
Retention - EPL $125,000
Premium: $65,169Board Policy 2.1 – Risk Management
Renewal Coverage for
Public Officials: Insurance Company: Stratford Insurance Company
AM Best Rating: A (Excellent), XV ($2B or greater)
We maintained the excess
umbrella coverage of Admitted/Non-Admitted: Admitted
$10M on top of this policy Policy Term: 9/1/19 to 9/1/20
for a combined limit of
$12M. Coverage: Primary
Policy Aggregate Limit: $2,000,000
Public Entity D&O: $2,000,000
Employment Practices: $2,000,000
Retention - D&O: $100,000
Retention - EPL $125,000
Premium: $73,092Board Policy 2.1 – Risk Management The Executive Director will, as necessary, procure other insurance to compensate for losses that would adversely affect the Authority.
$319,308
                        Up 1%

$37,477    $52,202               $73,092
Down .1%    Up 6.7%               Up 12%
$1,076,731
Up 24.5%
Increase was driven by:
- Hardening of the casualty market
- Loss of insurance carriers in the US market
Last year UTA moved Zurich from our primary
layer to one of our excess layers. Zurich was
one of the carriers who dropped out of the
market. The foresight by our broker to make
this move saved UTA from having to find a
primary carrier in this hardening market.$88,933
Up 5%
-The increase is the result of
increase in payroll.$405,025
Up 15.7%
Property:
- The increase from the Utah Local
Governments Trust’s re-insurer. The
fund passed the increase along to its
members.
- This is the first time in 20 years the fund $27,690
has seen a rate increase on property. Up 7.3%
- We still have better limits with the Trust
including quake and flood coverage.Vanpool coverage was a challenge
with the hardening casualty
markets.
$1,170,558
- The incumbent insurers both Up 15% $15,644
primary and excess refused to No Change
renew.
- We had a hard time finding an
insurer who was willing to match
the guaranteed cost program we
had.
- We had quotes from several loss
sensitive options, but were
finally able to get a quote on a
guaranteed cost option.$16,680
Up 2%
$62,325
This is a new policy and
replaces the requirement
for a public officials bond.
This policy renews
annually on July 1stEmployee
Retirement Income
Security Act
$350
There are currently 9
commissioned notaries at UTA.
$50/bondPremiums – 2019 and 2020
Coverage 2019-2020 Premium 2020-2021 Premium % Change
Property $350,552.32 $405,205.00 +15.7% (net increase)
Railroad Liability $864,162.00 $1,076,731.00 +24.5%
Vanpool Liability $847,602.00 $1,170,558.00
Vanpool XS Liability $167,203 Included
Vanpool Subtotal $1,014,805 $1,170,558 +15%
Railroad Protective $15,664.50 $15,664.50 0%
Blanket Excess $317,467.20 $319,308.30 +1%
Premises General Liability $31,080.46 $31,047.04 +0.40%
Premises Excess Liability $6,430.80 $6,430.80 0%
Excess Workers’
$84,668.00 $88,933.00 +5%
Compensation
Police Professional Liability $48,915.01 $52,202.47 +6.7%
Cyber Liability $25,790.96 $27,690.66 +.7%
Public Officials/Employment
$65,169.00 $73,092.00 +12%
Practices Liability
Fiduciary $16,336.15 $16,680.40 +2%
Terrorism – Liability $12,401.07 $12,401.07 0%
Crime – 2/10/20-7/1/21 $62,325 N/A 0%
TOTAL $2,915,767.48 $3,295,941.00 +13.04%2021-2025 Mobility Service Plan Overview
Five-Year Mobility Plan
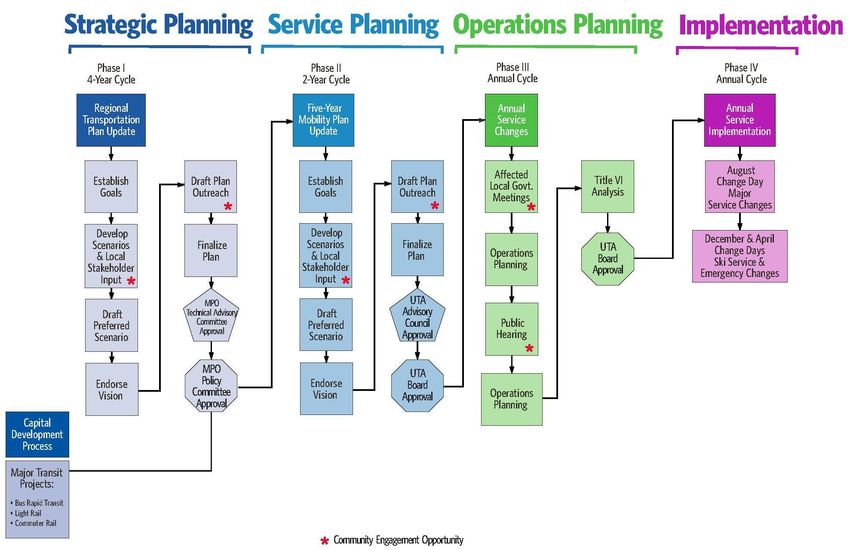
2020-2024Service Planning Toolbox
1. Service Planning Policy
2. Service Planning Overview
3. Service Design Guidelines
4. Bus Stop Master Plan
5. Five-Year Mobility Plan
6. Comprehensive System
AnalysisService Planning Policy
Phase 1 – Regional Transportation Plan
Phase 2 – Five-Year Mobility Plan
Phase 2 – Five-Year Mobility Plan

              UTA Service Choices
            Engagement and Planning
Phase 2 – Five-Year Mobility Plan
Other
Planning UTA Pilot
Business Programs
Efforts
Unit Ideas
Rider
Service Surveys
Choices
Data
Analysis
5-Yr PlanPhase 2 – Five-Year Mobility Plan
1. Adapt to meet needs of a changing transit
market
2. Create a network of high frequency transit to
drive ridership and make transit more useful
3. Explore new roles for on-demand services like
FLEX and microtransit
4. Bring service back within budget targets
5. Be flexible in timeline
6. Expect things to changePhase 3 – Annual Service Change Process
Phase 4 – Service Implementation
Five-Year Mobility Plan
 1. This Five-Year Mobility Plan will represent anticipated service
    changes, based on the best information that we have
    available today.

 2. Ongoing analysis and a changing economic and health
    landscape will almost certainly result in modifications to the
    plan and its implementation.

 3. Each change identified in the plan will go through the Change
    Day process and will include multiple opportunities for public
    and local government input, further analysis, and Board
    approval.
FrontRunner Strategy and Work Program
Growing FrontRunner
     Capacity
  Strategy and Work Program
        2 September 2020
Background • Vital transportation backbone for the Wasatch Front and alternative to the Interstate 15 freeway • Additional investment contemplated in plans by the MPOs and previously studied • Supports economic development and access to opportunity • UTA’s service area is forecast to double in population by 2065
Service Objectives for FrontRunner

 Faster trains
                  Adding trains
                  during peak                Frequent
                    periods                   service

Allow skip-stop                   Increase
   operations                     capacity
Regional Objectives for FrontRunner Service
Provide additional options to connect jobs and employees
Increase ridership of Frontrunner and overall transit system
Support real estate and economic development
Reduce congestion on the I-15 corridor
Improve air quality
Enhance safety at grade crossingsVision • Conceptual framework that guides the approach to preparing a strategy and work program for growing FrontRunner capacity • High-level synopsis of the overall program, based on the business plan • Useful for communicating what UTA and project partners are seeking to accomplish to grow the capacity and reliability of FrontRunner
Business Plan
Background Technical
• Continuously prepared and regularly updated,
• Outlines financial scenarios based on service
beginning with initiation of the work program
type and delivery timing
• Describes service to be provided and implemented
in phases • Forecasts ridership; capital costs; operations and
• References the policy, regulatory and technical work maintenance costs; and expected revenues by
involved sources
• Discusses how the engagement process informed • Transparently discloses and assesses potential
the business plan risks and uncertainties
• Informs the business case and investment
decisions
• Calculates potential economic and fiscal
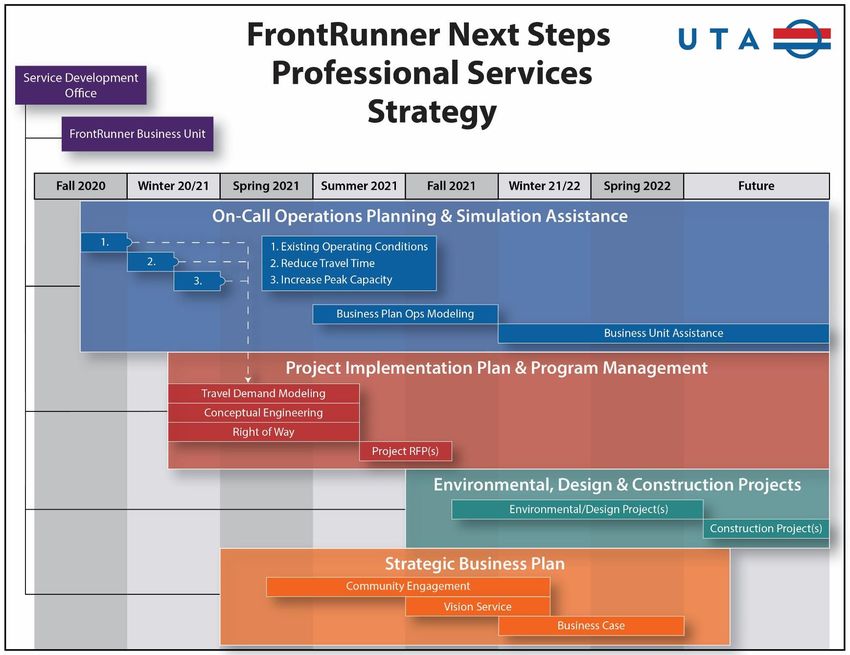
impacts/benefitsStep 1: On-call Planning and Simulation Assistance
Explore Operational Scenarios
• Create a model of FrontRunner operations
• Simulate different operating services
• Simulate different rail technologiesStep 2: Project Implementation Plan and Program Management
Prepare and Study Infrastructure Concepts
• Based on identification of scenarios that meet the objective
• Undertake conceptual planning and engineering to identify components needed to implement
potential operating scenarios
• Prepare conceptual cost estimate ranges
• Screen the most promising infrastructure concepts that support
potential operating scenarios based on the vision and business plan
• Provide ongoing project management for FrontRunner programStep 3: Environmental, Design and Construction Projects
Conduct Regulatory Clearances and Determine Delivery Phasing
Environmental Review
• UTA prepares an Environmental Impact Statement, with FTA as lead
agency
Engineering Design
• Survey and design the project at a level needed to inform the business
plan, environmental review and construction of early action projects
• Conduct strategic implementation planning
• Identify project design packages constituting distinct phasesStep 3: Environmental, Design and Construction Projects Construct Early Action Projects Project Delivery • Determine funding, financing and delivery methods for the program and early action projects based on the business plan • Construct and operate early action projects
Best Practices and Lessons Learned

• Expertise: Highly qualified and innovative professional services, coupled with UTA’s operations
  know-how
• Case Studies: Examine similar systems to understand successes and challenges
• Creativity: Identify approaches and methods to rapidly and effectively implement the business
  plan in harmony with communities

                           • Partnerships: Work to advance business plan, along with land use
                             integration and mindfulness to promote access to opportunity
                           • Communication: Listen to stakeholders and be transparent about
                             how to deliver the business plan
Discussion & Questions
Potential Issuance and Sale of
Sales Tax Revenue and Refunding Bonds
Other Business
a.   Next meeting on September 23, 2020 at 9:00 a.m.
Adjourn
You can also read